Bitcoin breakout can lead to near-term acceleration, while Ethereum following suit
Key Takeaways
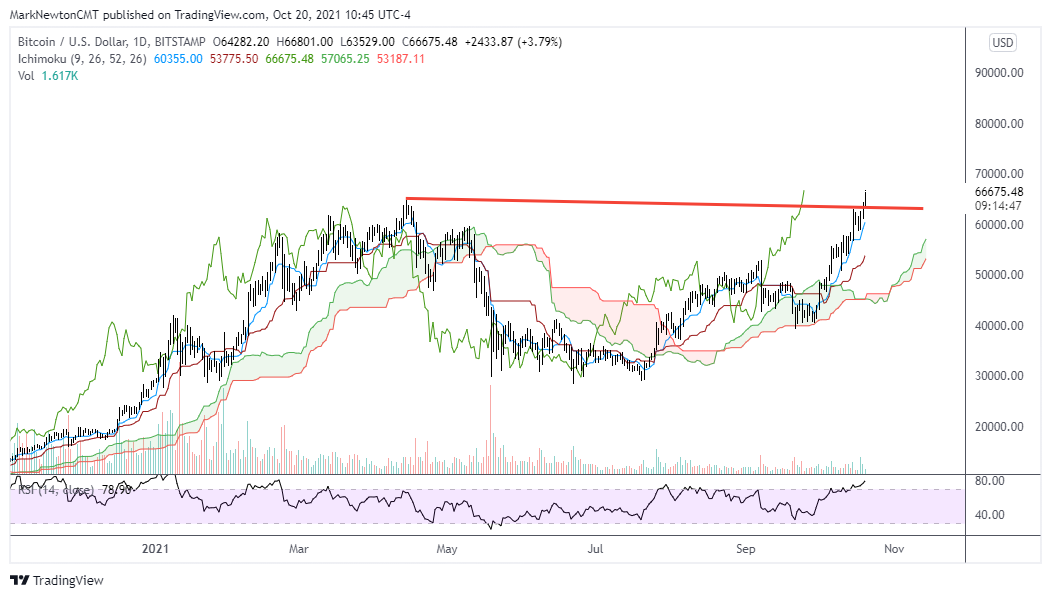
- Bitcoin took the lead in pushing back to new all-time highs on a closing basis Tuesday, coinciding with the successful launch of Proshares Bitcoin futures-based ETF
- Initial upside targets for BTC above 65k lie near 72.50k, then 89k, and thought to be definitely within reach on this breakout of former peaks.
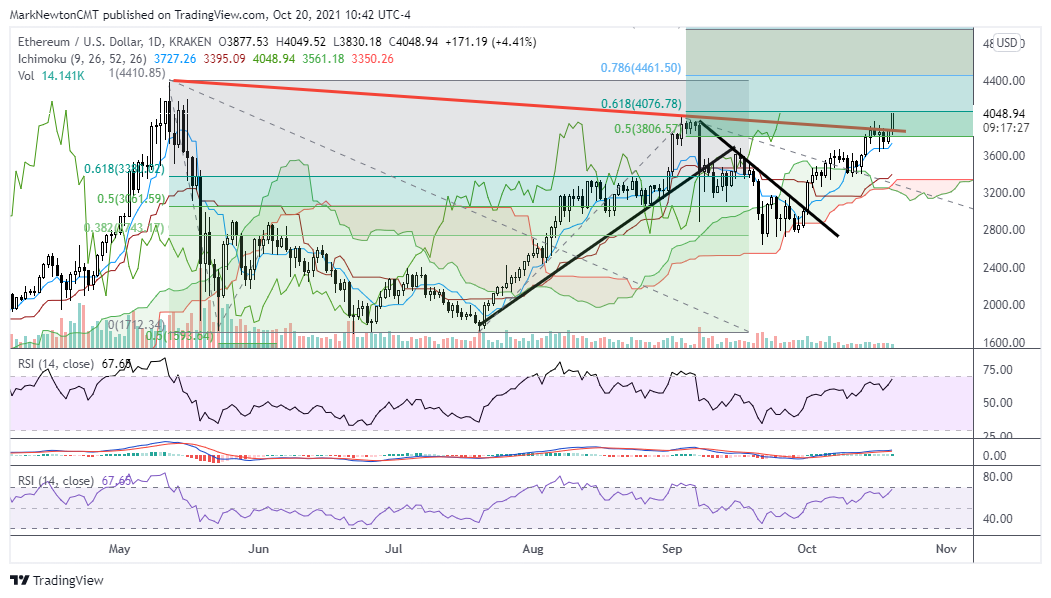
- Popular Alt-coins like ETH/USD, SOL/USD, DOT/USD, XTZ/USD, BNB/USD look close to their own breakouts, with Ethereum set to possibly make a new all-time weekly high close this week
BTC/USD officially made a new daily all-time high close on 10/19 and has now officially exceeded April 14th intra-day peaks. Technically I expect follow-through to 72.5k, and then 89k which is a 100% extension of the rally up from last March’s lows. My cycle composite projects a run-up into late Nov/early Dec. Bottom line, despite daily RSI having reached the highest overbought levels of the year, it’s right to favor additional gains.
Ethereum breaking out above September highs today (10/20)
Following its recent breakout in Market-cap Dominance chart, ETH/USD looks to gain ground on BTC/USD as prices are just pushing up to the highest levels since May and could potentially set a new all-time weekly high close this week with a close above 3954.01.
Targets above 4027 in ETH/USD should not face much resistance at 4410, but likely surpass this and rally to targets near 4951, with additional technical projections up to 5826.
The triangle pattern in ETH/USD from May highs is finally being exceeded this week. Technically this was thought to represent a continuation pattern, not a reversal pattern. Wednesday’s surge gives technical conviction that acceleration should commence to reach the targets listed above. While May highs have not yet been exceeded, this should be forthcoming as a result of 10/20’s successful breakout.
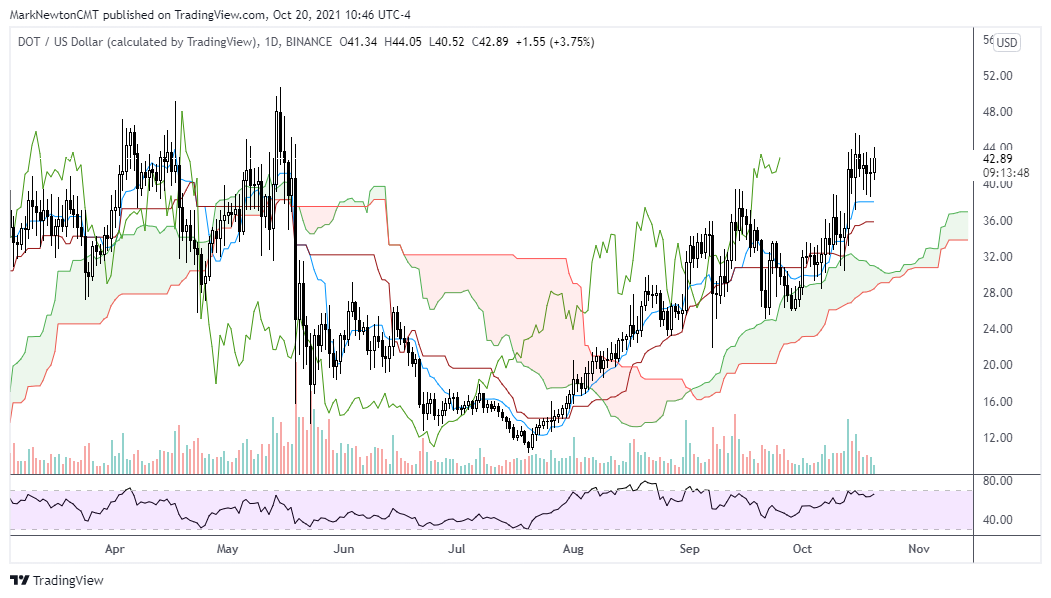
PolkaDot (DOT/USD) – DOT/USD has begun to show real strength in recent weeks following its breakout above September 2021 highs. This puts the alt-coin within striking distance of all-time highs made back in May. Recent consolidation this week is not bearish technically but merely signifies minor consolidation. Technically given the improving structure and bullish momentum, a push up to challenge 49-50.75 looks probable in the days/weeks to come. Pullbacks should prove short-lived and find support initially near $38, then $36.50, which would represent areas to buy dips.
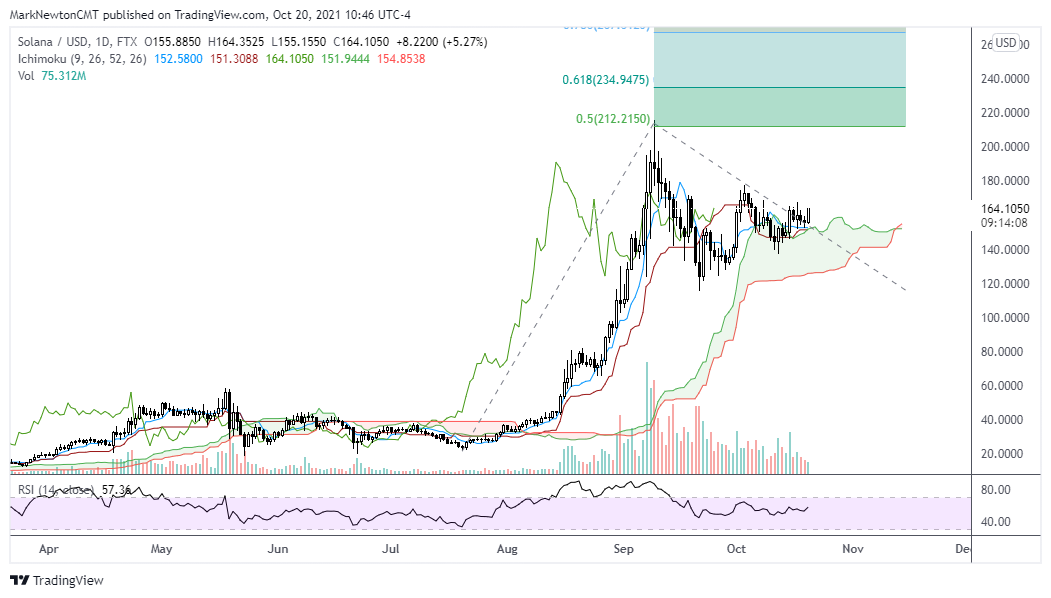
Solana (SOL/USD) Attractive to own given consolidation following its huge two-month surge. Solana also is quite appealing technically given its 900% gain from July to September which since has given way to constructive consolidation. Given that prices have successfully held up in the upper quartile of its range despite its sideways trading in the last month, this churning is thought to represent a very good risk/reward to buy SOL/USD. Breaks of either side of October’s range will determine direction, but given the extremely positive momentum and technical structure, the bias remains heavily biased towards an upside breakout. $167.47 is key resistance on the upside, while $137.68 is support. A breakout above $167.47 should lead at least to $235, with additional targets found at $308.54. Weekly charts show this pattern to represent a large “Flag pattern” which typically can accelerate on evidence of a push above highs of the range. In this case, a breakout above October highs should be followed.