
10K remains key resistance for BTC with 9.1K important trading support

Similar to other risk assets, such as the S&P 500, BTC has traded in a relatively narrow range under resistance through May. A breakout in either direction from the recent trading range is likely to signal BTC’s next tactical directional shift. 10k followed by 10.5k remain the levels traders are fixated on but 9.1K also remains an equally important trading level to be aware of.
Our bias is for an upside breakout to develop given BTC’s short-term (15-dma), intermediate-term (50-dma) and longer-term (200-week sma) trends remain positive. In addition, the advance-decline line for the FS CryptoFX 10 large-cap index is in a confirmed uptrend defined by a series of higher high and higher lows. BTC is also trending positively to the S&P 500 recently establishing 7-month relative high and it is challenging its 2018-2020 relative performance downtrends to gold and the TLT bond ETF. An upside rally above 10-10.5K resistance would likely be accompanied by an upside trend reversal to gold and the TLT confirming a new bullish uptrend to both. However, we also fully appreciate the risk of prejudging any technical pattern before it has resolved, a lesson we have learned once too often over the past 28 year of doing technical research. In fact, 9.1K, just below BTC’s rising 15-dma at 9.4K, is the level we would recommend higher frequency traders use as a stop loss level. Why? A break below 9.1K would signal a lower near-term low and a reversal of the March-May uptrend. Next support is at 8K near BTC’s 50- and 200-dma’s.
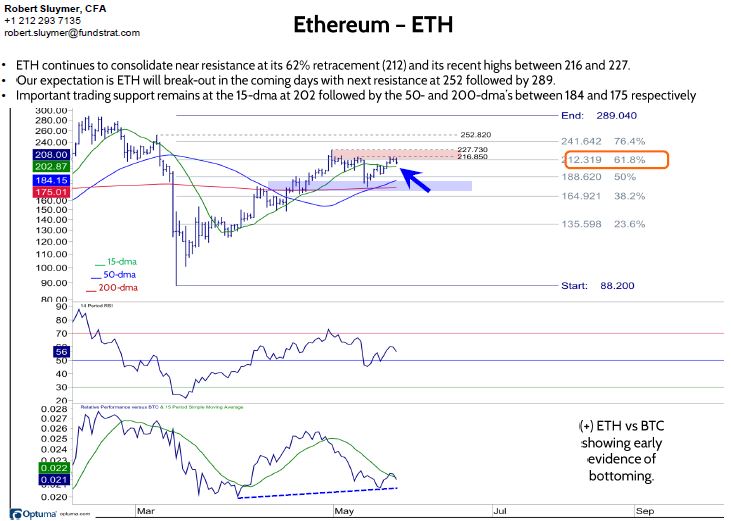
ETH – 216 remains resistance, 15-dma trading support at 202 – Not surprisingly, similar to BTC, ETH has rallied back to an important trading band between 216-227 resistance coinciding with a 62% retracement of the Q1 decline. For traders, we recommend using the 15-dma at 202 as a stop loss level given a break below that short-term support level would open a risk window to next support between the 50-dma at 184 and 200-dma at 175.
ADA – Break-out or fake-out? – 15-dma key downside support. In last week’s note, we featured ADA given it was exhibiting unique strength challenging its May highs ahead of most Alts with improving relative performance vs BTC. ADA is again noteworthy this week having broken out above the May highs (.054) ahead of BTC and ETH over the past two days. ADA’s recent break-out confirms its ongoing uptrend, and while it pulled back today, it would need to reverse below its rising 15-dma at .051 to signal a failed breakout with next support at its 50- and 200-dma’s at .042.
Fundstrat CryptoFX indices and A-D lines highlights – As noted above the FX 10 A-D line is in a confirmed uptrend defined by a series of higher highs and higher lows. Key upside resistance levels remain at the 2018-2020 downtrends for the FX10, FX 40 and FX250 cap weighted indices.