BTC’s short-term trend turns positive – 7K next hurdle followed by 8K

BTC – A volatile week but holding key trend support at the 15-DMA with potential to challenge 7K
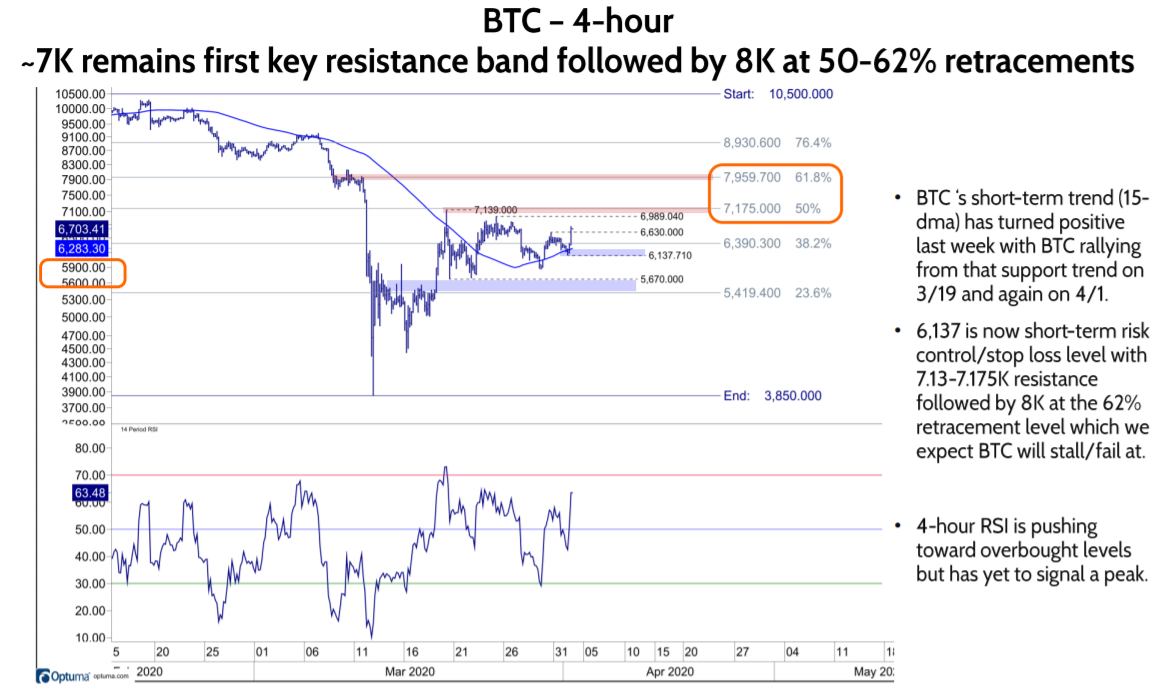
Despite all the macro volatility spillover across markets, BTC’s short-term technical setup is improving with the potential to challenge and break-out above formidable trading resistance near 7K. After a roller coast ride over the past two weeks that included stalling under 7K resistance on 3/20 through 3/26, hitting an air pocket and gapping down 10% on 3/29, BTC has managed to hold and rally from a now rising 15-DMA twice over the past three days.
What does all this mean technically?
While the 15-DMA is not perfect, it has been a reasonable proxy for BTC’s short-term trend, with today’s retest and bonce from 6137 reinforcing its significance. In other words, while BTC is arguably range bound in a congested technical band at 6-7K trading range, the rising 15-DMA supports staying long using the recent low at 6137 as a stop loss in anticipation of a potential break-out above 7K resistance. The 4-hour and daily charts for BTC on slides 3-4 may appear noisy but a move above next resistance near 7K should see BTC push toward its next resistance band coinciding with another 62% retracement band.
Longer-term – Consolidating above longer-term support
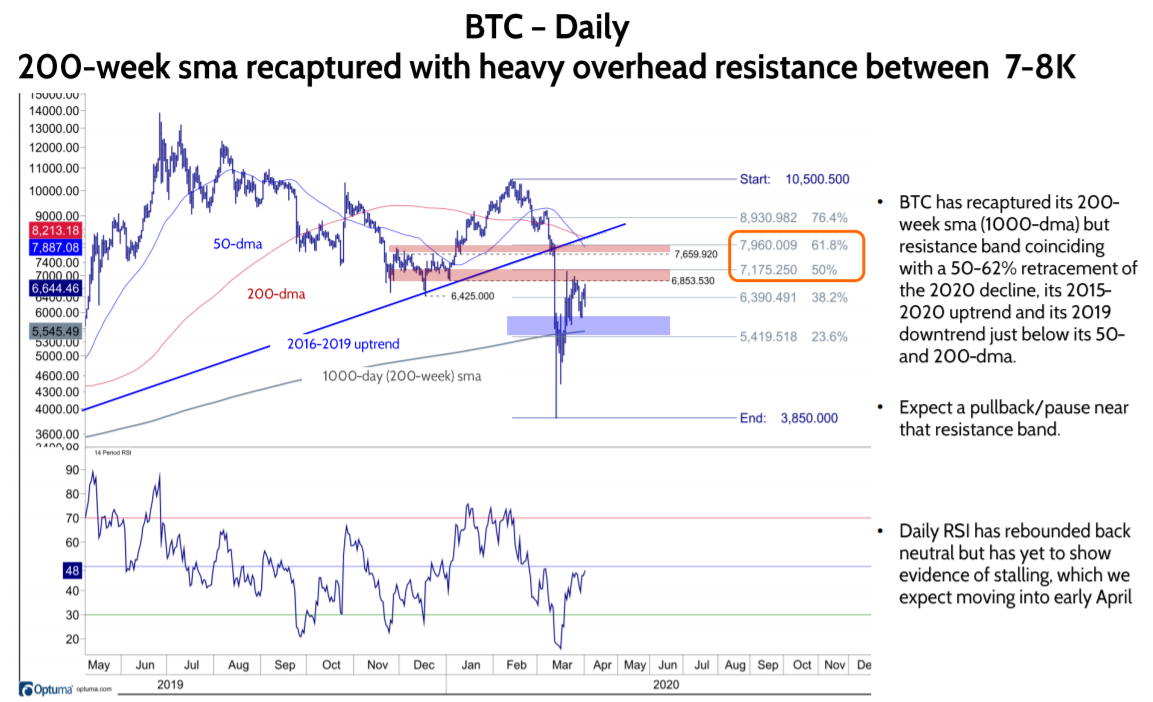
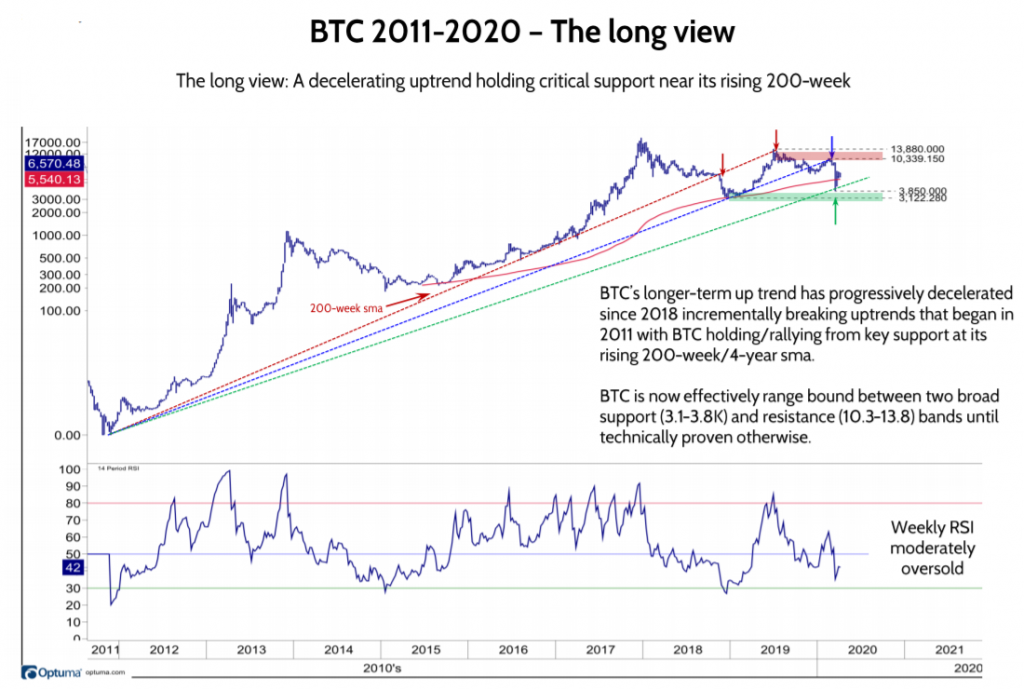
Stepping back to revisit the longer-term perspective from last week, we would reiterate that, while BTC’s long-term chart is dented, it’s not broken. Why? Recognizing breaking two linear uptrends dating back to 2011 is not bullish technical action, BTC has recaptured its rising 200-week SMA, which conveniently coincides with BTC long-term support defined by a curved uptrend line we have drawn in on slides 5. In addition, while correlations across asset classes gravitated toward 1 in March, BTC bottomed on March 13, along with many other macro extremes (VIX, TRIN, downside equity volume). Since, the week of equity options expiration, BTC appears to be incrementally reestablishing its own trading pattern, which we view as an encouraging sign.
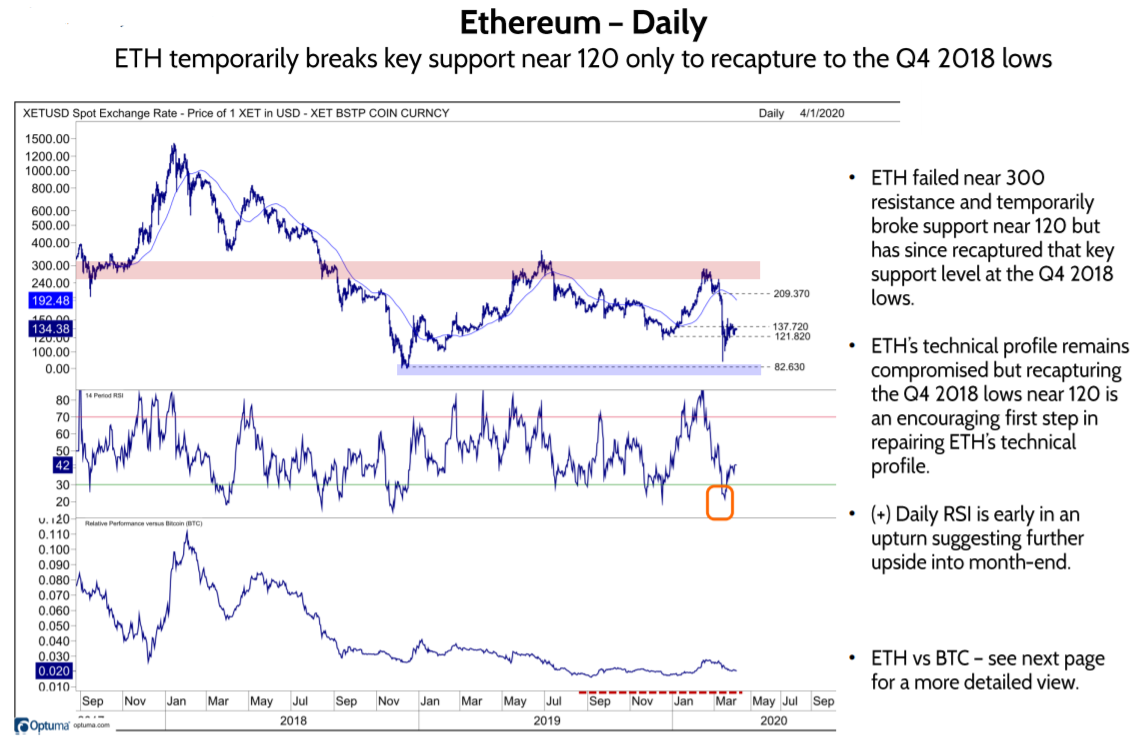
ETH
Similar to BTC, ETH remains in relatively narrow trading since late March around 135.
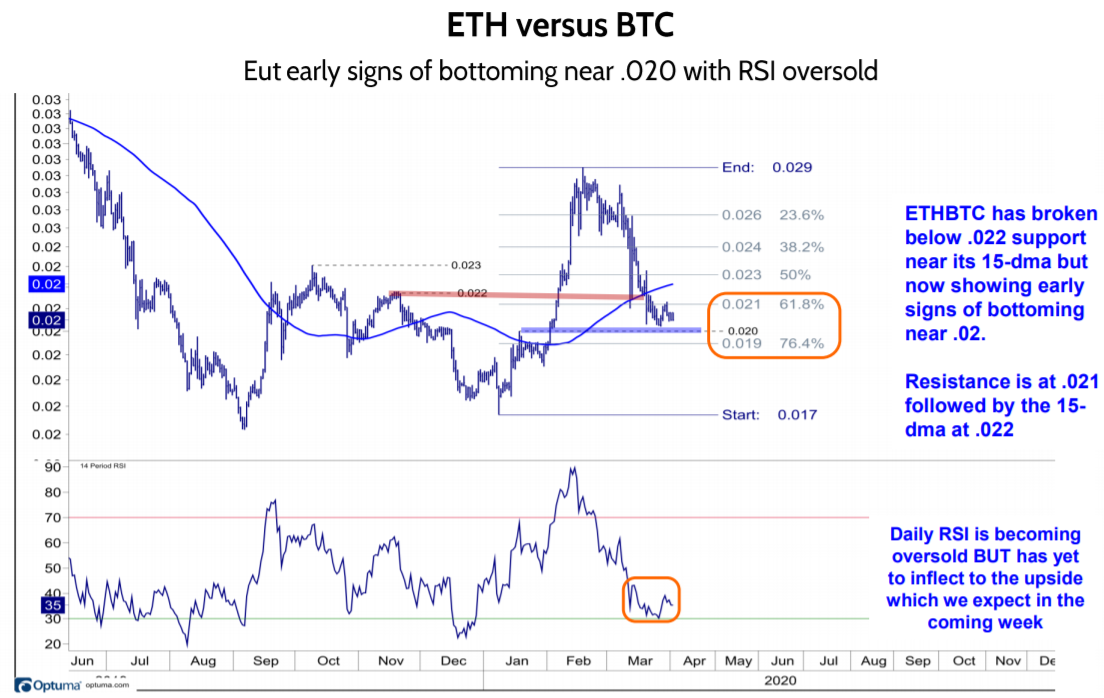
ETH-BTC
However, appears to be in the early stages of bottoming near .020 between its 62-76% retracement of the March decline. Daily RSI is oversold and beginning to bottom supporting incrementally adding exposure in favor of ETH.
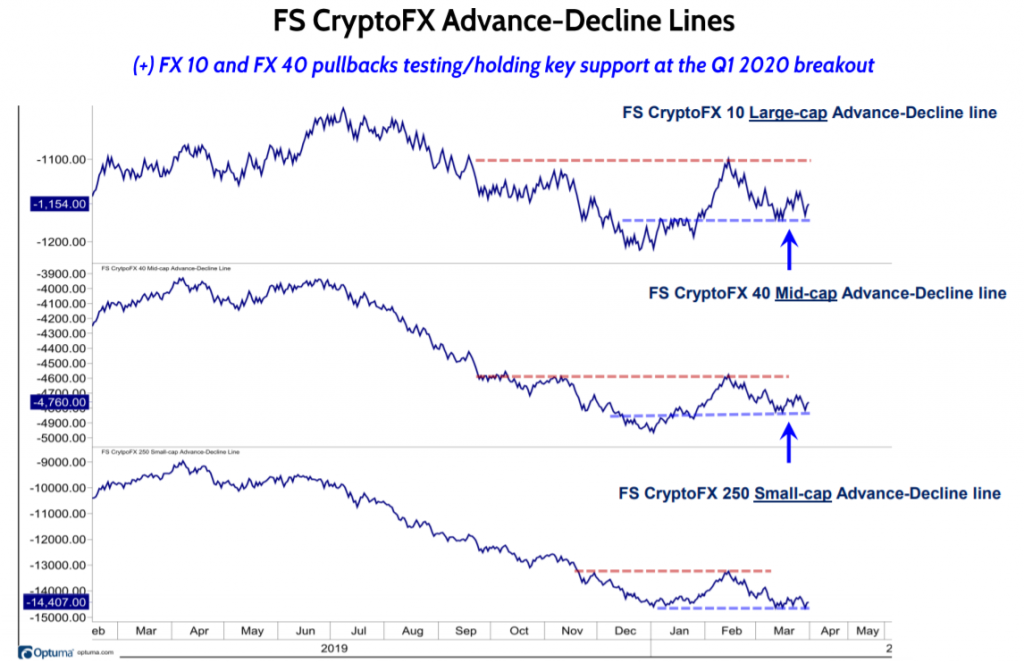
Fundstrat FS CryptoFX index highlights
The FX 10 large-cap and FX40 mid-cap A-D lines continue to show early evidence of bottoming above key technical support at their Q1 break-out levels.