
Data is Increasingly Supportive of a Rally into Year-end

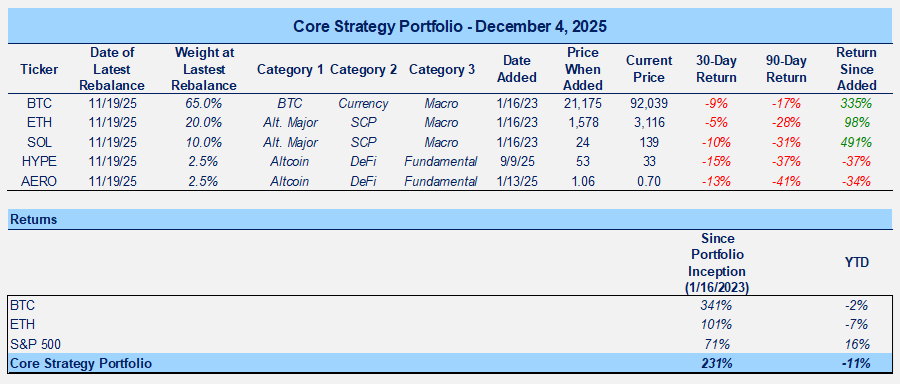
Core Strategy
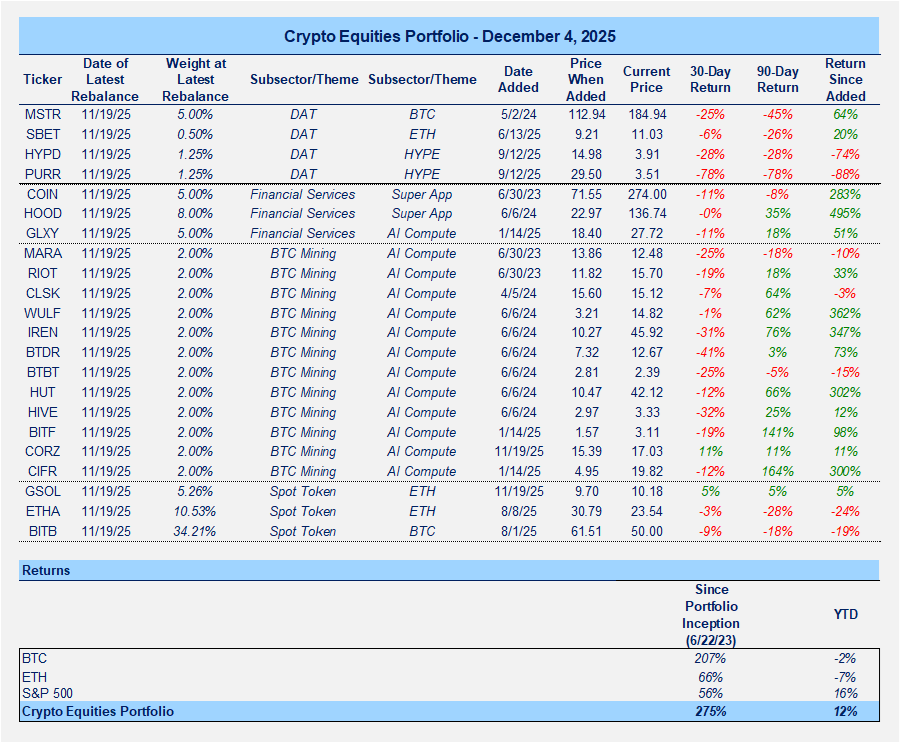
Crypto Equities Portfolio
TLDR
On 11/12, I highlighted an accelerated deterioration in market conditions and recommended raising cash or adding downside protection. By 11/18, early signs of capitulation were emerging, and I argued that we were due for at least a short-term bounce. I was admittedly a couple of days early, as BTC briefly revisited the low $80k range after trading near 88k, but several indicators have since reinforced the view that this was a local low for crypto. Across price action, ETF flows, derivatives positioning, liquidity metrics, and cross-asset relationships, the data has continued to turn more constructive. Taken together, these developments point to an environment that is increasingly supportive of a rally into year-end.
Oversold Conditions and Capitulation Set the Foundation
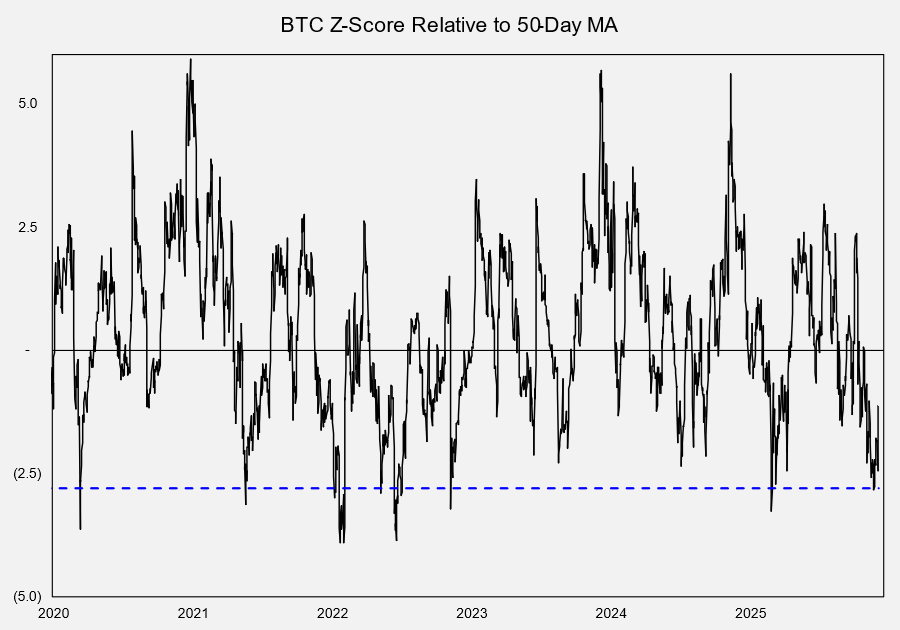
Extreme Oversold Readings: A couple of weeks ago, multiple indicators showed Bitcoin reaching oversold levels, with the selloff from early October reaching a pace and magnitude rivaling historical extremes. The most striking data point, in my view, was the BTC Z-score relative to its 50-day moving average, which hit –2.8, a relatively rare occurrence, comparable to the tariff-driven drawdown earlier this year. We noted that visits to these levels have most often coincided with sharp bounces.
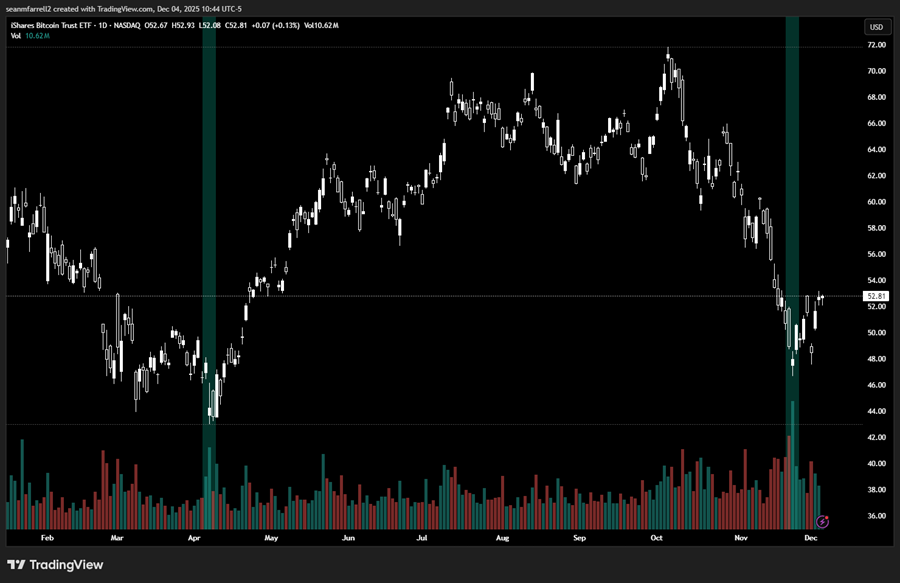
Heavy IBIT Volume at the Lows: On 11/21, IBIT posted a bullish daily candle alongside its highest single-day volume since inception. That kind of turnover is exactly what you tend to see at durable lows, with motivated sellers unloading into strong demand. The pattern also closely resembles the price and volume behavior seen around the April lows that ultimately set up Bitcoin’s Q2 to Q3 rally.
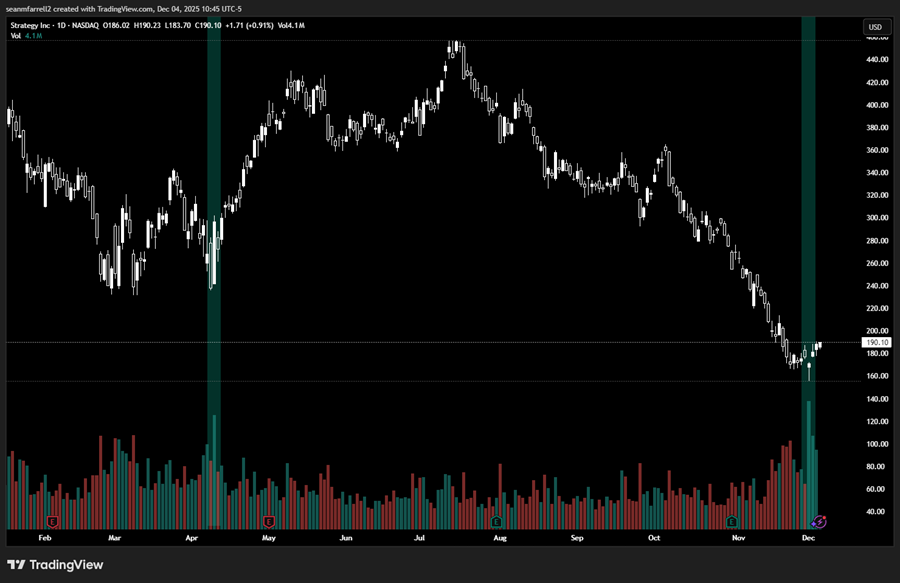
MSTR Capitulation: Strategy added a second capitulation signal this week. On Monday, the stock fell nearly 13% intraday before sharply reversing and finishing roughly 10% off the lows. It also posted its highest volume of the year. This occurred while fear was spreading through the market that the company would sell its BTC to fund dividends, despite having already raised $1.4 billion which covers ~21 months of dividend payments. The price action is also quite like the exhaustion dynamics seen in early April when crypto and broader risk assets bottomed.
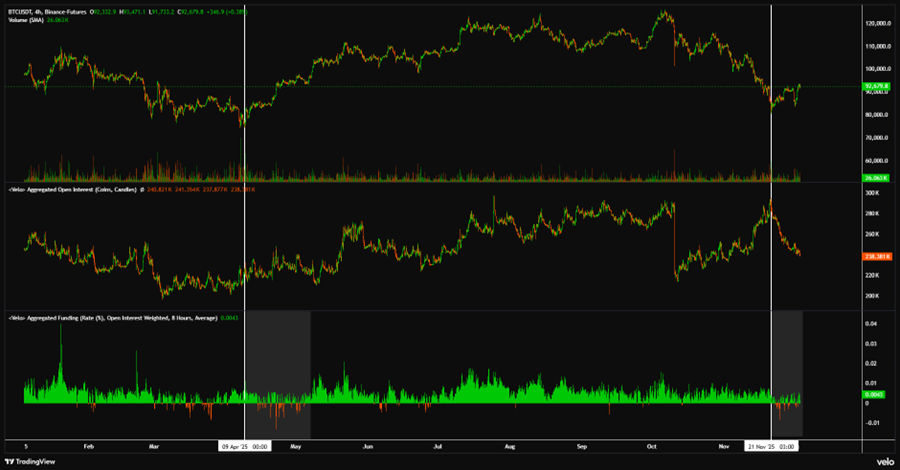
Perpetual Futures Suggest Possible Bear Complacency: Perpetual futures markets are showing classic signs of trader exhaustion. Open interest has been grinding lower while funding rates have intermittently turned negative. This typically signals long positioning being unwound after prolonged weakness and shorts becoming complacent even as price moves higher.
Flow Trends Improving
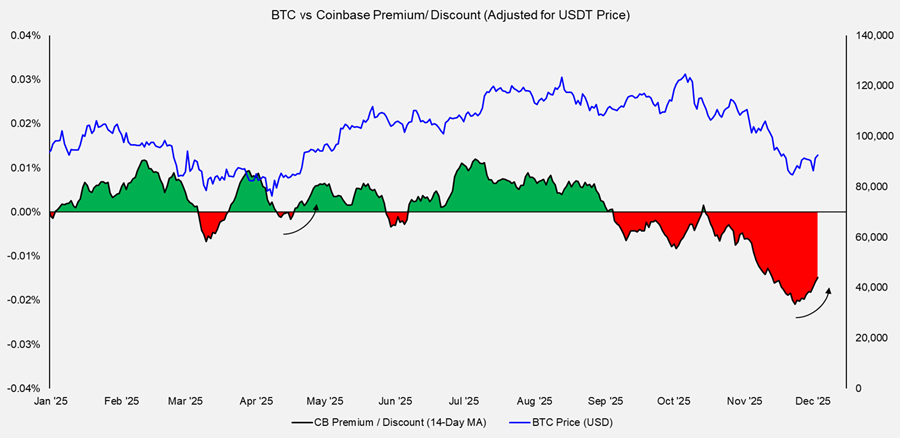
U.S. Spot Demand Returning: The Coinbase–Binance spread has shifted decisively into premium territory in recent days (during US trading hours). The 14-day moving average bottomed almost exactly when BTC bottomed and has risen steadily since. We saw a similar pattern at the April lows, albeit following a much less extreme discount period.
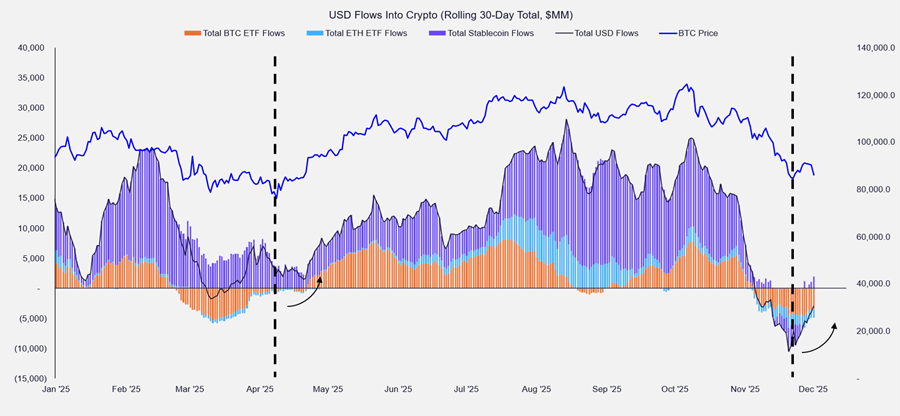
Aggregate USD Flows Trend Inflecting Higher: When aggregating BTC ETF flows, ETH ETF flows, and stablecoin creations into a rolling 30-day change metric, we can see that the multi-month trend of net outflows has now reversed course. This inflection also coincided with the BTC bottom on 11/21.
Liquidity Conditions Improving
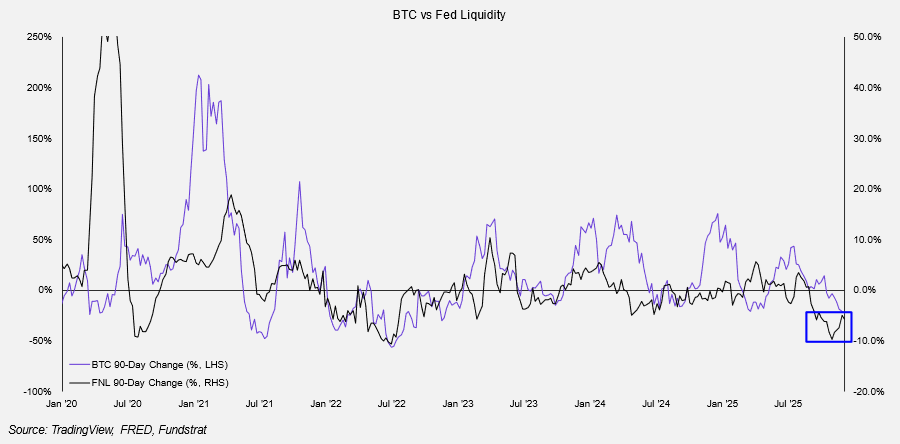
Fed Net Liquidity Trends: Fed Net Liquidity (Fed assets net of TGA + RRP) had been trending lower, and its 90-day change has tracked closely with Bitcoin’s 90-day returns. However, this trend now appears to have bottomed out. With the government having reopened, the TGA balance will likely be spent back into the private sector, lifting Net Liquidity over the coming weeks.
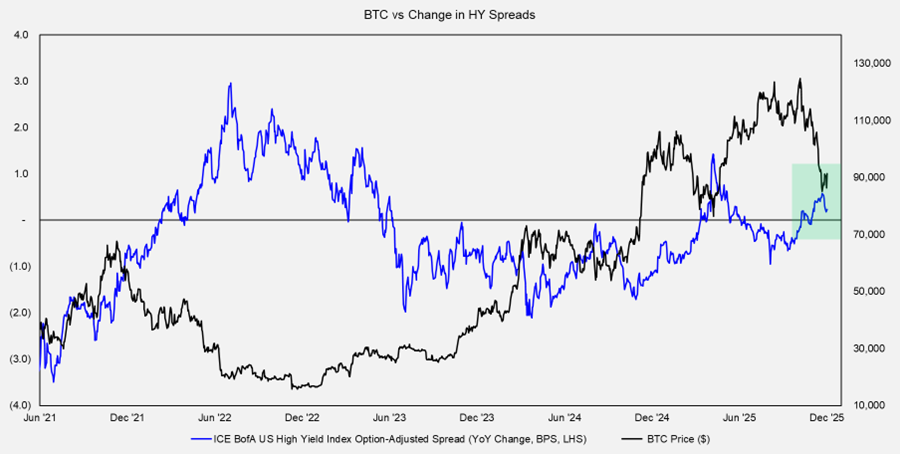
Spreads Tightening Again: The recent growth scare tied to the government shutdown and concerns about a potential Fed mistake has eased, and fears of credit contagion stemming from private credit have also moderated. As a result, high yield spreads have stopped widening. The YoY trend in spreads is important for crypto, and seeing this move lower again is encouraging. Barring any surprises in macro data or Fed speak over the next couple of weeks, I think this trend has further room to decline, which should support credit creation, improve liquidity, and ultimately benefit crypto. It is worth noting that spreads do not need to tighten from here for the YoY trend to fall. If spreads simply hold at current levels, the YoY comparison will continue to move lower.
Cross-Asset Dynamics
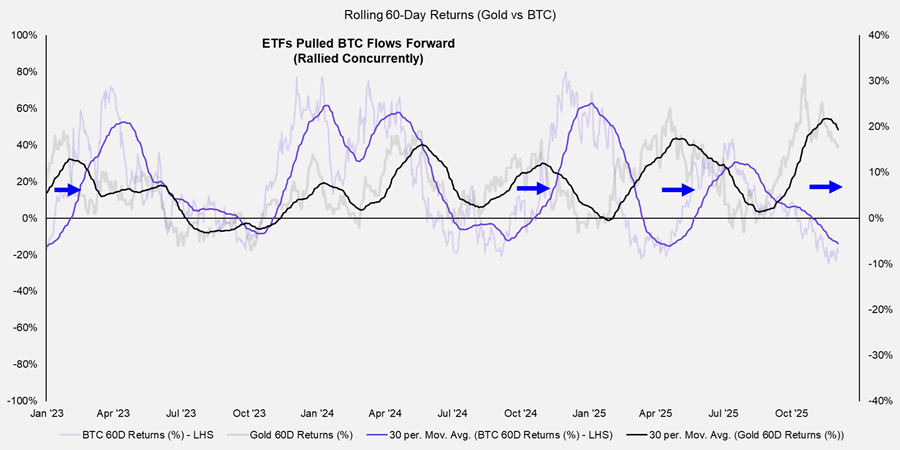
Gold Finally Passing the Baton to Bitcoin? Since early 2023, gold and Bitcoin have taken turns leading on a rolling 60-day return basis, with the lone exception being around the time of the ETF launch during which both assets rallied concurrently. Recent performance suggests gold may once again be yielding leadership back to Bitcoin.
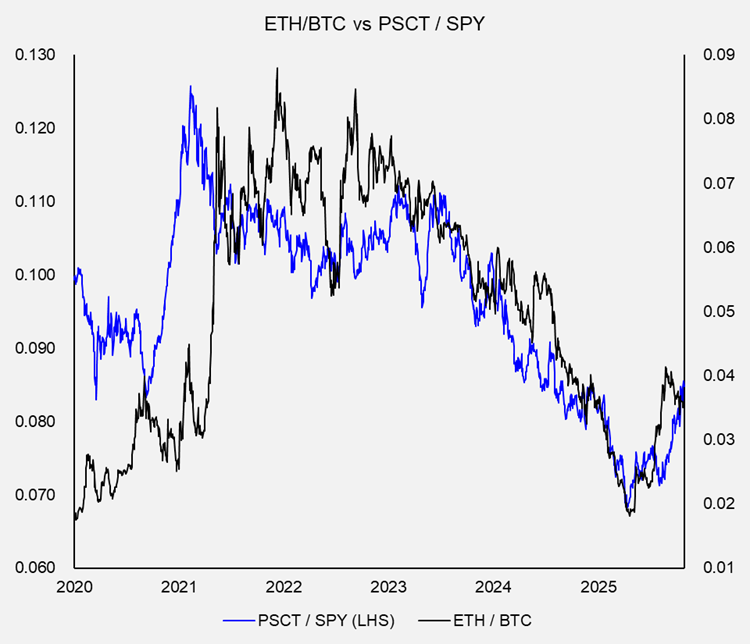
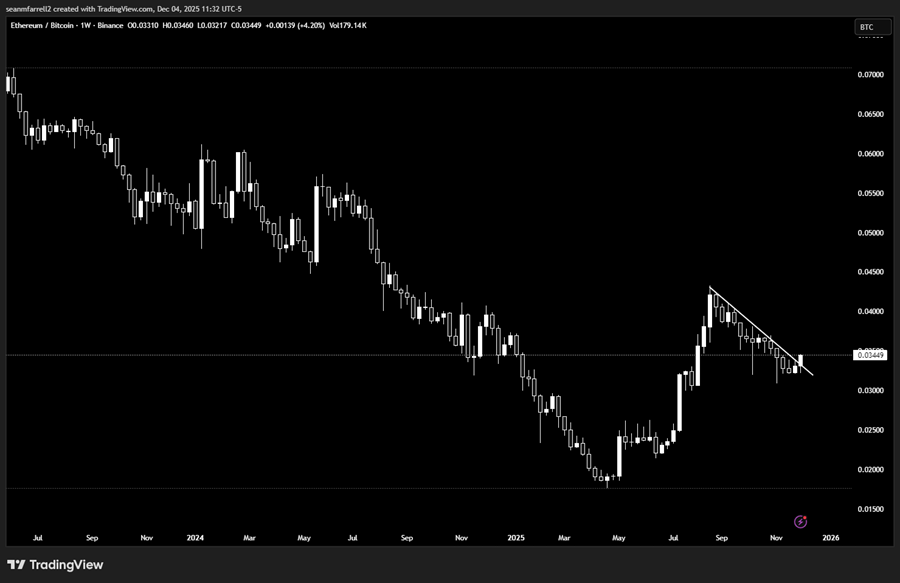
Small-Cap Tech Leadership Supports ETH/BTC and Broader Altcoin Universe: Small-cap tech has outperformed in recent days following a sharp drawdown, and the equal-weight S&P 500 has finally begun to show progress. Since ETH is often viewed as a quasi-small-cap-tech asset from institutional market participants, the ETH/BTC ratio typically strengthens when small-cap tech leads. This leadership also tends to spill over into the broader altcoin space once ETH begins to perform well. Historically, once ETH strengthens, leadership tends to broaden out into the larger altcoin universe as well.
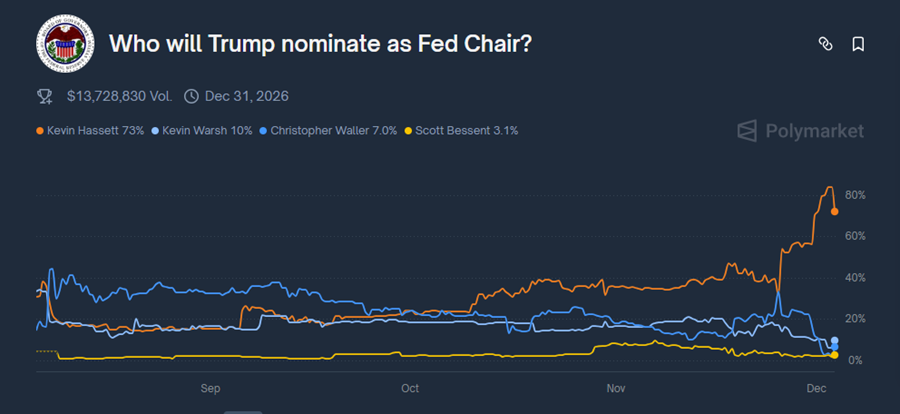
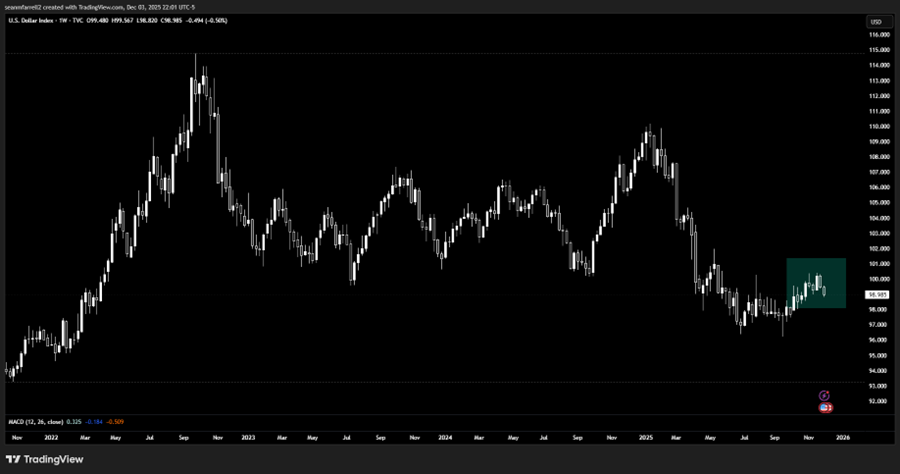
FOMC Developments & Weakening DXY: The rising probability that Kevin Hassett becomes the next Fed Chair represents a meaningful shift in the outlook for short-term rates. Hassett is widely viewed as the most White-House-aligned candidate. If confirmed, his appointment would likely result in a more dovish FOMC, looser financial conditions, and an environment that is more supportive for liquidity sensitive assets such as crypto, all else equal. It is therefore unsurprising that the DXY has begun to roll over again in recent weeks. A White House aligned Fed Chair would make it easier for the administration to implement a weak dollar policy.
A Strengthening Bull Case as Year-End Approaches
Across oversold conditions, capitulatory behavior, improving flows, a bottoming liquidity backdrop, and supportive macro and cross-asset signals, the evidence increasingly supports a constructive view into year-end. The setup resembles prior turning points, including April, when macro, liquidity, and flow indicators aligned just as positioning washed out.