

Zooming Out

Key Takeaways
- This week, we witnessed companies revise expectations lower due to a strong USD. We discuss Bitcoin’s historical relationship with the U.S. dollar and highlight evidence that suggests positive forward returns for bitcoin.
- On a fundamental basis, the risk-reward for bitcoin is looking quite attractive. We review the historical forward returns at bitcoins’ current MVRV multiple of 1.26x.
- Bitcoin is nearing a long-term support level. Since bitcoin’s inception, the 200-week moving average has served as a generally reliable level of downside support for BTC price.
- Our technical analysis expert, Mark Newton, offered his opinion on the near-term outlook for bitcoin this week. In short, he thinks that bitcoin is showing signs of bottoming.
- Strategy – This month is a busy one for the economic calendar. The market’s reaction to QT, rate hikes, and CPI should lend some firmer guidance on how the second half of this year will look. Despite signs of seller exhaustion, our near-term outlook remains cautious. To reiterate our current stance, we maintain that it is wise to reduce exposure to altcoins and hedge long exposure in the immediate term (1-month). However, we are still constructive on cryptoasset prices in 2H. Importantly, we think this is the time for medium and long-term investors (1+ year) to consider allocating to bitcoin more aggressively.
Recently, we have been quite cautious about cryptoasset prices in the immediate term, recommending that investors hedge to the downside. We still think this is appropriate given the relentless hawkish signaling from the Fed and lack of conclusive softening economic data. While we believe there are signs of inflation turning over, we find it difficult to rationalize anyone with near-term liquidity needs to bet the farm on cryptoassets.
However, we want to take some time today to look at a few variables that demonstrate that if one’s investment time horizon is greater than 1-2 months, now is a great time to start allocating size to bitcoin.
Fiat Stuff
This week we had several companies issue weaker guidance. While many are concerned about demand destruction negatively affecting the real domestic economy, the major companies that revised their expectations (Microsoft, Salesforce) did so due to the dollar’s strength (DXY). Despite our long-term view that fiat currencies are structurally inferior to bitcoin, the current macro landscape has caused many investors to rush to the greenback.

Anticipated rate increases and monetary tightening have caused the dollar to soar over the past six months to levels not seen since 2017. A stronger dollar makes goods and services more expensive overseas and potentially reduces the relative value of companies that sell products abroad.
While the USD’s strength depends on many other factors throughout the economy, the inverse of the DXY is generally a good proxy for the level of risk-on liquidity in the market. If we look at the relationship between the DXY and bitcoin below, we can see that there is somewhat of an inverse relationship between the two assets.
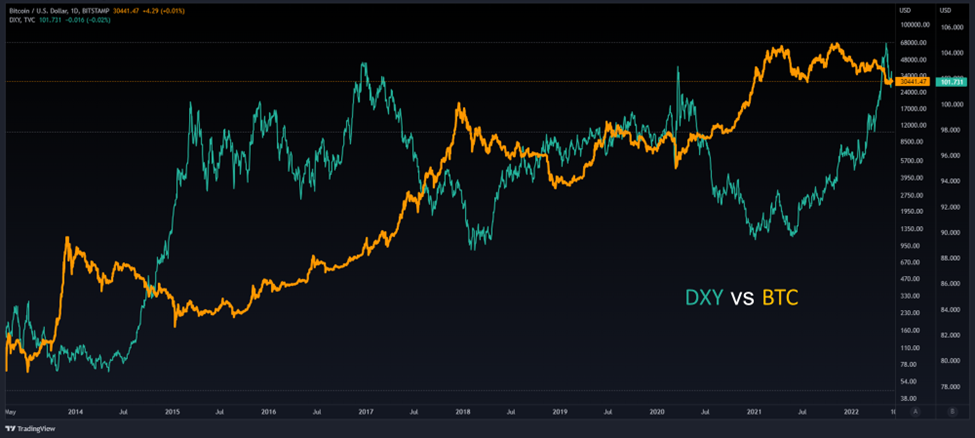
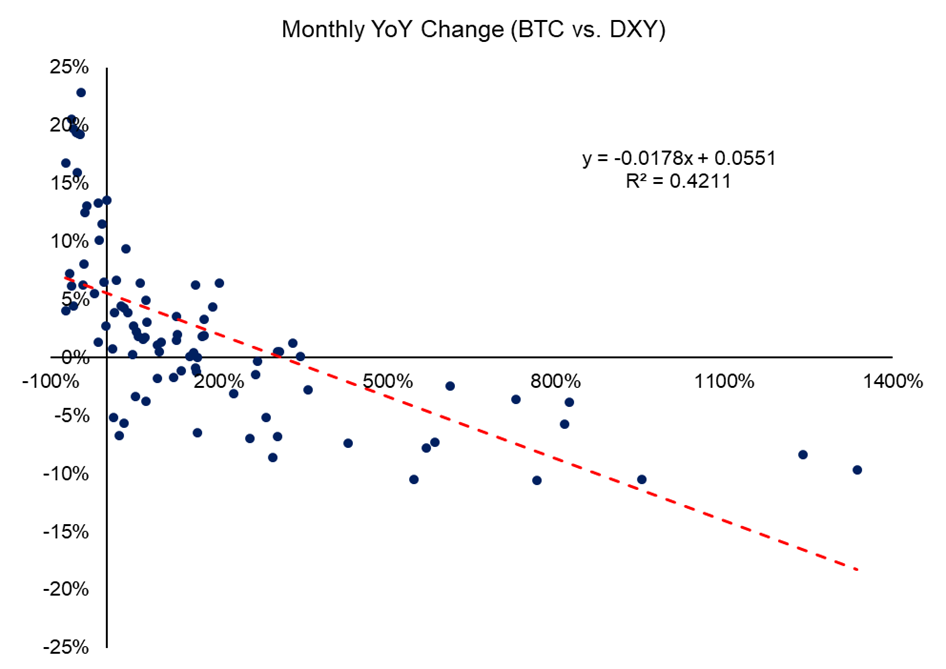
Drilling down a step further and mapping out monthly returns since 2015, we see a relatively strong inverse correlation of YoY returns for USD and BTC. Generally, the more strength that the dollar gains YoY, the weaker BTC gets. This summarizes the market dynamics of the past six months quite well – not just for BTC but for all risk assets
I know what you are thinking – if the Fed keeps to its promises and hikes 50 bps at the next two meetings and follows through with $95 billion of QT per month through the end of the year, won’t the dollar keep rising?
History proves that this is not necessarily the case. Like other markets, currency markets often overshoot economic expectations and revert to the mean. The chart from Reuters below speaks to this fact. Of the four Fed hiking regimes listed below, three experienced negative returns on the dollar index after the hiking regime had commenced.
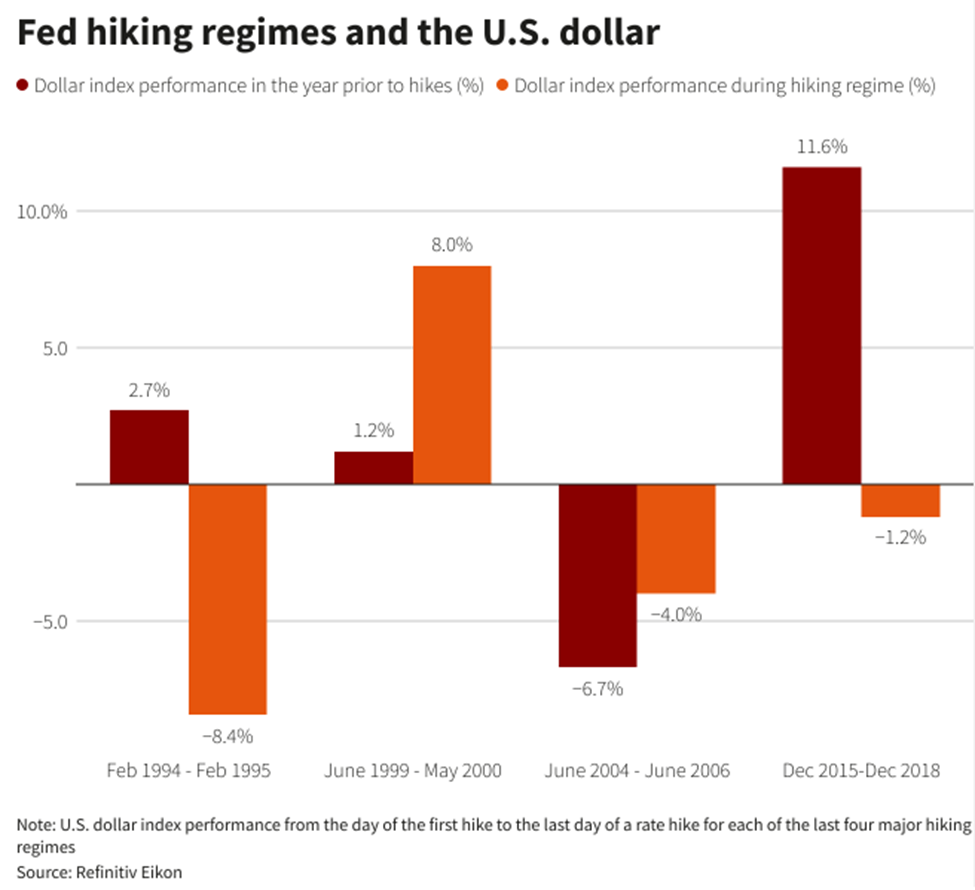
Analysts have already started to proclaim that the dollar has peaked, lending credence to the theory that the YoY return on DXY over the next year should be negative.

We can put together a back-of-the-envelope analysis to see what this macro shift would imply for bitcoin. Let’s assume:
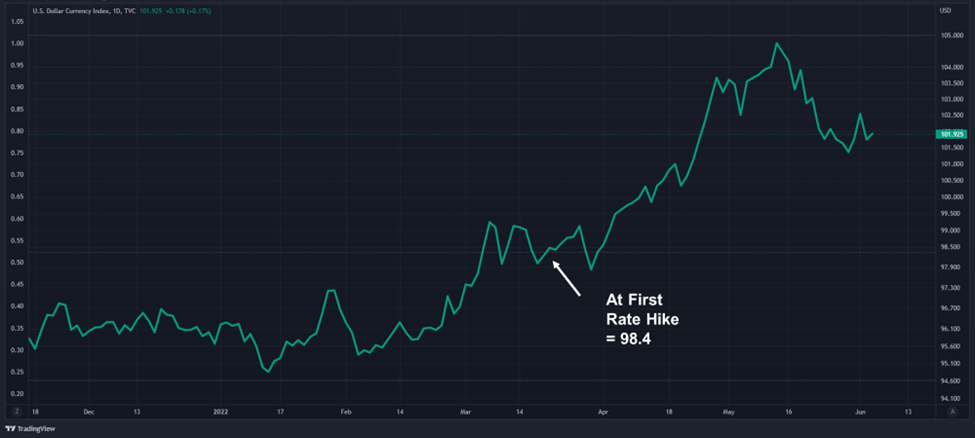
- This rate hike cycle started in March with the first 25 bps hike, implying a starting value for DXY of 98.4. As indicated by the figures above, most of the impending tightening would have been priced in at this point.
- The rate hikes are put on pause one year from now. This is probably the most subjective assumption in this illustrative analysis.
- A lot of the dollar’s current strength was priced-in ahead of rate hikes, and DXY reverts to 98.4, down 3% from its current level of 101.9.
Using this projected annual return for DXY as an input in the inverse relationship observed above, we reach an implied forward return of 6x for bitcoin, or a price of approximately $180,000.
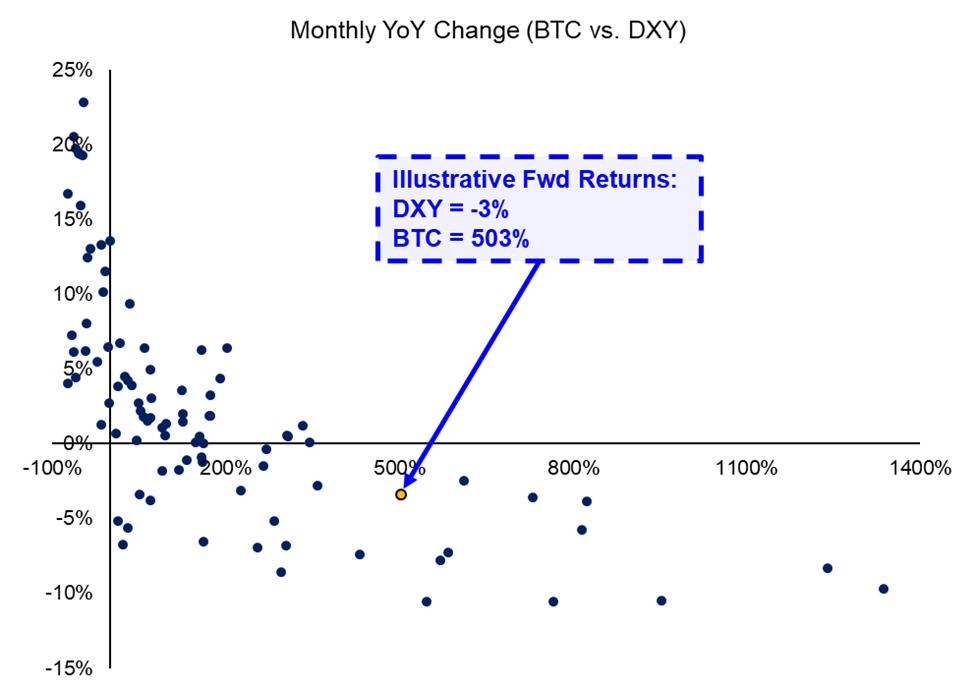
A key element of this exercise is that the relationship between bitcoin and USD has little to do with absolute levels and more to do with the rate of change. Thus, when thinking about where the dollar will be a year from now, we must consider that the leading reserve currency will need to break levels not seen in nearly 20 years to keep climbing.
To be clear, the strength of the US dollar does not 100% explain the performance of bitcoin. Several other factors influence bitcoin’s price. However, the relationship is strong and the likelihood of the DXY continuing to strengthen at its current rate is low. If the dollar reverses its current trend, as many are expecting, this changing tide should serve as a favorable tailwind for bitcoin.
Relative Value
In addition to favorable macro tailwinds, investors should also take comfort in knowing that bitcoin is currently trading at a fundamentally undervalued level.
Market cap to realized cap (MVRV), a metric we look at to assess the value of the network relative to capital invested, is nearing levels we haven’t seen since March 2020. Bitcoin’s MVRV multiple has spent time at or below its current level of 1.26x a mere 621 days since 2015.
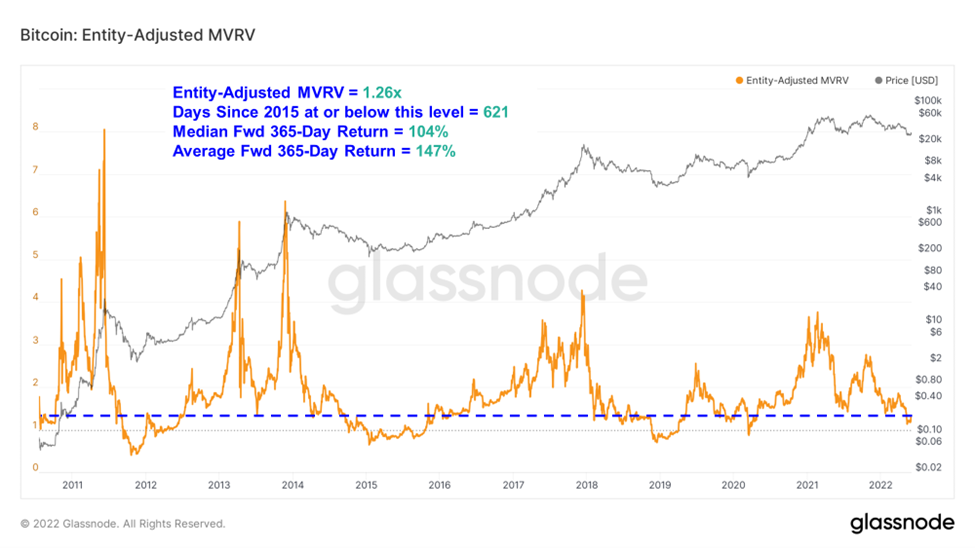
The 365-day forward returns at or below an MVRV of 1.26x are quite impressive to the upside. Of the 621 days at this level, only six days registered negative forward annual returns. The median return was 104%, and the average return was 147%.
In short, negative forward returns from this area would be a statistical anomaly. On a fundamental basis, the risk-reward for bitcoin is looking quite attractive.
Long-term Secular Trends Point to A Bottom
Another major reason that investors with longer time horizons can start to be more aggressive with their allocations to bitcoin is that the asymmetry is conclusive to the upside. While our team thinks there is a chance of rechallenging this year’s lows, we are close to a long-term structural support area in the 200-week moving average.
Since bitcoin’s inception, the 200-week moving average has served as a generally reliable level of downside support for BTC price. We see that bitcoin’s troughs in 2015, 2019, and 2020 all bounced off this level.
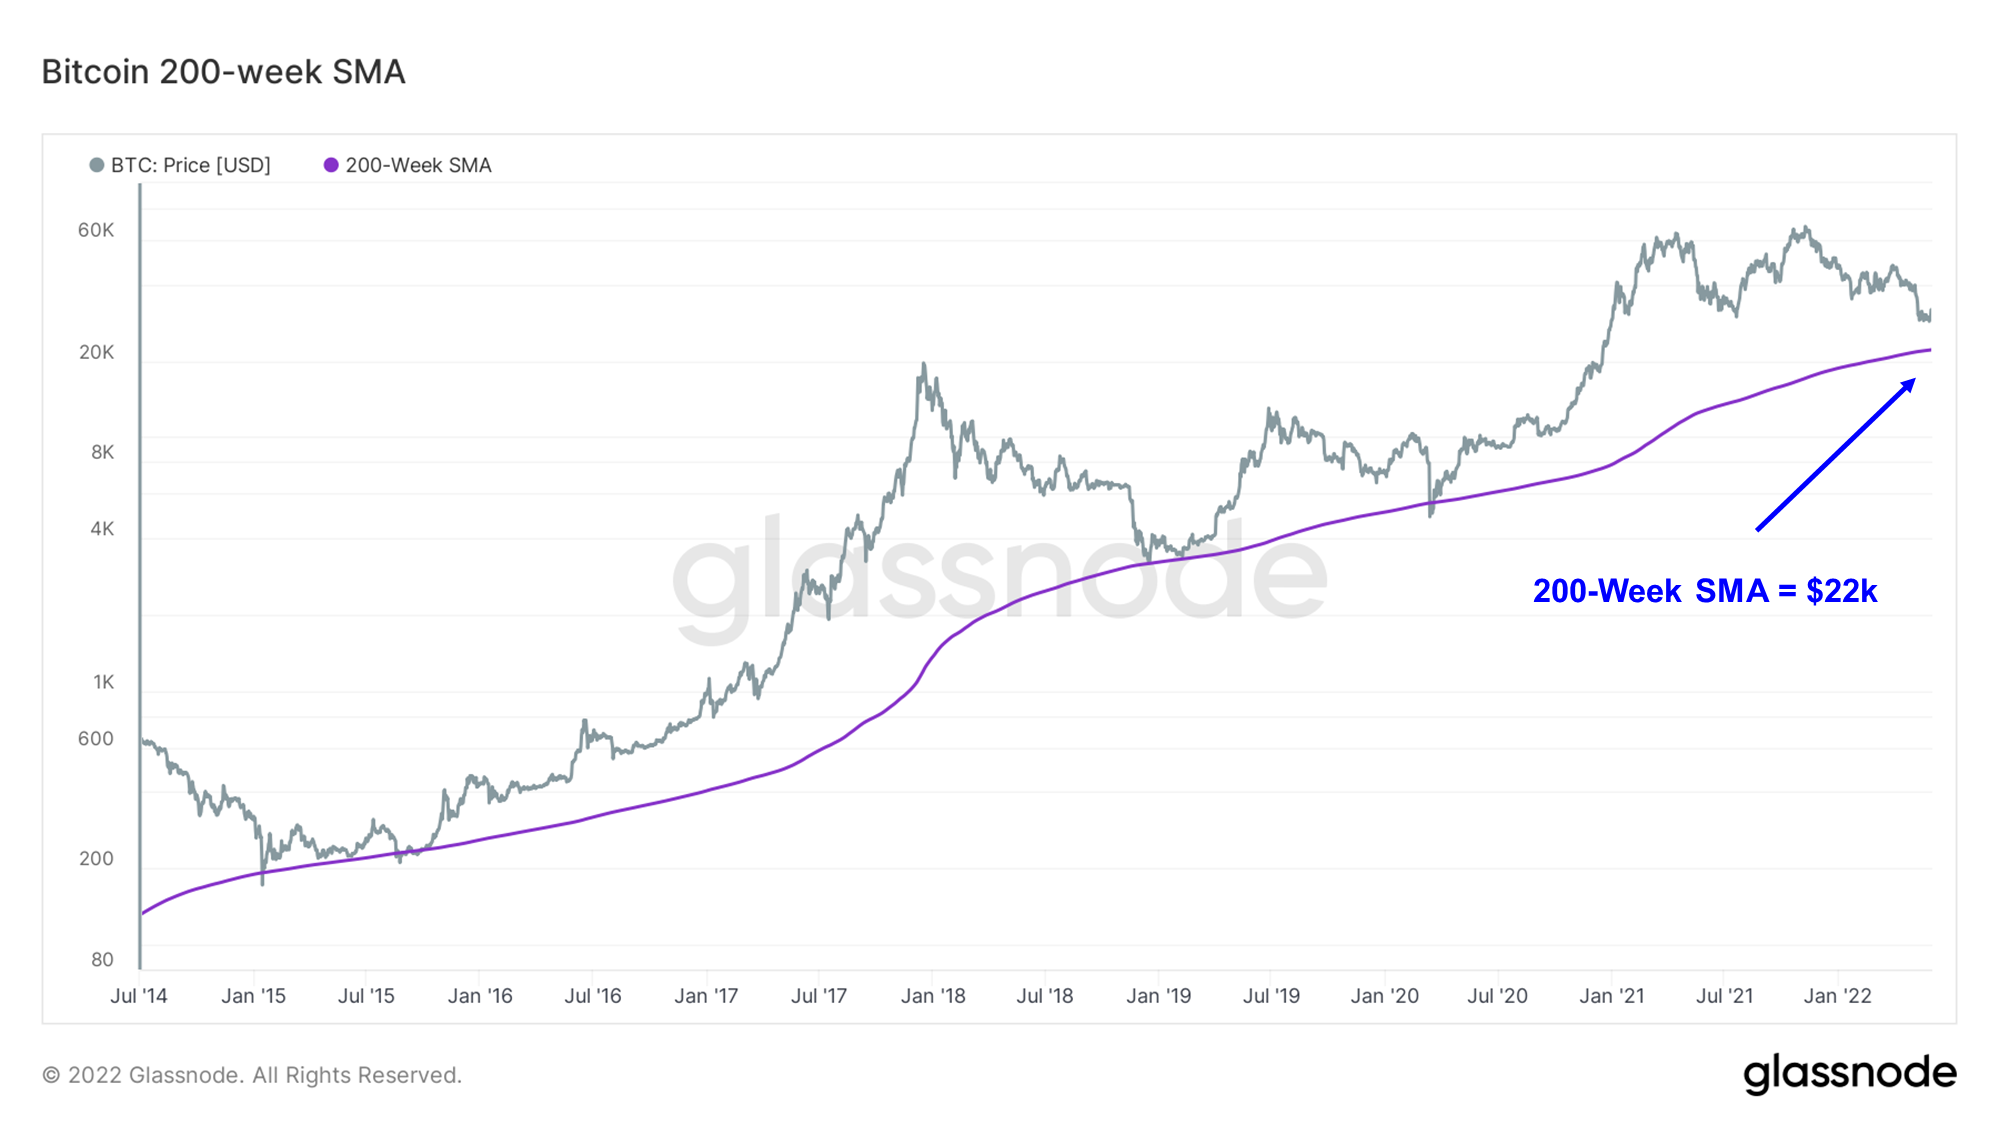
The current 200-week support is around $22k, meaning that any wick to the downside would likely find a supportive bid 25% below current prices. While this would not be a desirable outcome for short-term investors, we see that every bounce off this level has been relatively decisive and has resulted in impressive forward annual returns.
Bullish Technical Outlook
Finally, we would like to loop in our technical analysis expert, Mark Newton, who offered his opinion on the near-term outlook for bitcoin this week. In short, he thinks that bitcoin is showing signs of bottoming. While he still needs to see some more progress to have some confidence in this prognostication, at the very least, this is ample corroboration that the current asymmetry (on a forward 1-year basis) is conclusive to the upside.
From Mark:
“Bitcoin looks to have bottomed. However, more upside progress needed to suggest intermediate-term trends have shifted back to bullish.
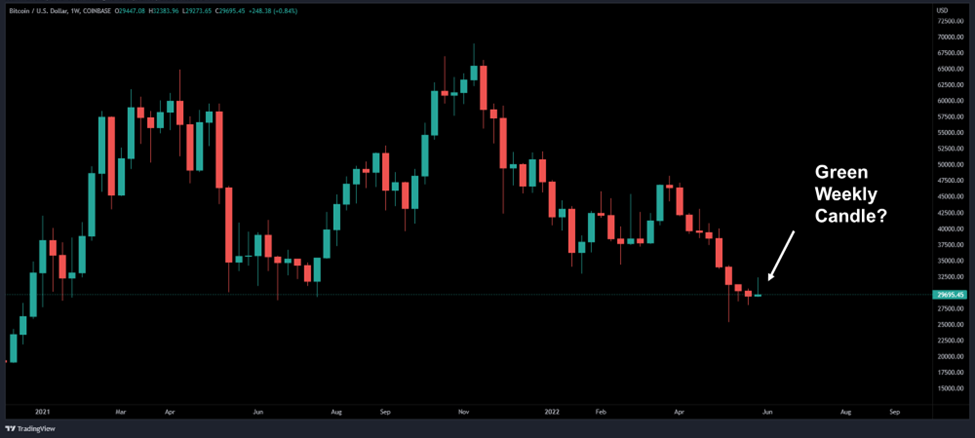
Bitcoin has shown some impressive recovery in recent days, and its move back above 30,628 gives some confidence that a technical bottoming process is getting underway. While it might take some time for intermediate-term trends and momentum to improve, it looks right to position long for rallies up to
34,218 initially. This marks the first meaningful upside target that also aligns with BTCUSD’s two-month downtrend. Moreover, the ability to climb back over 35k argues for little to no real resistance until 36834-37416 which marks the 50% retracement of BTC’s high to low range from March to May 2022 and lines up with prior early month lows made in May.
Until larger downtrends are broken and/or signs of a five-wave Elliott-style advance off the lows takes hold, it will be difficult to project meaningfully higher, and/or have true conviction that May lows can’t be tested. However, the degree of negative sentiment combined with recent technical progress to multi-week highs following a steep six-month correction suggests that a much better risk/reward opportunity exists now to position long vs a few months ago. Furthermore, if lows for the year are not already in place, this should come about by mid-June.
Bottom line, it’s right to be long, expecting higher prices near-term, and some intermediate-term optimism is in place now, which will strengthen on evidence of further technical progress.”
Strategy
This month is a busy one for the economic calendar. The market’s reaction to QT, rate hikes, and CPI should lend some firmer guidance on how the second half of this year will look. Despite signs of seller exhaustion, our near-term outlook remains cautious. To reiterate our current stance, we maintain that it is wise to reduce exposure to altcoins and hedge long exposure in the immediate term (1-month). However, we are still constructive on cryptoasset prices in 2H. Importantly, we think this is the time for medium and long-term investors (1+ year) to consider allocating to bitcoin more aggressively.