
Things Could Get Weird

Key Takeaways
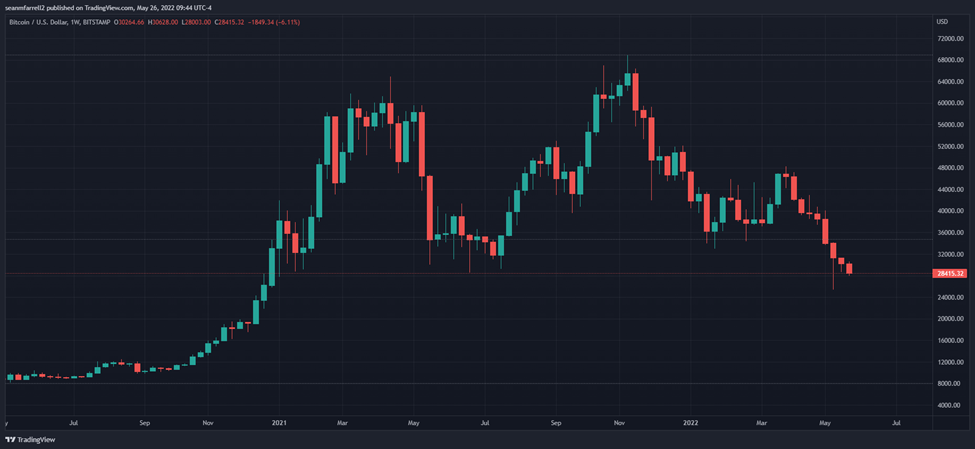
- Volumes have receded following the significant selloff a couple of weeks ago as Bitcoin fights to avoid its ninth consecutive week in the red.
- As Bitcoin trades in lockstep with QQQ, we examine the asset’s performance outside US trading hours. We also break down the regional performance of Bitcoin. The data suggest that dovish actions by the PBOC have led to recent outperformance in Asia.
- We explore how holidays, including Memorial Day, produce highly illiquid environments for trading crypto, potentially leading to sharp price swings.
- Derivatives and on-chain data show leverage in the Bitcoin market is increasing. However, funding rates suggest that concern about cascading liquidations is premature.
- Strategy – Despite signs that we are approaching seller exhaustion, our near-term outlook remains cautious. It is reasonable to expect downside volatility around continued rate increases and QT. We think opportunistically purchasing near-term put protection on long crypto positions and reducing exposure to more speculative altcoins are valuable measures to mitigate this risk. Despite this, we remain constructive on cryptoasset prices for 2022 and expect tides to shift in early 2H.
Moving Sideways
To the relief of many crypto investors, the market has mostly churned sideways this week. Volumes have receded following the large selloff a couple of weeks ago as Bitcoin fights to avoid its ninth consecutive red weekly candle.
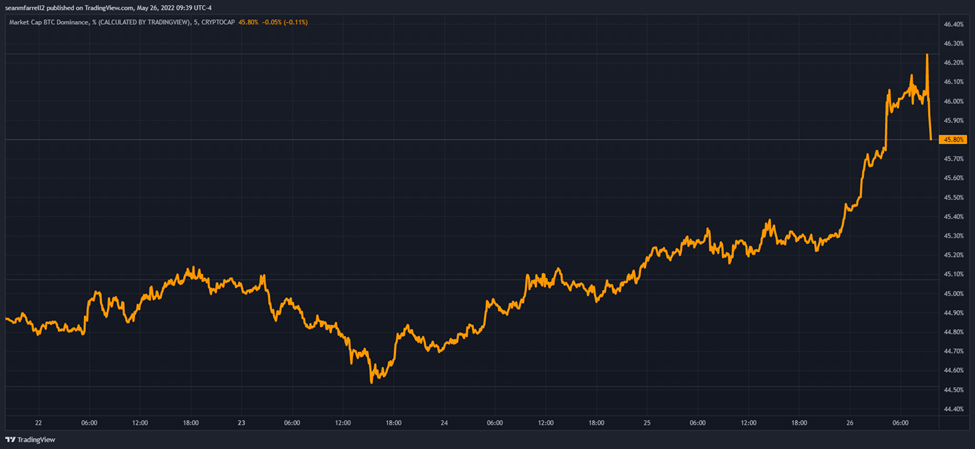
As we have been discussing, altcoins have not found much respite amid the market tumult either, as bitcoin dominance continues to show strength, surpassing 46% again this week. This is an effective demonstration of bitcoin’s safer risk profile relative to altcoins.
The Global Picture
If you follow our research regularly, you are well-versed in bitcoin’s risk profile among traditional macro assets and understand that bitcoin, despite being designed as a form of “macro insurance,” trades in lockstep with earnings-deprived tech stocks. Following the trend of QQQ 0.13% during US market hours will provide reliable direction on how bitcoin is trading on any given day. This is important to understand and appreciate because it presents a framework for how to trade this asset amidst tightening monetary conditions, however, bitcoin is a global asset that is traded 24/7 and therefore is unable to follow QQQ every hour of the day.
Thus, we considered it relevant to examine – how does bitcoin (and by extension, the rest of crypto) behave outside of US trading hours? Is this asset being sold more heavily in particular regions of the world?
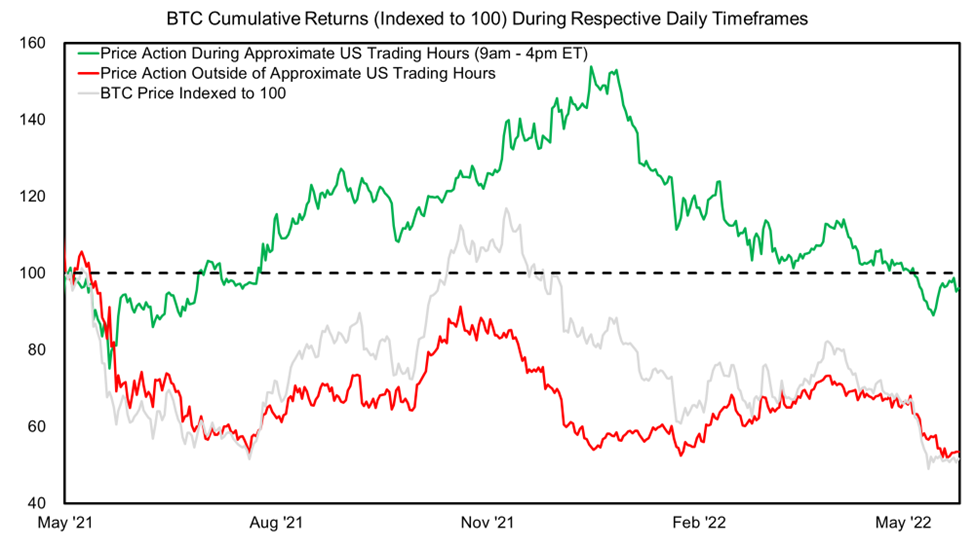
Below we map cumulative returns over the previous 12 months, indexed to 100. The green line represents BTC returns from 9am – 4pm ET, and the red line is BTC price action during the rest of the day. Following the complete leverage wipeout in May 2021, bitcoin showed relatively strong performance during US market hours while the rest of the world was hesitant to return to the playing field. Then a few months after the major drawdown, the entire globe was on the upswing again.
This is in stark contrast to the period following bitcoin’s all-time high in November through today, during which the US has experienced the strongest relative selling pressure.
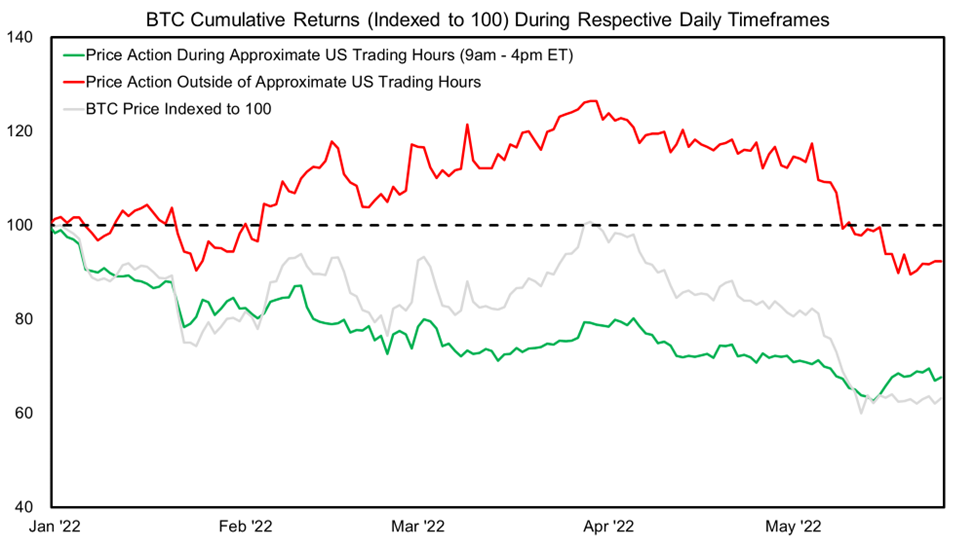
Here we zoom in on a YTD basis, and can see how, from a returns perspective, bitcoin has recently performed much better outside of normal US trading hours.
Despite this, price has generally followed the green line. This speaks to the relative adoption in the US and the outsized volume that bitcoin is subject to in the US as compared to elsewhere in the world.
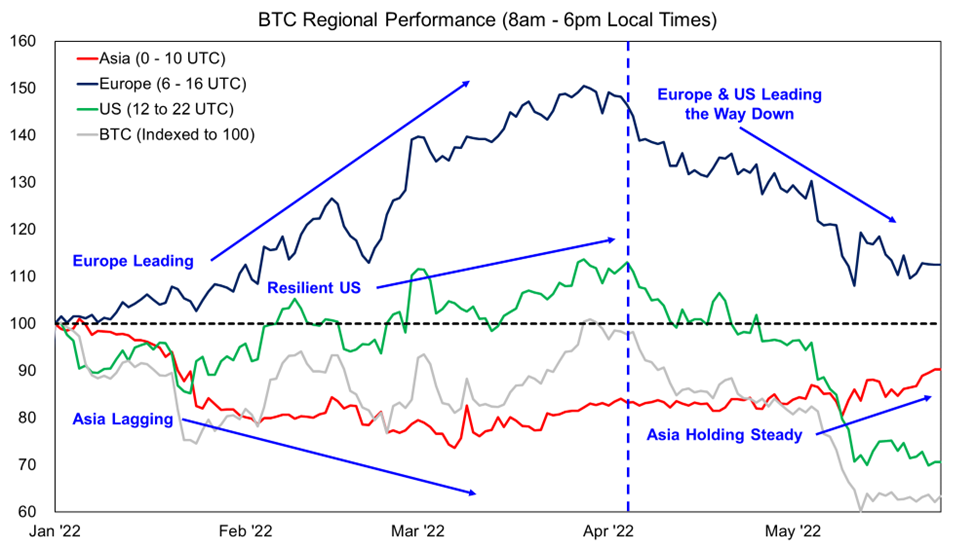
The charts above are helpful in discerning how the US market trades bitcoin relative to the rest of the world, but the world has several key markets. Thus, it is helpful to break the “rest-of-world” category down to further segment geographic price action.
Below, we map out the cumulative YTD returns based on three regional timeframes – the US (ET), Europe (CET), and Asia (CST). The returns are calculated based on price action from 8am – 6pm local time. Of course, this deviates slightly from the “market hours” methodology above, but we feel it provides a better feel for price action on a geographic basis.
The resulting chart suggests relative outperformance in early 2022 in European markets. This is consistent with the increased adoption of crypto surrounding the Russia-Ukraine war. During this time, the US was also performing somewhat robustly in the face of macro uncertainty. Asia was a clear laggard that saw the starkest decline in cumulative returns through March.
Beginning in early April, as the Fed started to accelerate its tough rhetoric surrounding inflation, we see that Europe and the US both took a massive nosedive. This bearish pattern was then exacerbated by the recent UST/LUNA chaos. Conversely, Asia has performed considerably well, trending upwards over the same period.
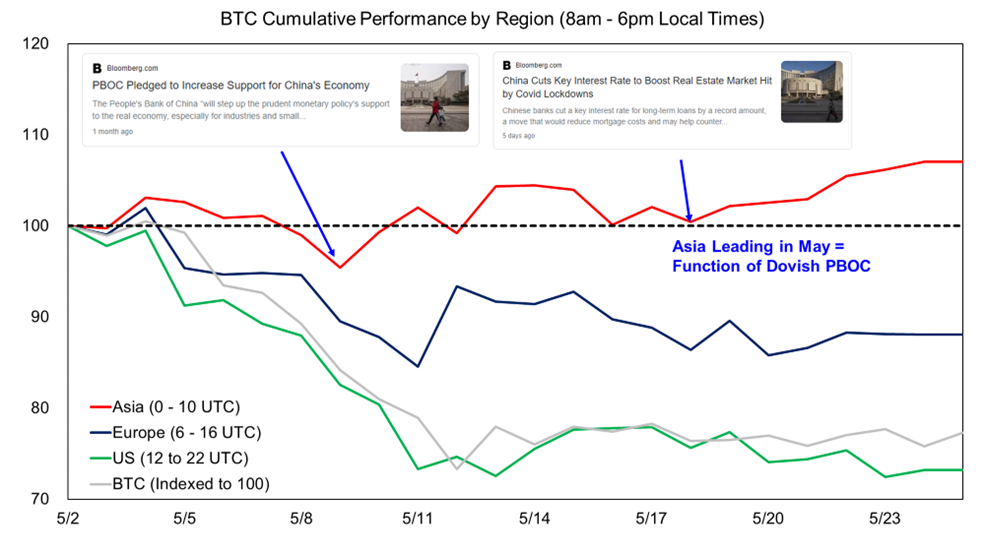
If we double-click on the recent outperformance in Asia, we can see that it all started around the time that the Chinese government started to become relatively accommodative from a monetary policy perspective. The country was already shrouded in fear of recession due to slowing economic growth and a real estate industry on the brink of collapse. These issues were compounded by the recent lockdowns enacted by a CCP that remains committed to a zero-COVID policy. It now appears that the CCP may be using these lockdowns as an excuse for enacting dovish policies. The most recent action taken by the government was to reduce the key lending rate in the real estate market to encourage home purchases.
The major takeaways here are as follows:
- Macro is driving everything in crypto right now. The US remains burdened by rising prices, rate hikes, and QT, which has led to compressions in valuations across all risk assets. Meanwhile, China appears to be shifting to more dovish policies, lending support to risk assets.
- Despite, three very different regional return profiles, bitcoin’s price generally follows the price action seen during US hours. As previously stated, this speaks to the outsized adoption in the US
- Once risk assets start to see some relief in the West, the East will be primed for a run-up, possibly leading to a globally consistent long trade on BTC.
Liquidity During Holidays
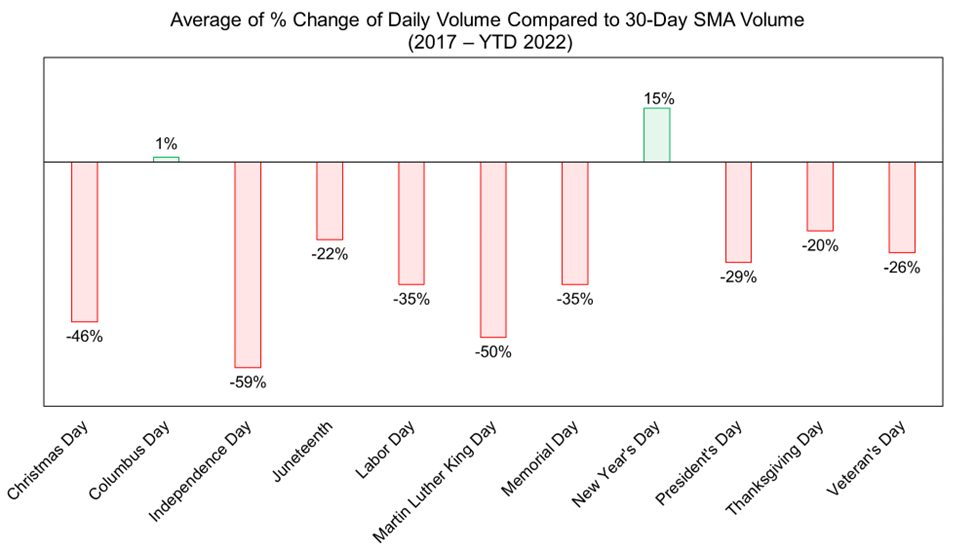
It is intuitive that volumes are lower, and spreads are wider during the weekends and on holidays. During these periods, a few large sales/bids could result in a sizeable movement in price. We thought it would be interesting to quantify how illiquid holidays are.
Below we calculated the average change in daily volume compared to the current 30-day moving average (for example, if the 30-day moving average is $100 million, and volume during the holiday is $50 million, the resulting bar will show -50%). The data includes both actual holidays and any days on which the holiday was observed by the US financial market.
The results are conclusive, volume during most holidays falls off a cliff, with a couple of exceptions.
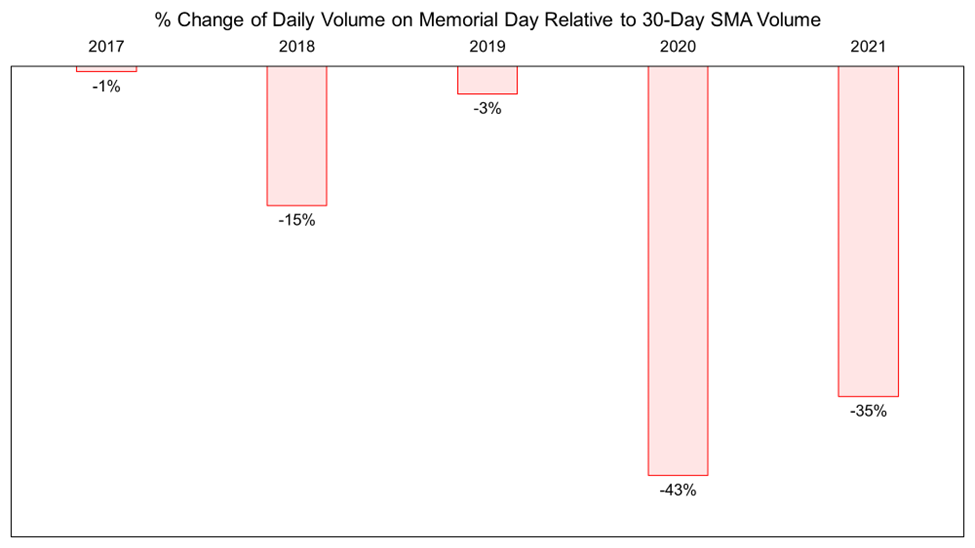
If we further break down the change in liquidity on Memorial Day over the past five years, we see that the last two years have been bereft of market activity. Memorial Day in 2020 and 2021 saw respective declines in the volume of 43% and 35%, which suggests that the market is normally sitting on their hands as the northern hemisphere kicks off summer. This dynamic has likely been augmented in recent years due to increased institutional volume. Much of this institutional volume is completely absent on these holidays.
The takeaway here is that liquidity is likely to be extremely low this weekend and during most holidays thereafter, which could result in outsized price swings.
Leverage Trending Higher
A metric that we have not revisited for a few months is the Bitcoin leverage ratio. This metric is the ratio of Futures Open Interest Contracts divided by the number of BTC on exchanges. When coupled with funding rate data, it helps to determine how much “liquidation cascade” risk there is embedded in the market.
Below, we can see that the leverage ratio has increased steadily since February and is currently at a 12-month high.
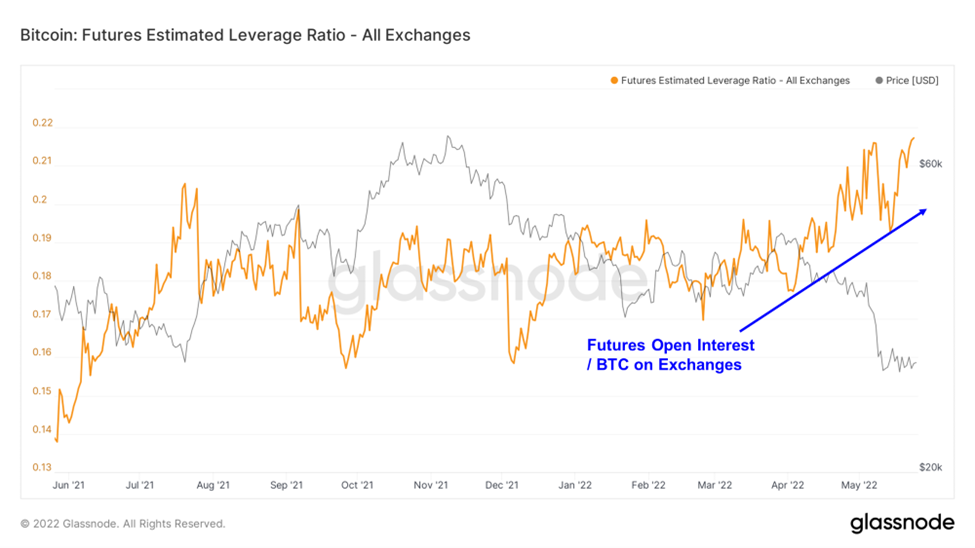
While exchange balances are structurally decreasing, it does appear that the recent boost in leverage has also been raised by a persistent increase in open interest. In fact, total futures open interest is currently at a 12-month high, when denominated in BTC. This means that there is a considerable amount of collateral posted for these futures contracts, and it is possible that price moving against popular market positions could cause serious liquidations in either direction.
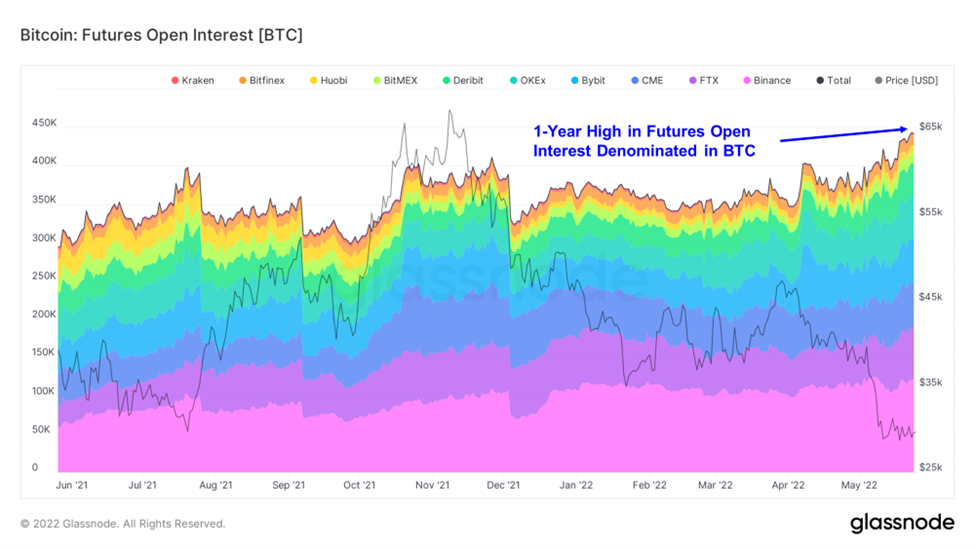
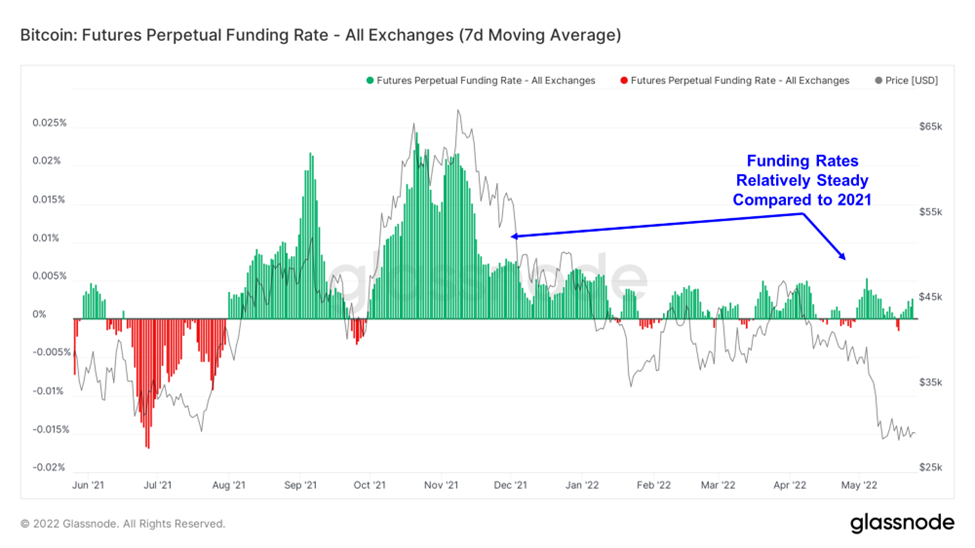
While this chart does not give a full picture of how the market is positioned, it does reflect a generally “balanced” market, with comparatively muted funding rates compared to most of 2021. It is likely that the elevated level of open interest is due mainly from hedging spot positions, as opposed to speculative trades on high-conviction directional bets. This provides us with some confidence that, at least in the immediate term, there is no apparent danger of cascading liquidations from overleveraged traders. That said, if the market were to move conclusively in either direction, it could catch a number of leveraged investors offsides and compound any uptick or drawdown in price.
Things Could Get Weird
Clearly not much has changed in terms of our immediate-term outlook on the market. However, we merely provide guidance around risk management and positioning for crypto portfolios, we do not control whether our clients actually click the “buy” or “sell” button on a daily basis.
With that in mind, we think it is useful to remind our clients of several important topics related to the current market setup:
- Liquidity is Low
- Volumes, and therefore, liquidity on both DEX’s and CEX’s has been extremely low.
- We are approaching summer, a period during which markets are generally less active, even during a bull market.
- This weekend is Memorial Day (see above).
- Leverage in the Bitcoin market is increasing. Coins are being removed from exchanges while the number of futures open interest contracts is increasing.
- Near-term macro-outlook remains unfavorable to risk assets. Quantitative Tightening starts on Wednesday, and the Fed has signaled it will raise rates another 50 bps the following week.
In summary, we think that the current setup, as characterized by (1) low liquidity, (2) increasing leverage, and (3) tightening monetary conditions, could lead to large price swings, and potentially further volatility to the downside in the immediate term.
Strategy Despite signs of seller exhaustion, our near-term outlook remains cautious. It is reasonable to expect downside volatility around continued rate increases and QT. We think opportunistically purchasing near-term put protection on long crypto positions and reducing exposure to more speculative altcoins are valuable measures to mitigate this risk. Despite this, we remain constructive on cryptoasset prices for 2022 and expect tides to shift in early 2H.