
Into the Ether
Key Takeaways
- After playing second fiddle to Bitcoin during the leading cryptoasset’s run at all-time highs in late October, ETH finally got its moment in the spotlight as it surged from below $4,000 last week to reach a new all-time high.
- Activity on the Ethereum network has increased dramatically in recent weeks as reflected in transaction count and fees paid, indicating increased demand for blockspace.
- Bullish supply dynamics are also supporting ETH price. The Ethereum network surpassed 750,000 ETH burned since the implementation of EIP 1559 and experienced its first week of net negative issuance.
- Based on observed P/S multiples, we can ascertain that the Ethereum network is reasonably priced relative to its historical trading multiples.
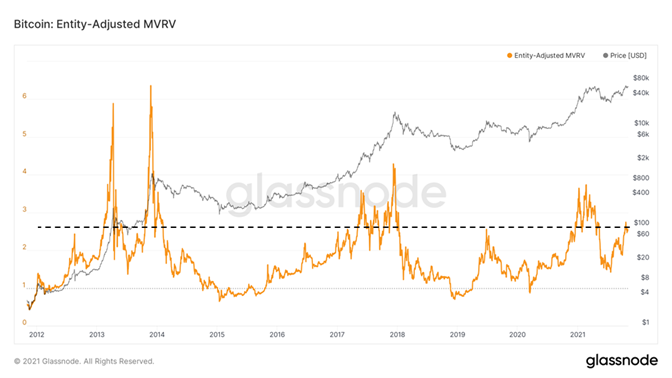
- Bitcoin continues to trade at MVRV and P/B multiples well below historical market tops and is priced inexpensively as compared to traditional equity markets.
- Bottom Line: Based on fundamental valuation metrics, both ETH and BTC remain conservatively priced, and we expect a continued push towards BTC and ETH’s respective price targets of $100,000 and $10,500 by year-end.
Ethereum Roundup
After playing second fiddle to Bitcoin during the leading cryptoasset’s run at all-time highs in late October (excuse me, Uptober), Ethereum finally got its moment in the spotlight. The leading smart contract platform surged from below $4,000 last week to reach a new all-time high of $4,449 on Friday, only to surpass that figure again on Wednesday, reaching $4,664.
This week we would like to dedicate more space to the Ethereum network and discuss some of the reasons that we think the second-largest cryptoasset still has plenty of room to run through the end of this year.
Demand Side Drivers
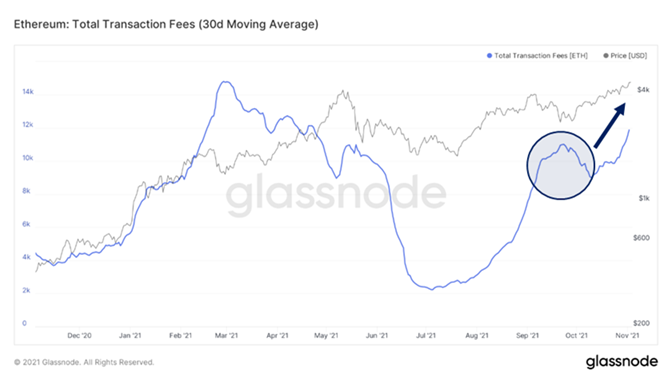
In September, we witnessed a lull in network activity when the market stumbled following a series of liquidations caused by FUD out of China and regulatory concerns in the United States. However, since early October, the 30-day moving average of fees paid on the network has climbed rapidly to reach a level last achieved in April 2021.
Meanwhile, transaction rate remained relatively flat until a couple of weeks ago, when transaction count began to increase dramatically, as decentralized exchange volumes started to pick up.
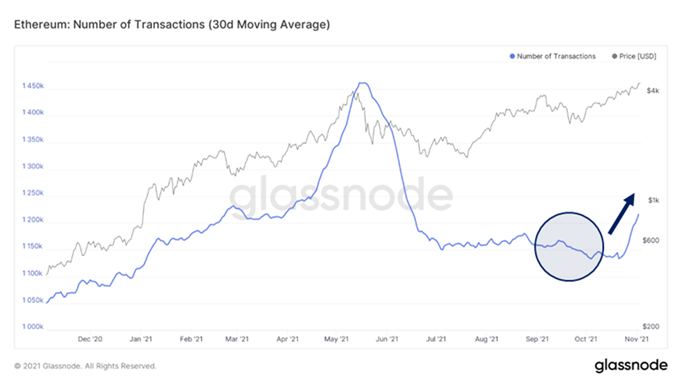
We think that the disconnect between fees paid on the Ethereum network and transaction count in late August through September (blue circles) is attributed to the emergence of NFTs and the minting process involved in their creation. When an NFT is launched, aspiring tokenholders rush to claim ownership over a limited number of NFTs available to the public. Since fees are a function of supply and demand, this results in higher fees while the number of transactions remains the same (a set of 10 NFTs will yield ten minting transactions regardless of fee levels). As the NFT craze partially subsides and volume moves to other layer 1 networks, we have witnessed more congruence between fees and transaction count.
Supply Dynamics
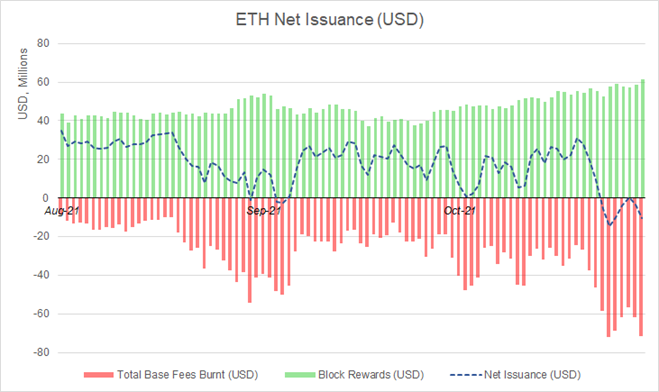
As we have highlighted in previous weekly notes, the implementation of EIP 1559 has instilled a predictable fee structure and a fee-burning mechanism from which the network reaps disinflationary supply benefits. Since EIP 1559’s launch in early August, over 750,000 ETH have been burned (nearly $3.5 billion at current prices). This is not too dissimilar from a company repurchasing its shares. However, there is no cash outlay from a treasury involved in this transaction – the ETH is simply “retired,” and the miner foregoes a portion of the base fee. Back in August, we cited this as one of the many overlooked reasons to be bullish on Ethereum and maintain that position today.
As seen in the chart below, net issuance has been dramatically reduced over the past few months, as the burned base fees have offset a significant portion of the newly issued block rewards. Last week we observed the network’s first week of negative net issuance, resulting in a deflationary supply dynamic.
We have also discussed the positive supply effects from the impending “merge” with ETH 2.0 and the network’s subsequent conversion to a proof-of-stake (PoS) blockchain network. To make the conversion process run smoothly, ETH holders can stake their holdings to the ETH 2.0 beacon chain and receive rewards for securing the network.
Presently, there is a lockup period for staked ETH, and the timeframe in which one can retrieve their staked ETH will be unknown until the PoS blockchain rolls out. Therefore, as staked ETH increases, liquid supply moves in the opposite direction, creating a “synthetic” deflationary effect.
We can see in the chart below that the amount of ETH staked (pink line) has increased steadily since the beacon chain launch a year ago and now accounts for over 6% of Ethereum’s total circulating supply.
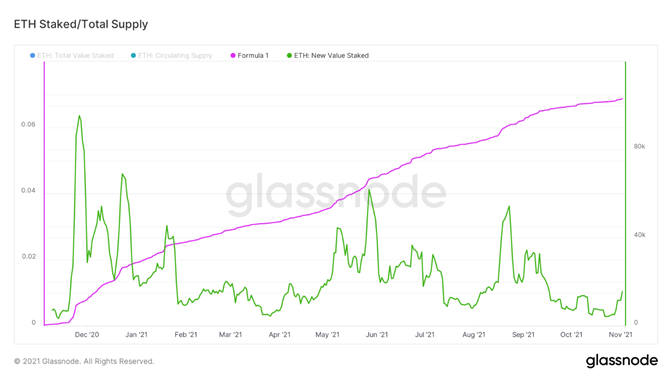
The green line signifies the 7-day moving average of the new value staked to ETH 2.0. This metric has ebbed and flowed over the past 12 months as expectations around the timing of the merge have fluctuated. As mentioned above, since assets are locked into the staking contract until the merge transpires, an ETH holder incurs an inherent illiquidity discount once they stake their ETH.
Uncertainty surrounding the timing of the merge is partially the reason the growth in ETH staked has slowed in recent months. However, we think that the average crypto investor underestimates how soon the merge will transpire or overlooks it as a catalyst altogether.
Once there is a more precise picture surrounding the transition, we expect a rush of new capital to stake ETH in search of yields north of 5% (in native units). This would lead to positive supply dynamics and, consequently, higher prices for ETH.
For the record, internally, we think the merge could take place in Q1/Q2 of next year.
Relative Valuation
Ethereum closed the month of October up over 40%, meaning that the benefits of increased network activity and bullish supply dynamics are being reflected in the price. However, when analyzing the metrics below, we feel comfortable saying that ETH is far from overbought.
Ethereum is a smart contract network whose major functionality is to facilitate the transfer of data between parties. To use the network, you pay operators (miners) fees to transact along the Ethereum rails. In many ways, this is similar to Web 2.0 payment networks which can be reliably valued with multiples of sales and profitability.
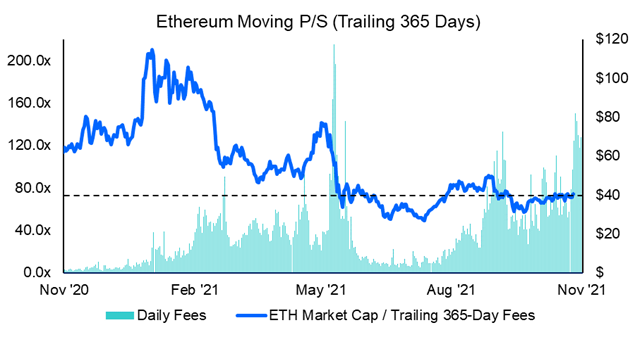
Below we can see that price as a multiple of Ethereum’s trailing 365-day fees (“sales”) has remained range-bound since the industry drawdown in May and has yet to rebound to the levels witnessed during the euphoric bull run in the winter and spring of 2021. We think that this is reflective of ETH simply pricing in network activity and disinflationary supply dynamics and that its current price does not reflect an overwhelming level of speculation.
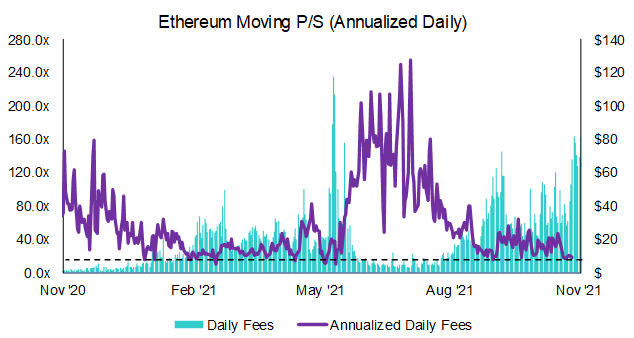
If we look at this from the perspective of annualized daily fees paid, we see a similar picture. The massive sentiment-driven drawdown in May slightly obscures the chart, but we can still ascertain the reasonableness of the current valuation of the network as a multiple of annualized daily fee revenue. In fact, Ethereum’s annualized fees currently imply a price-to-sales multiple of around 20x, a figure that rivals the revenue multiples of some web 2.0 fintech companies.
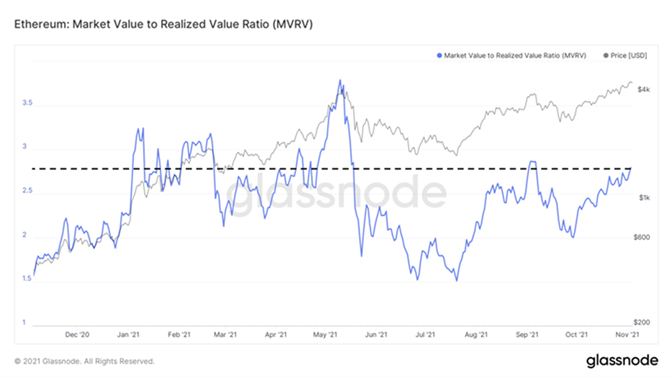
We can look at Ethereum’s Market-Value-to-Realized-Value (MVRV) ratio to gain a sense of on-chain profitability and potential selling pressure. Realized value, or “realized cap,” measures the value of the network based on the price at which each coin was last transacted. This metric can be more simply viewed as the network’s cost basis. MVRV is the Ethereum market cap over the total realized cap of ETH. Naturally, as MVRV increases, coins in profit are more likely to sell given their extended profit levels. The chart below indicates that despite the recent performance of ETH, the current MVRV ratio is much lower as compared to the ratio during the winter months when we were running hot. We think that there is more room to run for this metric before selling pressure outpaces buyer demand.
With the preceding metrics in mind, we can reasonably conclude that, should the macro picture remain intact (as we believe it will), Ethereum will reach our PT of $10,500 by year-end.
Bitcoin Update
To briefly update our clients on the relative valuation of the Bitcoin network, we revisit a couple of our favorite metrics below.
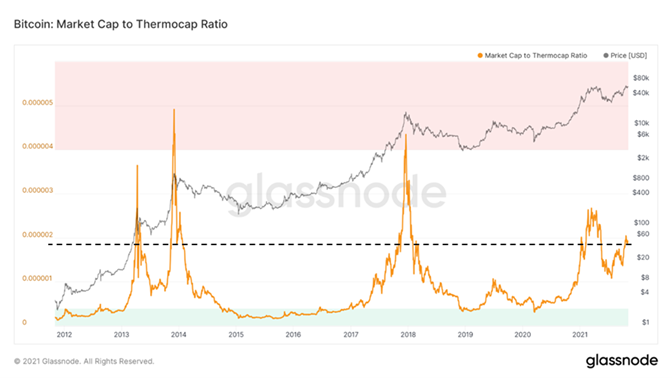
Market cap to Thermocap (MCTC) is used to measure the value of the Bitcoin network relative to the total cost invested by miners to secure the network. You can think of this metric as a multiple of book value for Bitcoin. The chart below demonstrates that this multiple has climbed higher since BTC’s trough in July and currently sits at a similar level last seen in April.
To reiterate our stance from the prior few weeks, we think that based on Bitcoin’s price history relative to miner spend, this multiple can still experience significant expansion before we become cautionary.
Similarly, the profitability of BTC holders as represented by MVRV (defined in our ETH commentary) still has some room to run before we experience unsustainable selling pressure from profitable holders.
Finally, we would like to leverage research compiled by our macro team and add a crypto twist. Below is an analysis of S&P 500 sectors and their relative valuations compared to the mean price-to-book ratio over the preceding five years. Obviously, the greater the number of standard deviations above the average P/B ratio, the more “over-valued” the sector is.
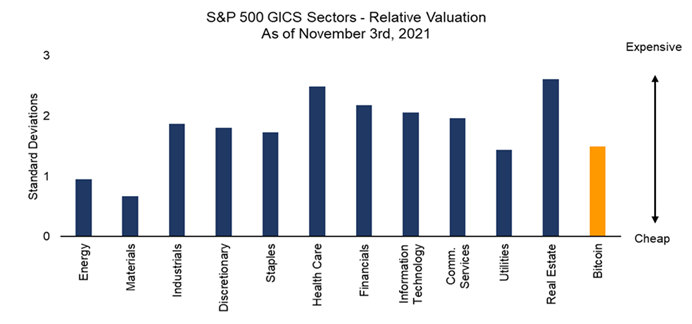
It should come as no surprise that the entire S&P 500 is overvalued based on 5-year pricing data. With the brief exception of a few weeks in March 2020, equity markets have marched steadily up and to the right since the GFC in 2008.
However, the loudest voices on TV and social media screaming “bubble” normally target crypto and, specifically, Bitcoin. Based on the chart above, Bitcoin trails most S&P 500 sectors in terms of deviation from its mean P/B, thus furthering our view that Bitcoin is currently conservatively priced.
The leading cryptoasset still maintains a path to our $100,000 PT by year-end on the back of sustained macro tailwinds and underlying bullish on-chain fundamentals.