BTC collapses but holds 200-week sma, ETH vs BTC holds .22

Heavy technical damage but a few silver linings
Last week’s collapse in cryptocurrencies has left most chart patterns badly compromised with BTC breaking below its 2015-2020 uptrend. However, despite the technical damage that is now in place there are some silver linings developing notably that BTC has held and rallied from its 200-week sma, ETH has recaptured its Q4 2019 lows and ETH vs BTC has held key support at .22.
BTC
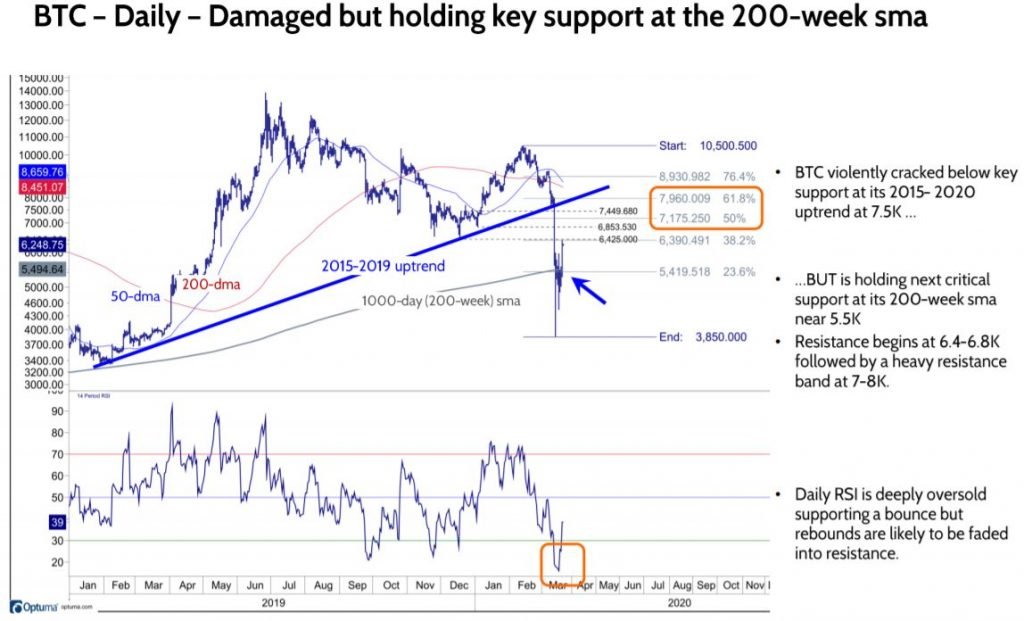
At the risk of stating the obvious, the crypto break down over the past week mirrored the ‘get me out of everything’ panic that dominated all asset classes whether they were defensive (bonds and gold) or not (equities). Lower highs and lower lows are in place for BTC leaving in a compromised, potentially vulnerable longer-term profile. However, while BTC has broken a 4-year linear uptrend it has stabilized, and bounced, from support at its 200-week sma. We have found the 200-week sma to be an important long-term structural support level for most asset classes and was the case for BTC in 2015 and again in 2018. In addition,Fundstrat’s Digital Asset Strategist, David Grider, noted earlier this week, prior to today’s rally, that at 5.5K (BTC’s 200-week sma) BTC represented an attractive valuation. Bitcoin is trading around a 5.5x Market Cap / Cumulative Mining Revenue ratio. It has not been this cheap on a relative fundamental basis, since it last bottomed out in December 2019 at $3,400 and before that, in December 2016 at $700 leading into the last bull market
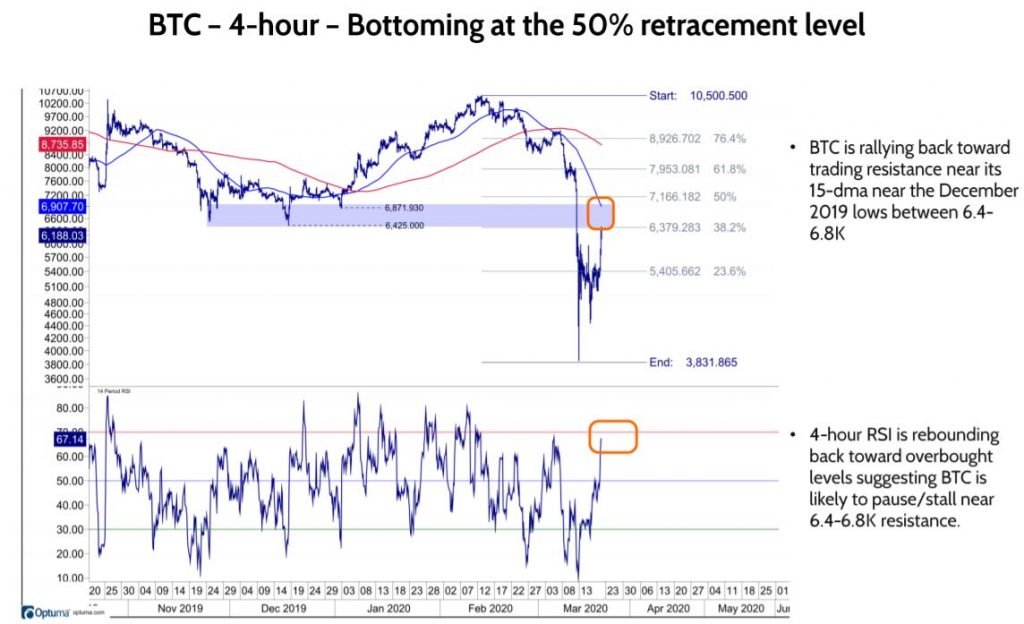
So, for now, technically we will again give BTC the benefit of the doubt that it is attempting to bottom but recognize BTC will likely need months of consolidation to repair the technical damage now in place. In addition, despite our longer-term positive disposition toward BTC, a break back below 5.5K would be concern despite the recent capitulation lows being at 3.8K. On the positive side, daily momentum is suitably oversold to expect BTC to attempt further upside recognizing today’s surge has already pushed BTC toward trading resistance between 6.4-6.8K just below its declining 15-dma at 6.9K.
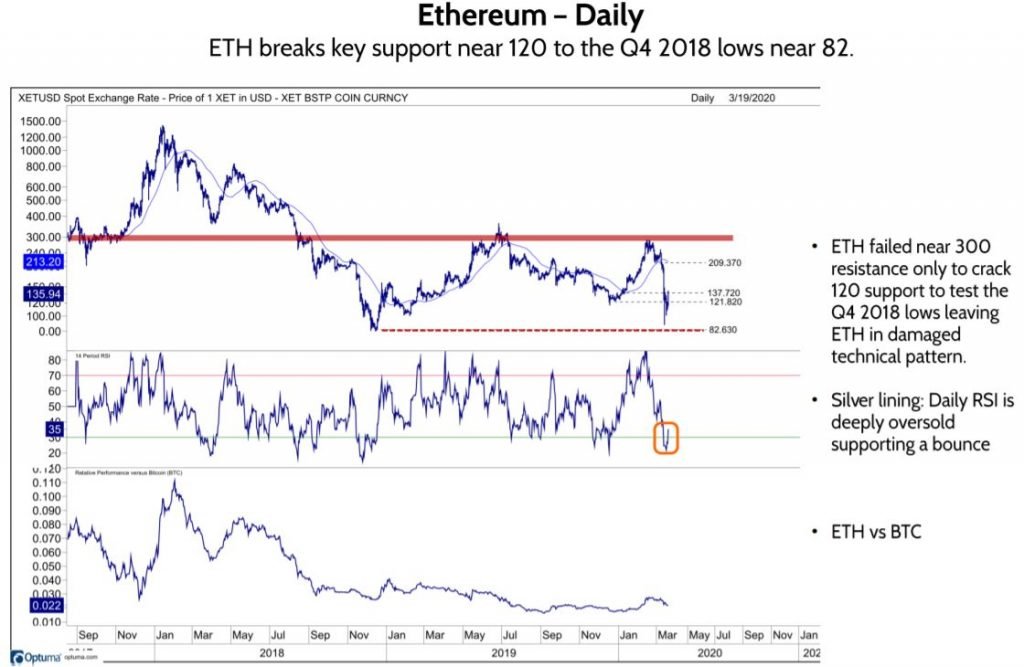
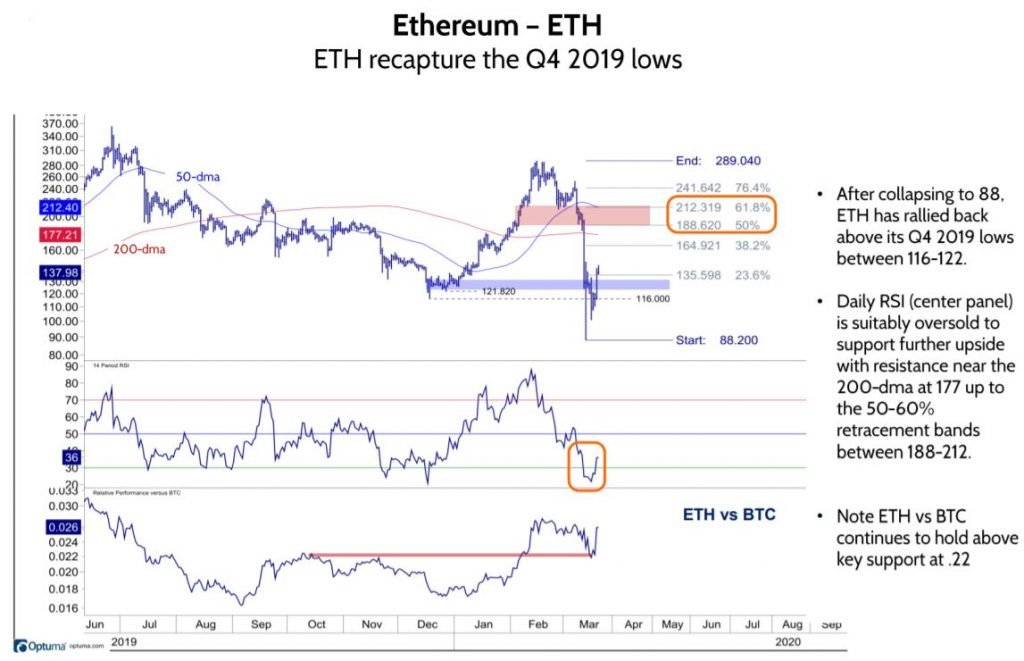
ETH – Similar to BTC, damaged but also recapturing a key level at its Q4 2019 lows near 116
ETH’s failed under heavy resistance near 300 only to retrace almost all of the 2018-2020 range. Despite the damaged technical profile, ETH has snapped back above a key level defined by its Q4 lows. Daily RSI is suitably oversold to support further upside with resistance near the 200-dma at 177 up to the 50-60% retracements near 188-212
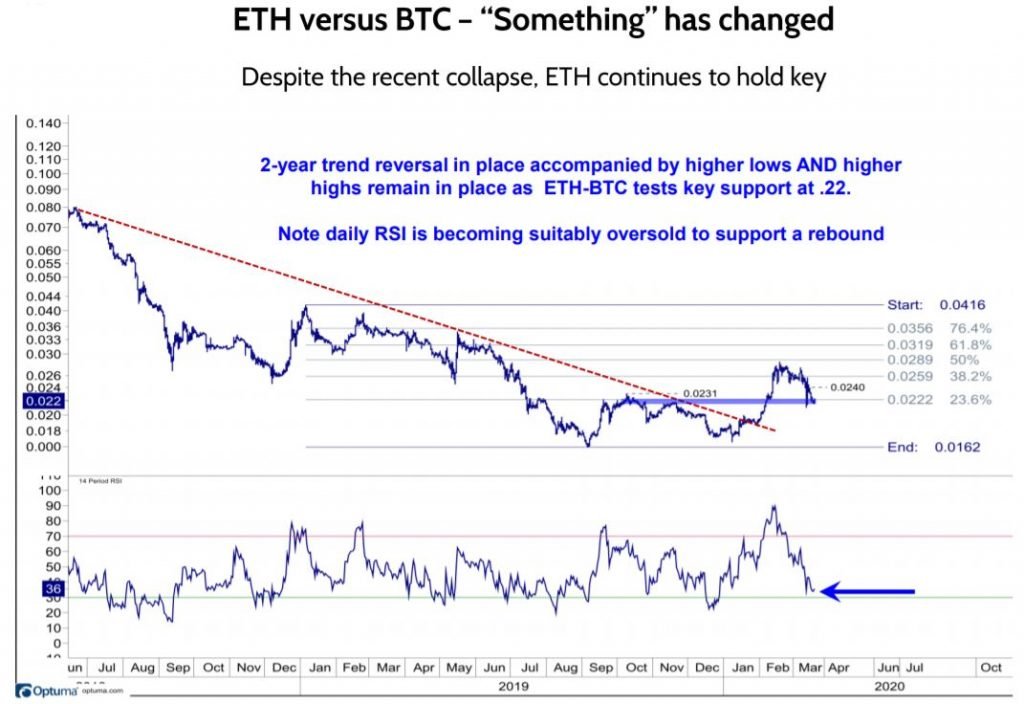
ETH-BTC
Despite all the technical destruction across most asset classes, ETH vs BTC has held important support near .22 and is showing evidence of bottoming
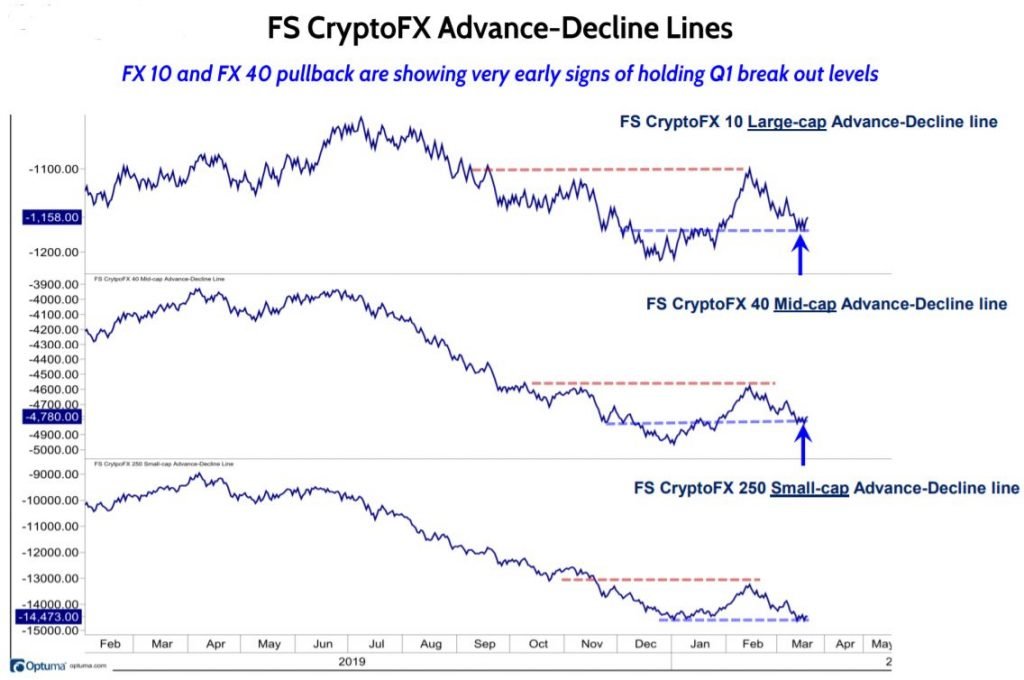
Fundstrat FS CryptoFX index highlights
Although the price profiles of the FS CryptoFX10, 40 and 250 collapsed over the past week the Advance-Decline lines for the FX10 large-cap and FX40 mid-cap are showing signs of bottoming above a key technical level defined by their Q1 break-out levels.