

Trend bullish – Expect rally up to SPX 4550 into July expiration. A lower than expected CPI print could help SPX surpass 4458 which would help jumpstart this move.
Overall, a “Broadening out” has been the telltale catch phrase for US equities since mid-May.
What had formerly looked like just a Technology rally has given way to relative strength in many other sectors like Industrials, Discretionary and Communication Services.
However, just in the last two weeks, there’s been evidence of Transportation stocks, and Financials starting to play Catch-up which has now been followed by a breakout in Energy. Even Small-caps and Mid-caps have been strengthening on an absolute basis and relative to Large-Caps.
Despite Technology stalling out a bit in recent weeks, there’s been no technical confirmation of Technology peaking out. Meanwhile, a plethora of other sectors have come to the rescue to help the US Equity rally broaden out.
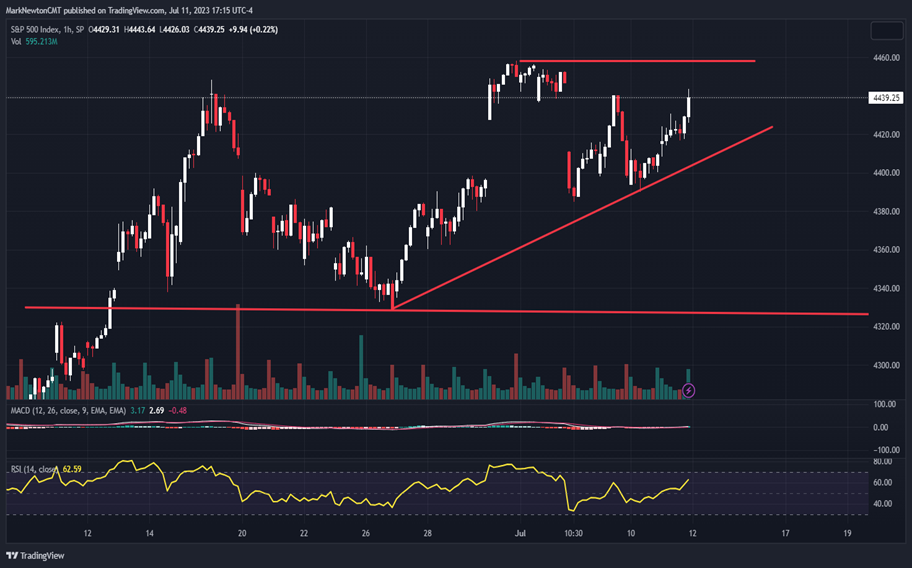
Ahead of Wednesday’s (7/12) important CPI print, SPX has begun to turn back higher and finished Tuesday within a point of last Friday’s intra-day peaks.
It’s thought that a move back to new July highs is underway, but truly needs a move above 4460 for confirmation. This would pave the way for a clean path to 4500+ with no interruptions. Meanwhile, 4389 is key as support and can’t be broken without arguing for an initial test of 4360 down to 4340 before SPX bottoms and turns back higher.
Overall, it’s right to be bullish, and to expect that any lower than expected core CPI print likely results in yields rolling over, and might also affect Equities positively.
Given the strengthening in Energy and Financials lately, I’m willing to bet that SPX likely pushes up to challenge the 4458 level sooner rather than later. Therefore, it’s still proper to be bullish, and consider any near-term pullback post CPI to make SPX and QQQ more attractive.
As discussed, I do not think that QQQ, nor SPX has peaked, and expect SPX gains ground back to new monthly highs as well. Thus, a bullish stance, looking to buy dips and also add to longs above 4458 makes sense for those with shorter-term time horizons.
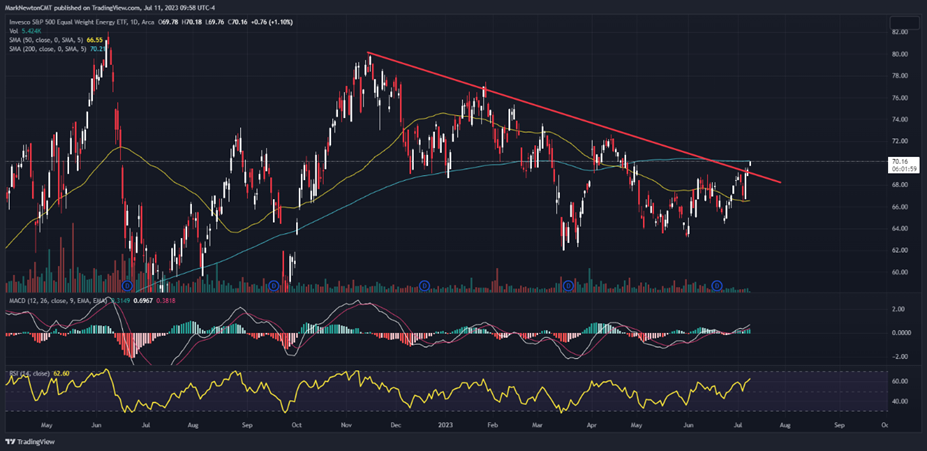
Equal-weighted Energy breaking out of downtrend
Energy has finally broken out, and it’s taken a big decline in the US Dollar to finally jumpstart the move in WTI Crude.
Oil Services have proven to the be the strongest area within Energy since early June. This has been followed by a visible breakout in Integrated names this week which has led Equal-weighted Energy ETF by Invesco (RYE) to exceed the entire downtrend from last Fall.
Overall, Oil Services still looks the strongest technically over the next 1-2 weeks (OIH -0.10% ) , but then should be followed by more strength out of Exploration and Production stocks (XOP -0.22% ) which would be a second place choice technically. The defensive XLE 0.32% is least preferred at this time, but should gain appeal when SPX gets back over 4500 as a way to play Energy.
Bottom line, this move has been anticipated to start happening potentially from August lows based on cyclical projections. However, this push higher in mid-July looks bullish and means that the rally likely has begun a full month early.
A natural progression of this week’s breakout would be to show acceleration into late July before a pullback (along with the broader market perhaps) into mid-August before yet another rally attempt higher.
Overall, this week’s gains in Energy make this sector a lot more bullish technically, and the technicals look to be lining up with Tom Lee’s bullish Energy call at a very opportune time.
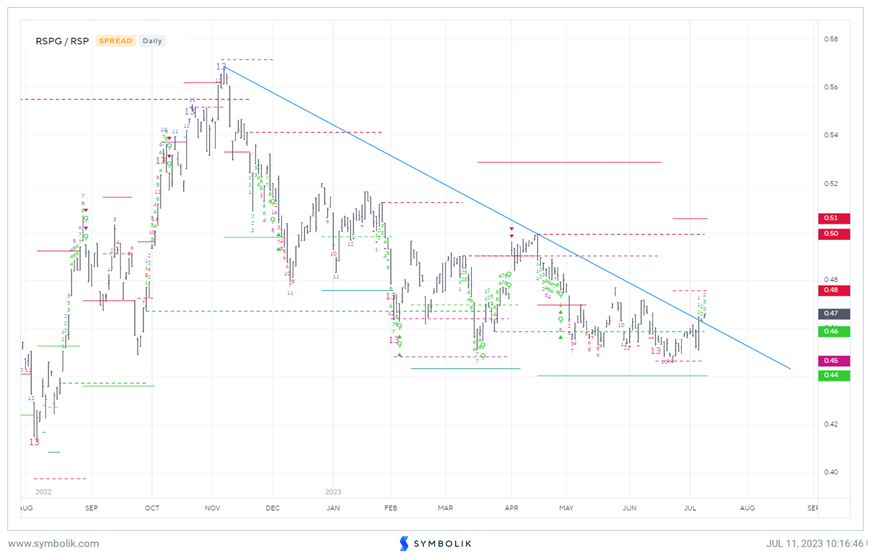
Energy also breaking out vs. S&P 500 on Equal-weighted basis
While Energy breaking out on an absolute basis is certainly important, daily charts show Equal-weighted Energy also breaking out in relative terms vs Equal-weighted S&P 500 for the first time since last November.
This looks to be a constructive sign suggesting that Energy can work better in the 2nd half of 2023. While I’m fond of multi-month trend breakouts in absolute terms, it’s the relative breakouts vs. S&P 500 that typically help to jump-start meaningful relative strength and outperformance in this sector.
This has been largely lacking until this week, and Tuesday’s gains in particular (7/11/23) look quite positive.
Symbolik charts with DeMark indicators show confirmed TD Sequential buy signals (13 Countdowns) happening back in February of this year along with mid-June which both were successful in driving good relative performance in Energy.
I suspect that this trendline breakout indicates that a period of mean reversion higher (and catch-up) could be in store for Energy. Thus, while Technology does not yet look to be peaking out, sectors like Energy, and also Financials, are starting to strengthen in a fashion that helps to add confidence to this market rally.
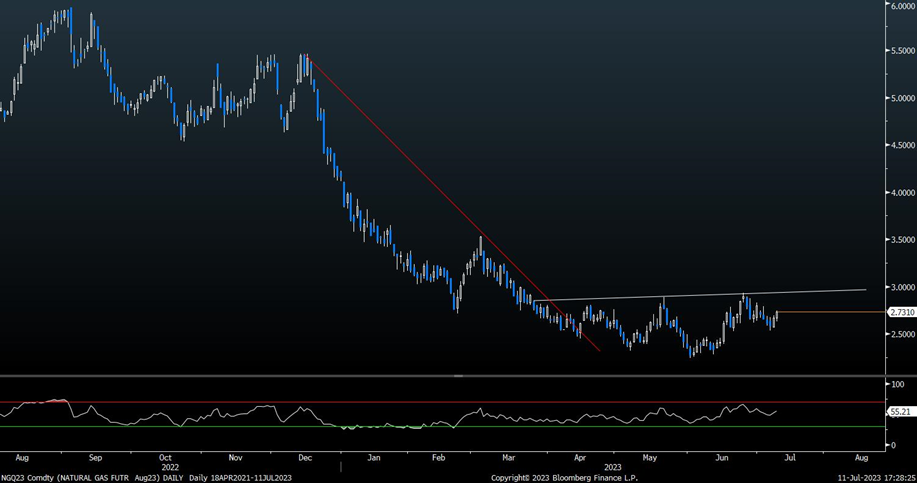
Natural Gas basing since April but looks quite positive
Gains in Natural Gas have proven to be choppy and largely unrewarding over the last few months, but this could be changing given the construction of this bullish base.
Daily charts of Henry Hub Natural Gas (front month contract) look to be forming a reverse Head and Shoulders pattern, which would be confirmed on a daily close back above late June highs at $2.9360. This week’s gains have already signaled a good likelihood of strength back to test $2.9360, but it’s the act of actually exceeding these former highs from last month which will help to jump-start a more meaningful rally.
Any daily close above $2.9360 in front month futures would allow for a rally up to $3.50 initially, but $3.86-$4.25 looks to be an attractive area of resistance for August/September on gains.
Given the extent of this decline since mid-2022, it will take some time before gaining confidence of an intermediate-term rally in Natural Gas (NG -0.47% _F) back to highs. At present, this appears like a tactical rally only, and might last only until Fall 2023 before succumbing to seasonal weakness.
At present, UNG -0.07% looks like an attractive way to playing a rally, or stocks that correlate well with NG_F.