
Trend bullish – Expect rally up to SPX 4325 before possible minor stallout. Pullbacks should be buyable when they occur for additional strength in June.
A late day rally let QQQ 1.15% regain most of Wednesday’s weakness, while SPX and DJIA pushed back to new highs for this week. DJIA in particular, has begun to look far more positive in the last couple weeks, and now lies just 2% off former Fall peaks from 2022.
Large-caps showed more strength Thursday than Small-caps, and S&P Sector SPDR ETF’s like XLK 1.35% and XLY 1.53% both closed up more than 1% on the session.
While the VIX is getting stretched to the downside, and short-term ratios of Equity Put/call have plummeted to near levels which argue for minor pullback, price action has not suggested such a move is upon us.
Overall, a rally in SPX back up to 4325 and QQQ to 360-1 looks likely before any stalling out, no matter how minor.
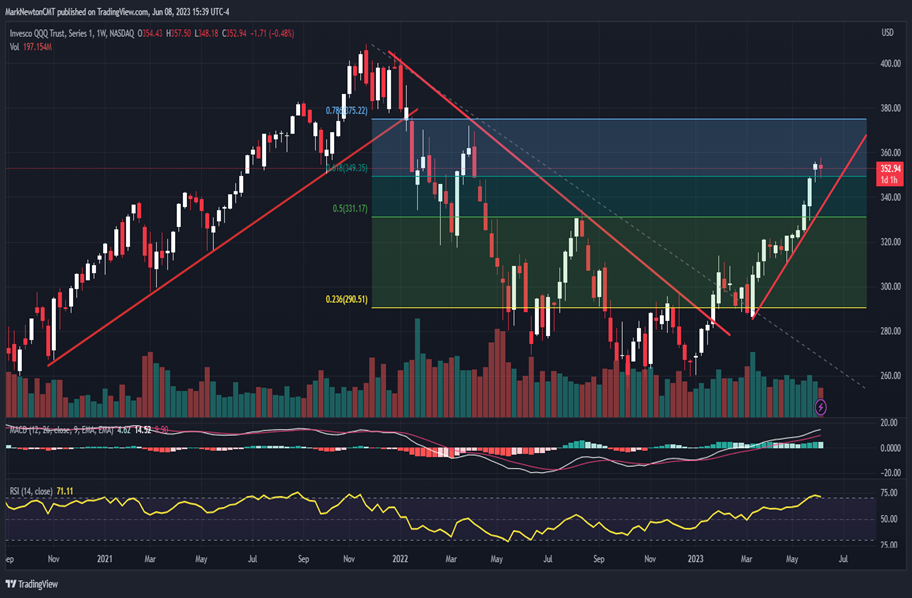
As weekly QQQ charts show below, price has now eclipsed the 61.8% Fibonacci retracement level of the prior decline. Given that no evidence of upside exhaustion has been confirmed using TD Sequential or TD Combo on daily nor weekly charts (and appears to be roughly four weeks away on a weekly basis), it’s likely that pullbacks prove short-lived ahead of further strength back up to 365 and potentially 374-6 into late June/early July.
Weekly RSI has become overbought. Yet as technical analysis teaches us, it’s not the act of reaching overbought territory that coincides with markets peaking out. Normally, it’s the act of waning from overbought levels that can bring about a selloff. Overall, trends and momentum are bullish, and it’s right to be long, with any dips making prices more attractive.
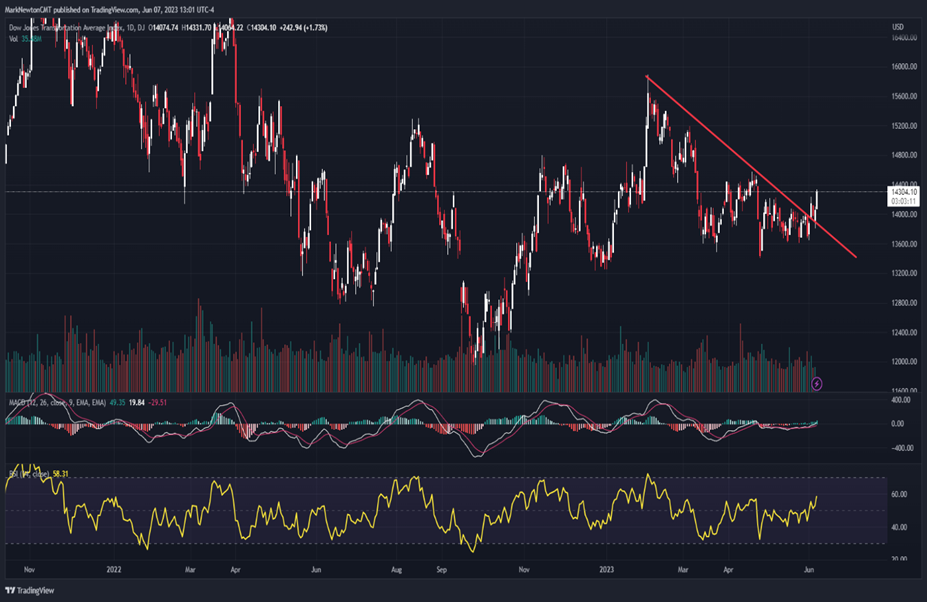
Transports are now breaking out, and helping Industrials
The DJ Transportation Average has now joined some of the other sub-groups in breaking out, as seen below. The act of exceeding this ongoing downtrend from February peaks looks positive, and should help Transportation issues lift into late June.
Given that other leading sectors like Semiconductors and Homebuilders have proven extraordinarily strong, it’s encouraging to see Transports finally begin to join suit to in trending higher.
Airlines have proven to be one of the top parts of Transportation over the last month, with stocks like DAL 2.33% , ALK 0.87% , UAL 3.19% , AAL 2.12% , and JBLU 1.22% all having rallied more than 5% in the last month. DAL and ALK in particular have been higher by more than 10%.
Laggards within Transportation include JBHS, FDX 0.85% , UPS 1.16% , EXPD 0.04% , which have been down on the month. Yet, it’s expected that these also might rally over the next month. As the saying goes, “A rising tide carries all ships”.
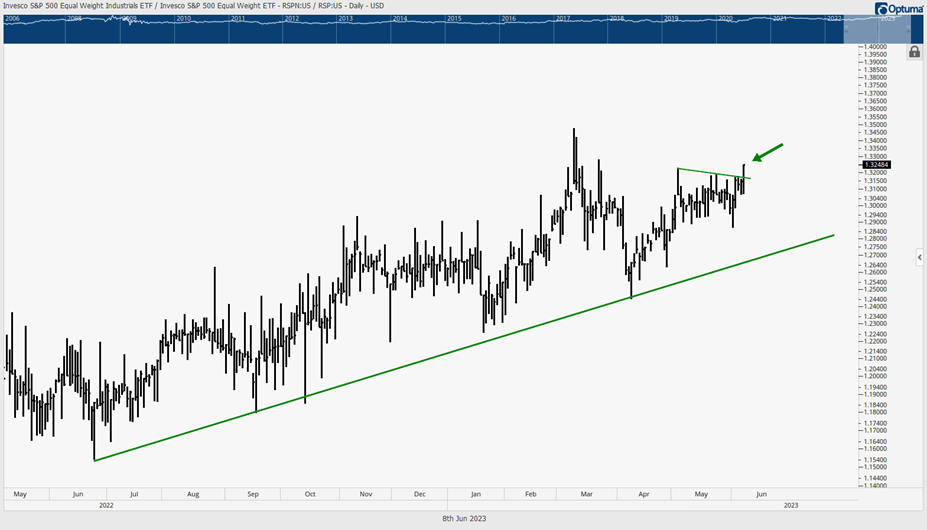
Industrials have also broken out relative to Equal-weighted SPX
As might be expected, seeing above-average strength in the Transportation group has helped the Industrials sector to rally sharply over the last week.
Equal-weighted Industrials vs. Equal-weighted SPX in ratio form has pushed to the highest levels in months heading into the final day of this week.
This is a technical positive for the Industrials, and key Industrials names like BA 0.73% (Boeing) have just successfully rallied above recent consolidation highs, which should help this gain further ground.
Overall, I had included Industrials as one of four sectors to overweight for 2023, with the others being Technology, Energy and Healthcare. Nothing has changed in this view, but this week’s progress makes me confident that Industrials can show some further outperformance vs. SPX in the month of June.
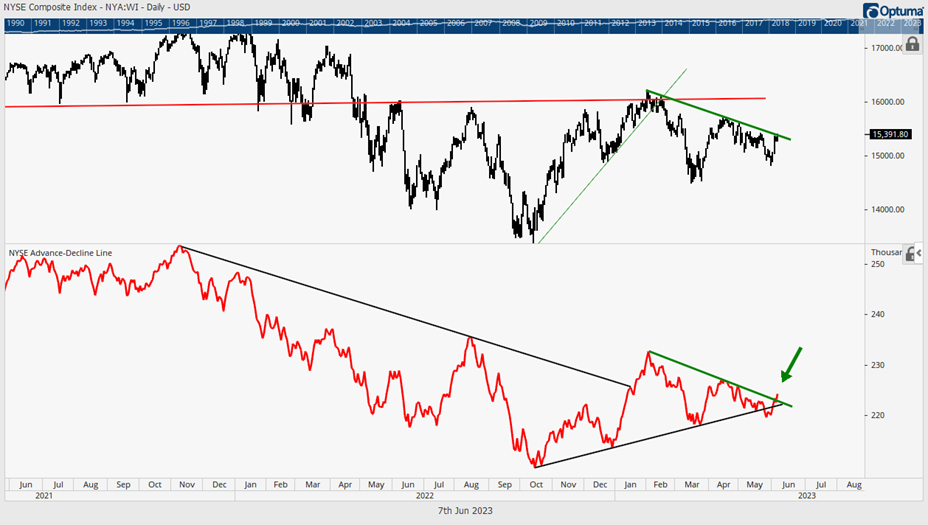
NYSE Advance/Decline line has also just broken out
Below is the chart of the NYSE Composite along with the NYSE Advance/Decline line (shown below the NYSE Comp).
As seen in the lower part of this chart, the Advance/Decline (A/D) has just exceeded the existing downtrend, which has been intact for A/D since February.
Overall, while I’ve commented on the recent improvements in breadth in recent weeks, this breakout in A/D looks quite positive towards thinking the market is kicking into gear.
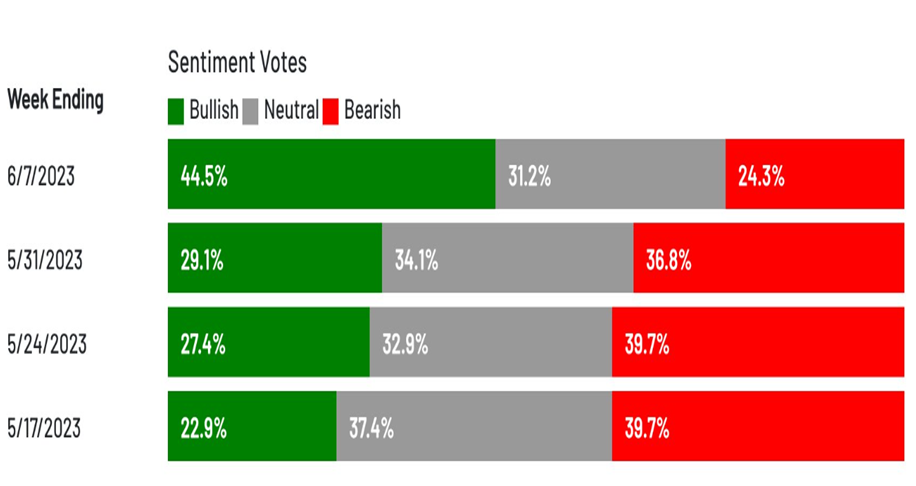
AAII has finally flipped to bullish
Interestingly enough, this latest surge in market breadth over the last few weeks following the SPX breakout above May levels has finally caused the percentage of Bulls to outweigh the percentage of Bears.
This Bull/Bear spread has been negative for months, so it’s insightful to see that the Retail investor is finally starting to turn more positive.
Overall, this can serve as a contrarian indicator at extremes, which specifically concerning this indicator, normally happens with a greater than 30 point spread between Bulls and Bears.
At present, I tend to view this flip as being not too concerning, specifically given the CFTC S&P positioning by Speculators (net-non-commercial positioning), which remains negative for SPX.
However, the fact that bullish sentiment has increased in AAII combined with CNN’s Fear and Greed index, Investors Intelligence, along with a low Equity put/call ratio means that sentiment will have to be watched carefully in the weeks ahead for evidence of exuberance returning to the market.
Bullish sentiment coinciding with DeMark-based exhaustion lining up along with cycles peaking in late June could bring about a temporary peak in stocks. For now, this still looks early.