Key Takeaways
- SPX and QQQ both broke down to close out the quarter near lows of the day. Trends look to be slowly changing from Up, to Down but not confirmed.
- Q1 Performance favored Defensive themes and still looks to be the case into Q2.
- WTI Crude oil’s decline on Output hike plans doesn’t appear serious technically and should provide technical buying opportunities in the days/weeks ahead.
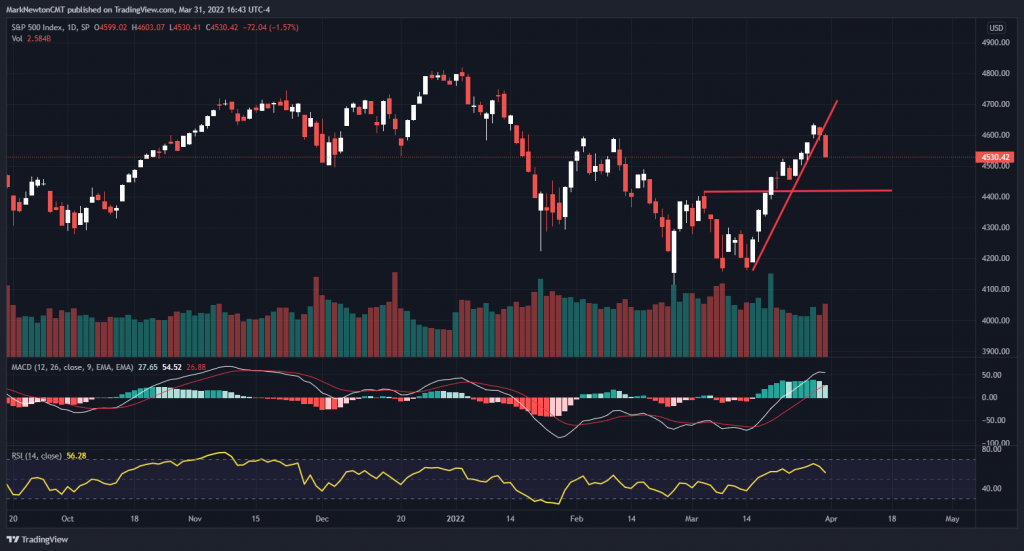
US indices closed out the month and Quarter on a dour note, dropping over 1% to finish at multi-day lows. Thursday’s decline looks to be catalyst that likely turns down momentum enough that short-term trends will begin a more lengthy consolidation. However, heading into a new month and quarter, one cannot rule out new month inflows, which I suspect should prove short-lived. Bottom line, SPX did manage to break the uptrend line from late February as Financials, Discretionary, REITS, Communication Svcs, Industrials, Energy and Technology all fell greater than 1%. Key for pullbacks will be 4400 and until this is breached, one can’t make too much of the structure as being bearish given the recent progress. Yet, anything under 4400 calls for new lows and would kick off an above-average period of volatility, which directly lines up with the cycle composite created by Gann’s Mass Pressure Index. Overall, defensive strategies remain preferred, with Utilities and REITS being areas to favor, vs. expecting Technology is bottoming.
Key Takeaways as Q1 has come to a close
Momentum did improve on a short-term basis along with Breadth in late March. However, weekly and monthly MACD remain negatively sloped, making it difficult to trust this bounce.
Technology has not nearly rallied enough to expect the worst is over. Relative charts of Tech vs SPX remain under multi-year uptrend line support and until this is recouped, Technology is thought to continue to be volatile and could be a Second Quarter (2Q) laggard.
Energy, Utilities, REITS, Materials and Healthcare are groups to favor into Q2, while awaiting evidence of Technology to show more strength which could improve its technical profile.
Commodities still look strong and insufficient weakness is present to avoid this group heading into Q2. Crude oil’s weakness should prove temporary along with Precious Metals and agricultural commodities are likely to trend up into May before any peak. Given the relative strength in Equal-weighted Commodities vs SPX, pullbacks in commodities should be buyable and the larger uptrend remains intact.
Overall, Energy and Utilities were the only positive sectors for the 1st Quarter (Q1), performance-wise and both groups returned over 8% in the month of March. (SPDR S&P ETF performance as a gauge) Technology finished lower by more than 7.5%, representing the third worst S&P SPDR ETF over the last three months. Tech looks buyable into late June.
Cycles remain negatively sloped into late June for US Equities and given how accurate the Mass Pressure Index has been over the last few years, one still has to give the cycle composite credit for being bearish in Q2, until proven otherwise. It correctly suggested March should be positive.
Financials should begin to underperform, if my expectation on falling rates in Q2 materializes, but as discussed before, longs within Regional Banks and Insurance still likely could bear fruit in the weeks/months to come and could relatively outperform.
Cryptocurrencies have to be watched carefully for any evidence of following Equities lower given recent positive correlation trends. While many Alt-coins have jumped 20-30% off the lows, there’s been some evidence of stalling out in recent days, not dissimilar from US Equities. Overall, while long-term trends in Cryptocurrencies remain quite bullish, I’m expecting a possible rough patch in April before prices can turn higher with more momentum.
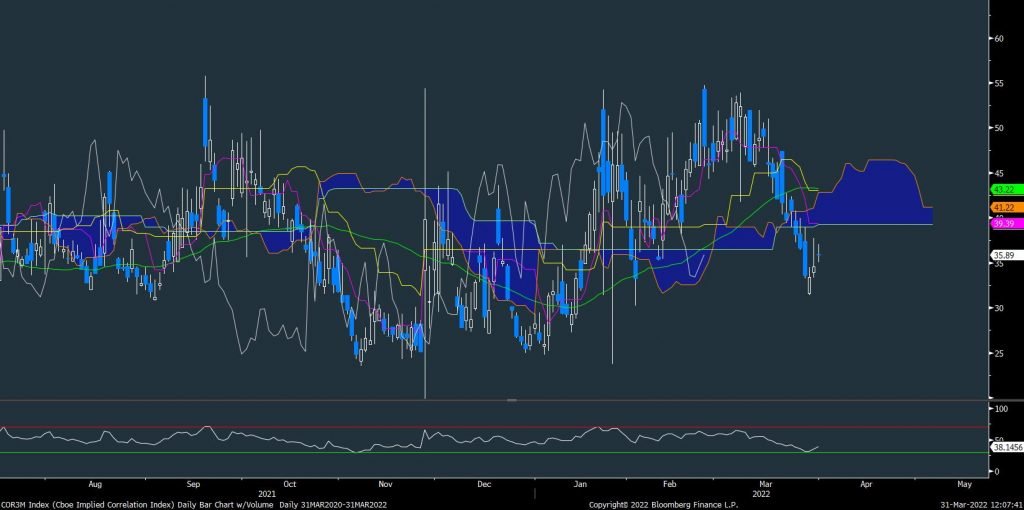
Implied correlations have dropped to 35%, which provides excellent opportunities for Stock-picking. This has steadily fallen from the mid-50s in recent weeks.
Sentiment has quickly improved given the sharp bounce US equities have demonstrated since March 14. AAII data shows bearish sentiment having dropped 22 percentage points in two weeks, the largest decline in over a decade. That’s not a comforting fact for the Bulls but lines up with the low levels of Equity Put/call ratio which materialized into end of Quarter.
As the sector performance chart shows below, we’ve seen huge sector dispersion, with Energy having rallied nearly 40% in the first few months, but only Energy and Utilities were positive. The month of March brought outperformance by Energy, Utilities and REITS as the top 3 performing groups, and these still look to provide above-average relative strength in April.
WTI Crude decline likely to prove temporary
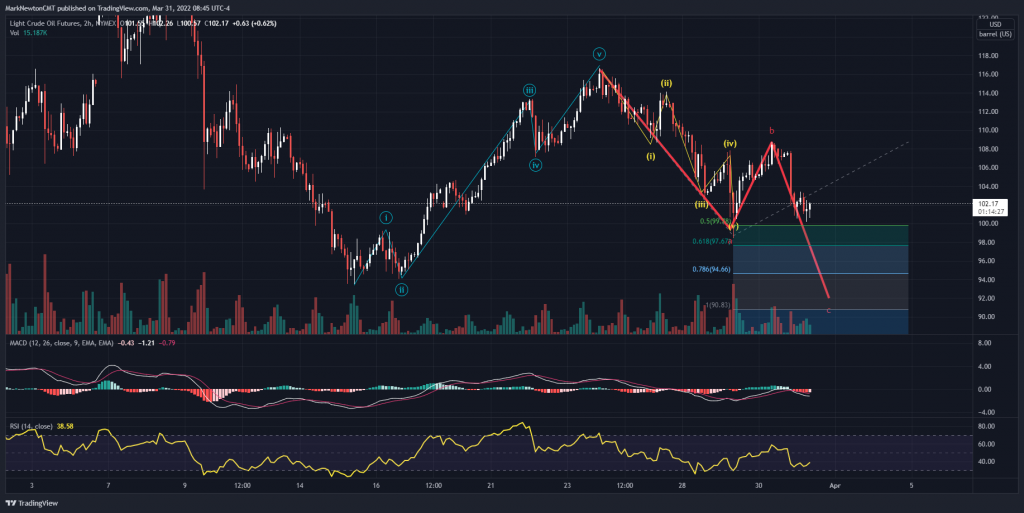
One of the consistently more volatile areas in the market lately has been Energy and WTI Crude. Interestingly enough, despite all the fear of Crude peaking out on Output hikes, prices have shown little to no real evidence of deterioration. Crude is set to finish Q1 with returns approaching 41% as of 3/31/22. Uptrends and momentum remain upward sloping.
Daily charts show mid-March lows in Front-month Futures of $93.53 to be important support, and despite the negative crossover in daily MACD below its signal line, we’ve not seen any real damage in the trend from December 2021 lows. Moreover, weekly MACD remains positively sloped and the most likely pattern developing in Crude in the last month seems to resemble a Triangle pattern, not the start of a major decline getting underway.
When looking a bit more closely at the Elliott-wave structure, the sharp rally from February into March was clearly impulsive, while the pullback thus far has proven to resemble a likely ABC corrective pattern, in my own view. Thus, it’s unlikely that early March lows are taken out, but stops on WTI Crude longs lie at $90. Pullbacks should prove to be buyable and a move back to new highs looks very possible before any meaningful decline. This recent uptick in volatility doesn’t look to be dissipating anytime soon.
Correlation has dropped sharply in recent weeks
This continues to be an excellent environment for “Stock-pickers” and the low correlation levels right now illustrate how many different things are working, despite the US stock market being volatile. The CBOE Implied Correlation index has now dropped to 35%, or the lowest levels since late January.
Over the last decade, this reached a low of 17% since late 2017, while skyrocketed over 90% during March 2020 during the rapid Equity Selloff (33% decline in 33 calendar days, 2/19-3/23/20, or a perfect 1×1 ratio (One unit of Price per unit of Time)
Overall with areas like Pharma and Healthcare Supplies acting wonderfully within Healthcare, Regional Banks and Insurance outperforming within Financials, Aerospace and Defense and Transportation stocks (ex-Airlines) showing good strength within Industrials, Agricultural Chemicals and Metals and Mining outperforming within Materials, along with Defensive areas like Utilities and REITS continuing to trade at/near 52-week highs after absolute and relative breakouts there remain ample opportunities to own stocks that are acting well. Many who are stubbornly clinging to the ideas that SQ and PYPL are bottoming might turn their attention towards these more defensive groups.
CBOE Implied Correlation index shows correlations dropping from the mid-50’s down to the low $30’s, which represents an attractive time for diversifying amongst various high relative strength names across various sectors.


