


Best two-day run for the NASDAQ since 2020; Now What?

- Wednesday’s sharp rally carried prices up to near two—month downtrends, but not yet above; Intra-day momentum is stretched, while weekly remains negative
- Both Financials and Industrials made meaningful price gains which bear watching
- Gold and Treasuries both look to be reversing course higher while the yield curve flattens

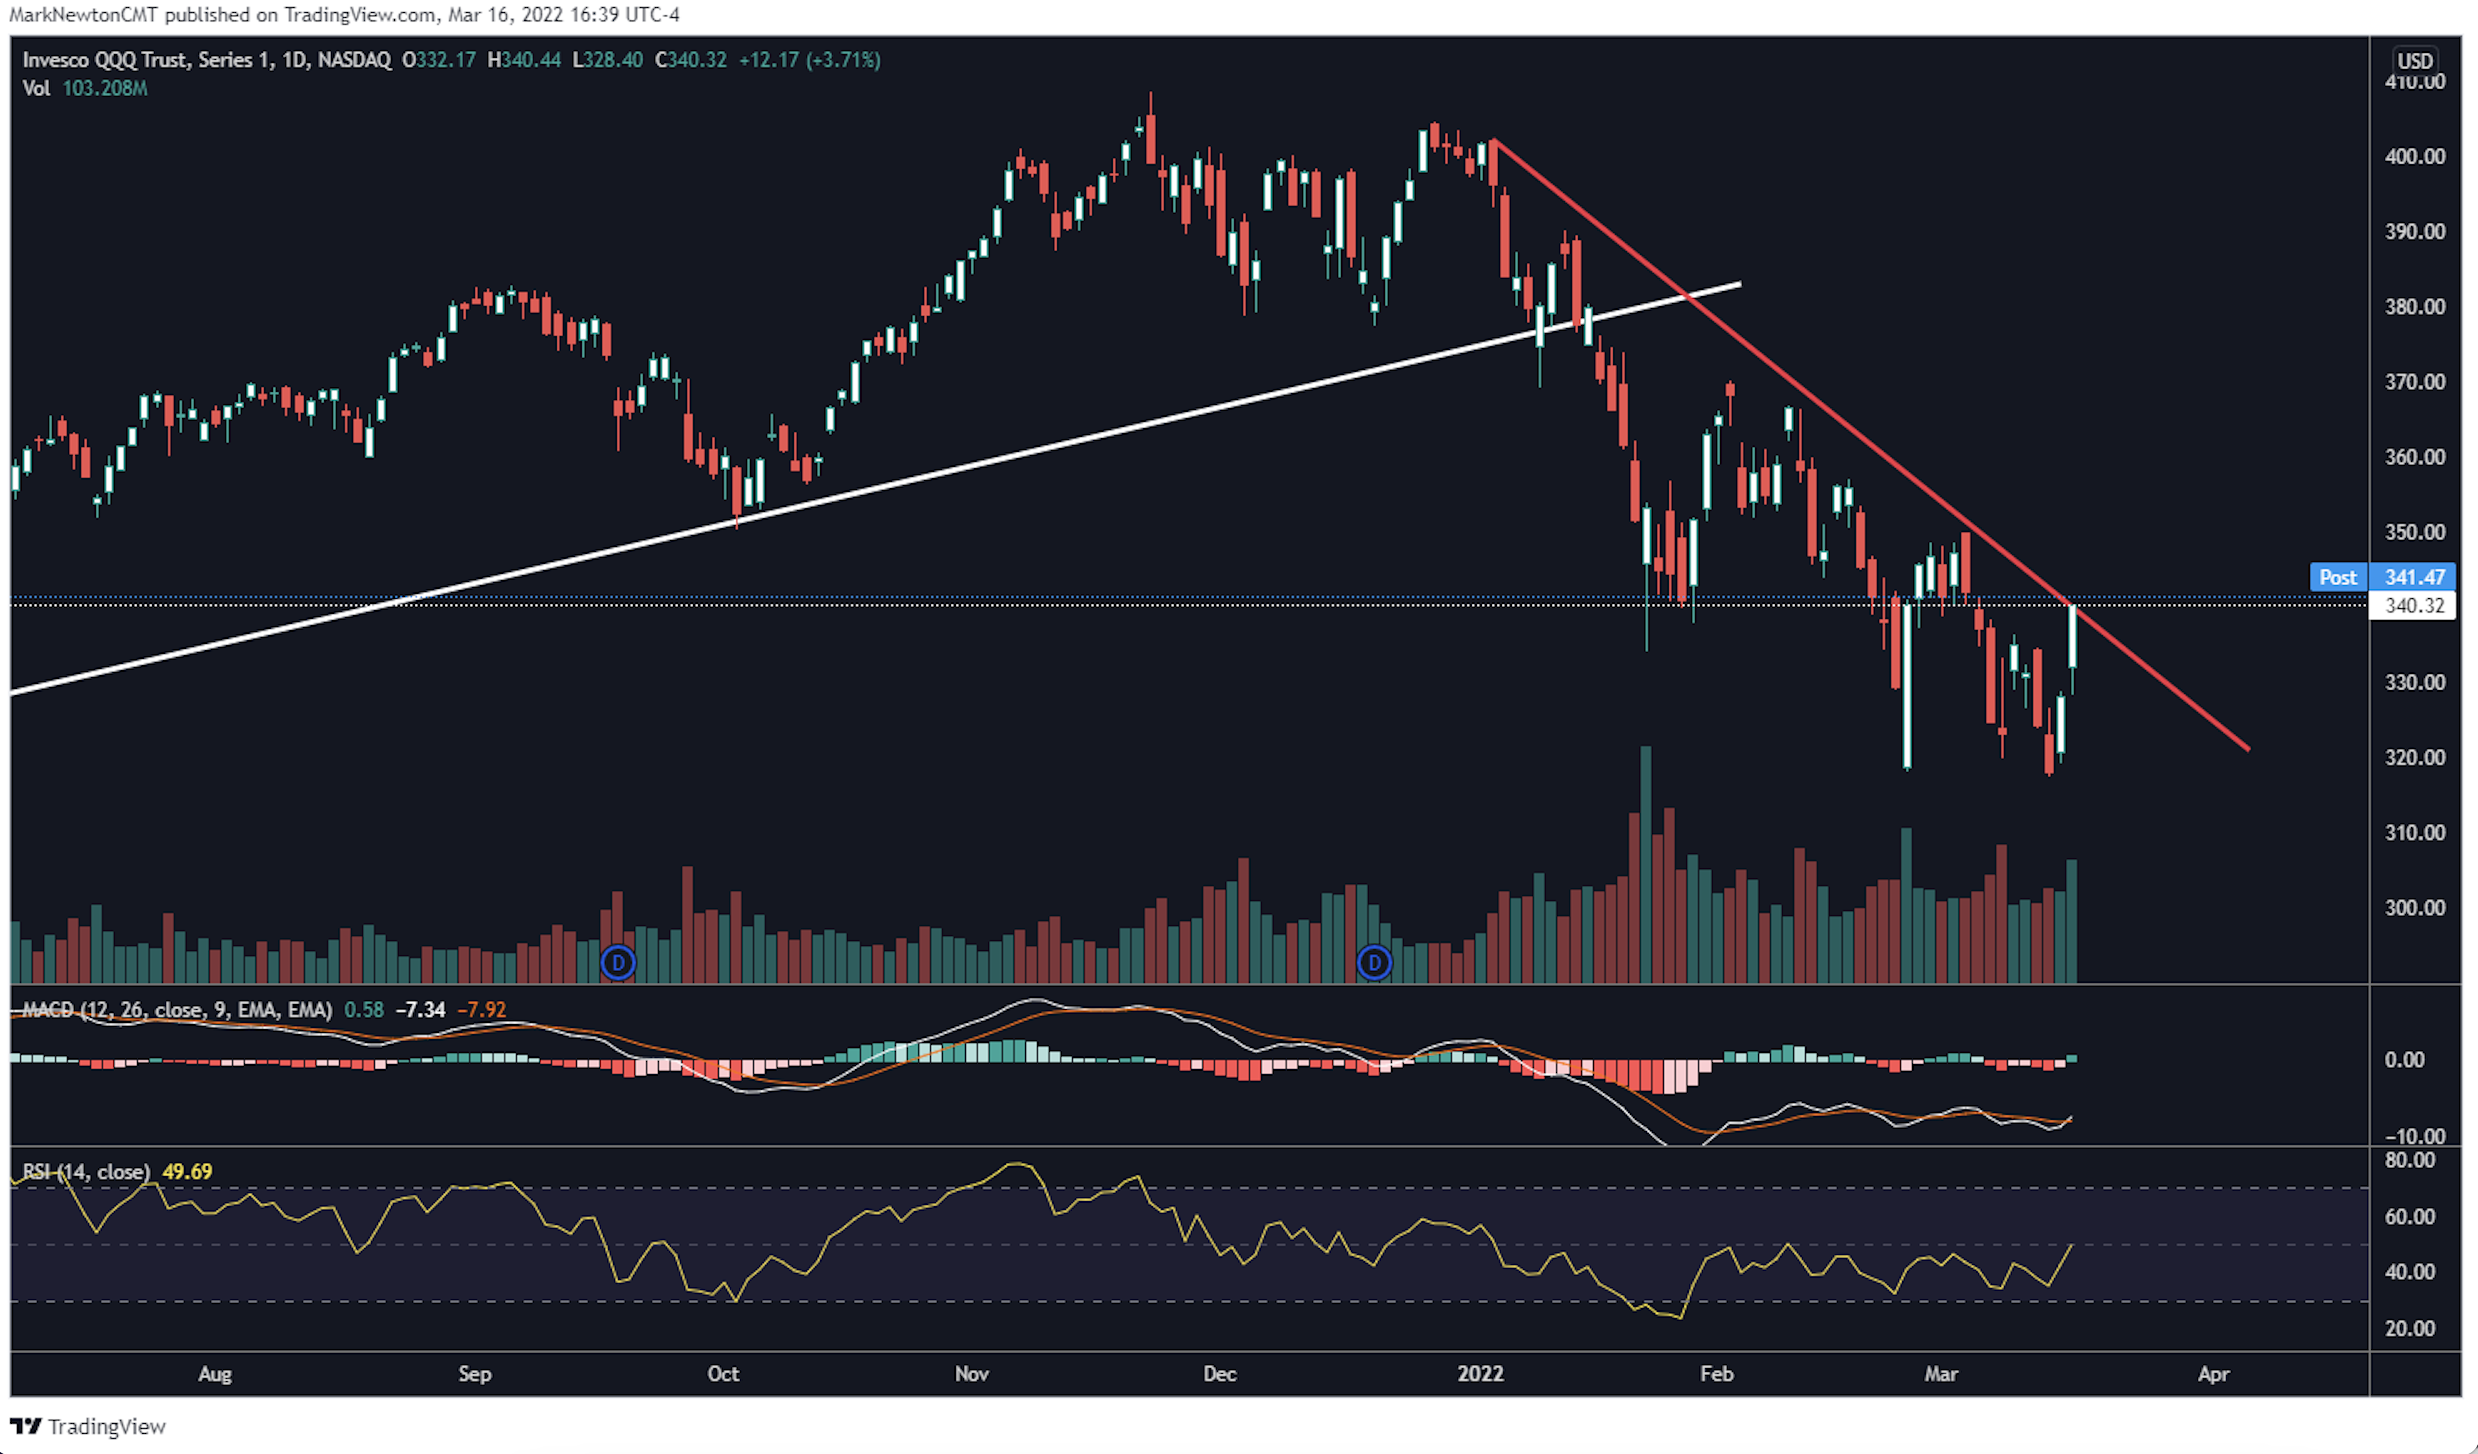
Following one of the most important FOMC meetings in recent times, the key takeaway is simple: the FOMC wants financial conditions to tighten. Both QQQ0.61% and SPX pushed up to a meaningful trendline of resistance, and movement above 350 for QQQ and above 4417 in SPX is imperative to gain more conviction that a larger rally is upon us. However, after the strongest back-to-back gains in two years in the NASDAQ which carried intra—day momentum back to overbought levels while prices remain under downtrend line resistance, more needs to happen to have confidence in this rally. Both short-term cycles and technical structure need to turn higher, and weekly and monthly momentum remain negatively sloped.
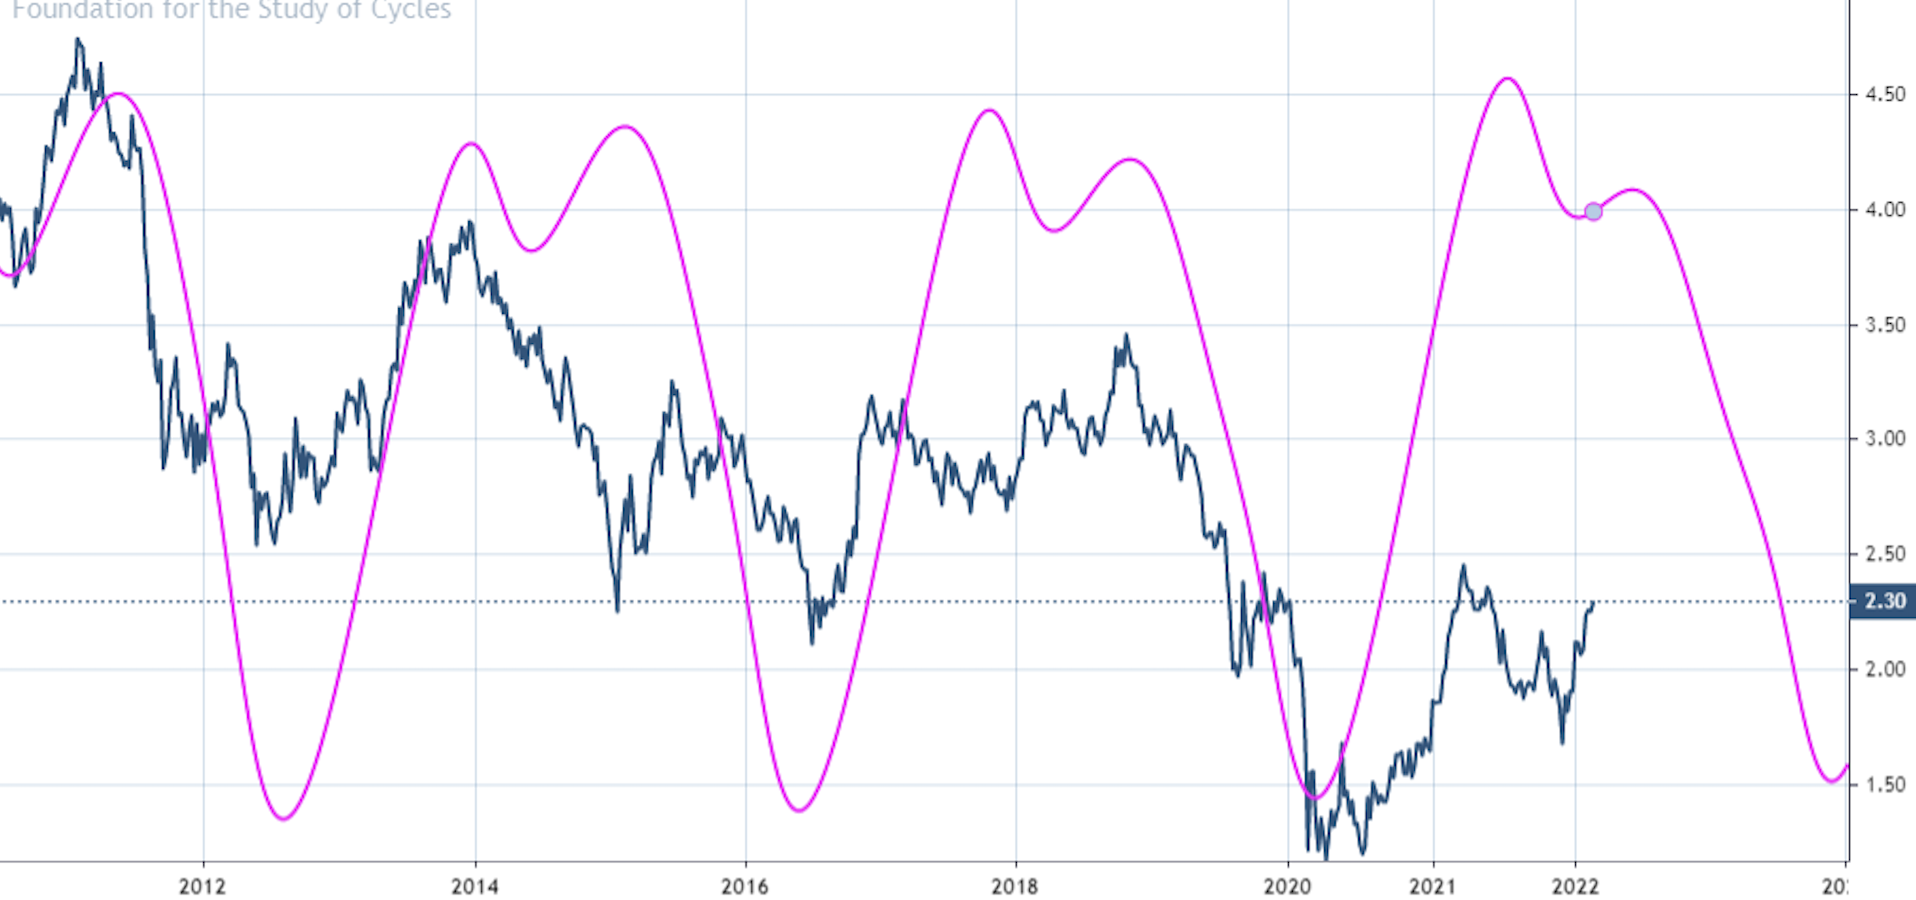
Cycles indicate some strong downward pressure in Yields from May-September of this year.
While rates seem to have risen directly following the Fed announcement Wednesday, this reversed course and the long end closed lower on the session. The 2/10 yield curve flattened and the US Dollar also fell post Fed announcement. Technically, as discussed yesterday, it looked right to fade the lift in Treasury yields into Wednesday’s FOMC meeting, as TNX, TYX have neared key resistance and could stall out and roll over in the weeks ahead.
My weekly TNX cycle composite shows extreme downward pressure in yields from May into September of this year. Thus, this recent bounce in yields into the FOMC meeting likely represents a chance to buy Treasuries, expecting rates to begin rolling over.
The near-term direction might take the form of an initial pullback in yields into mid-April, then rally attempt into May before a larger decline gets underway into Fall 2022 (rally in price terms, decline in yields)
As weekly charts of the US 10-Year Treasury yield cycles (TNX) going back over the last 10 years shows, the trend for yields should be lower from this Spring into end of 2022. Thus, using rallies in yields to buy Treasuries makes sense from a cyclical perspective. Overall, the slope seems to turn down more sharply in mid-May/early June so using any further yield gains to buy Treasuries might make sense.
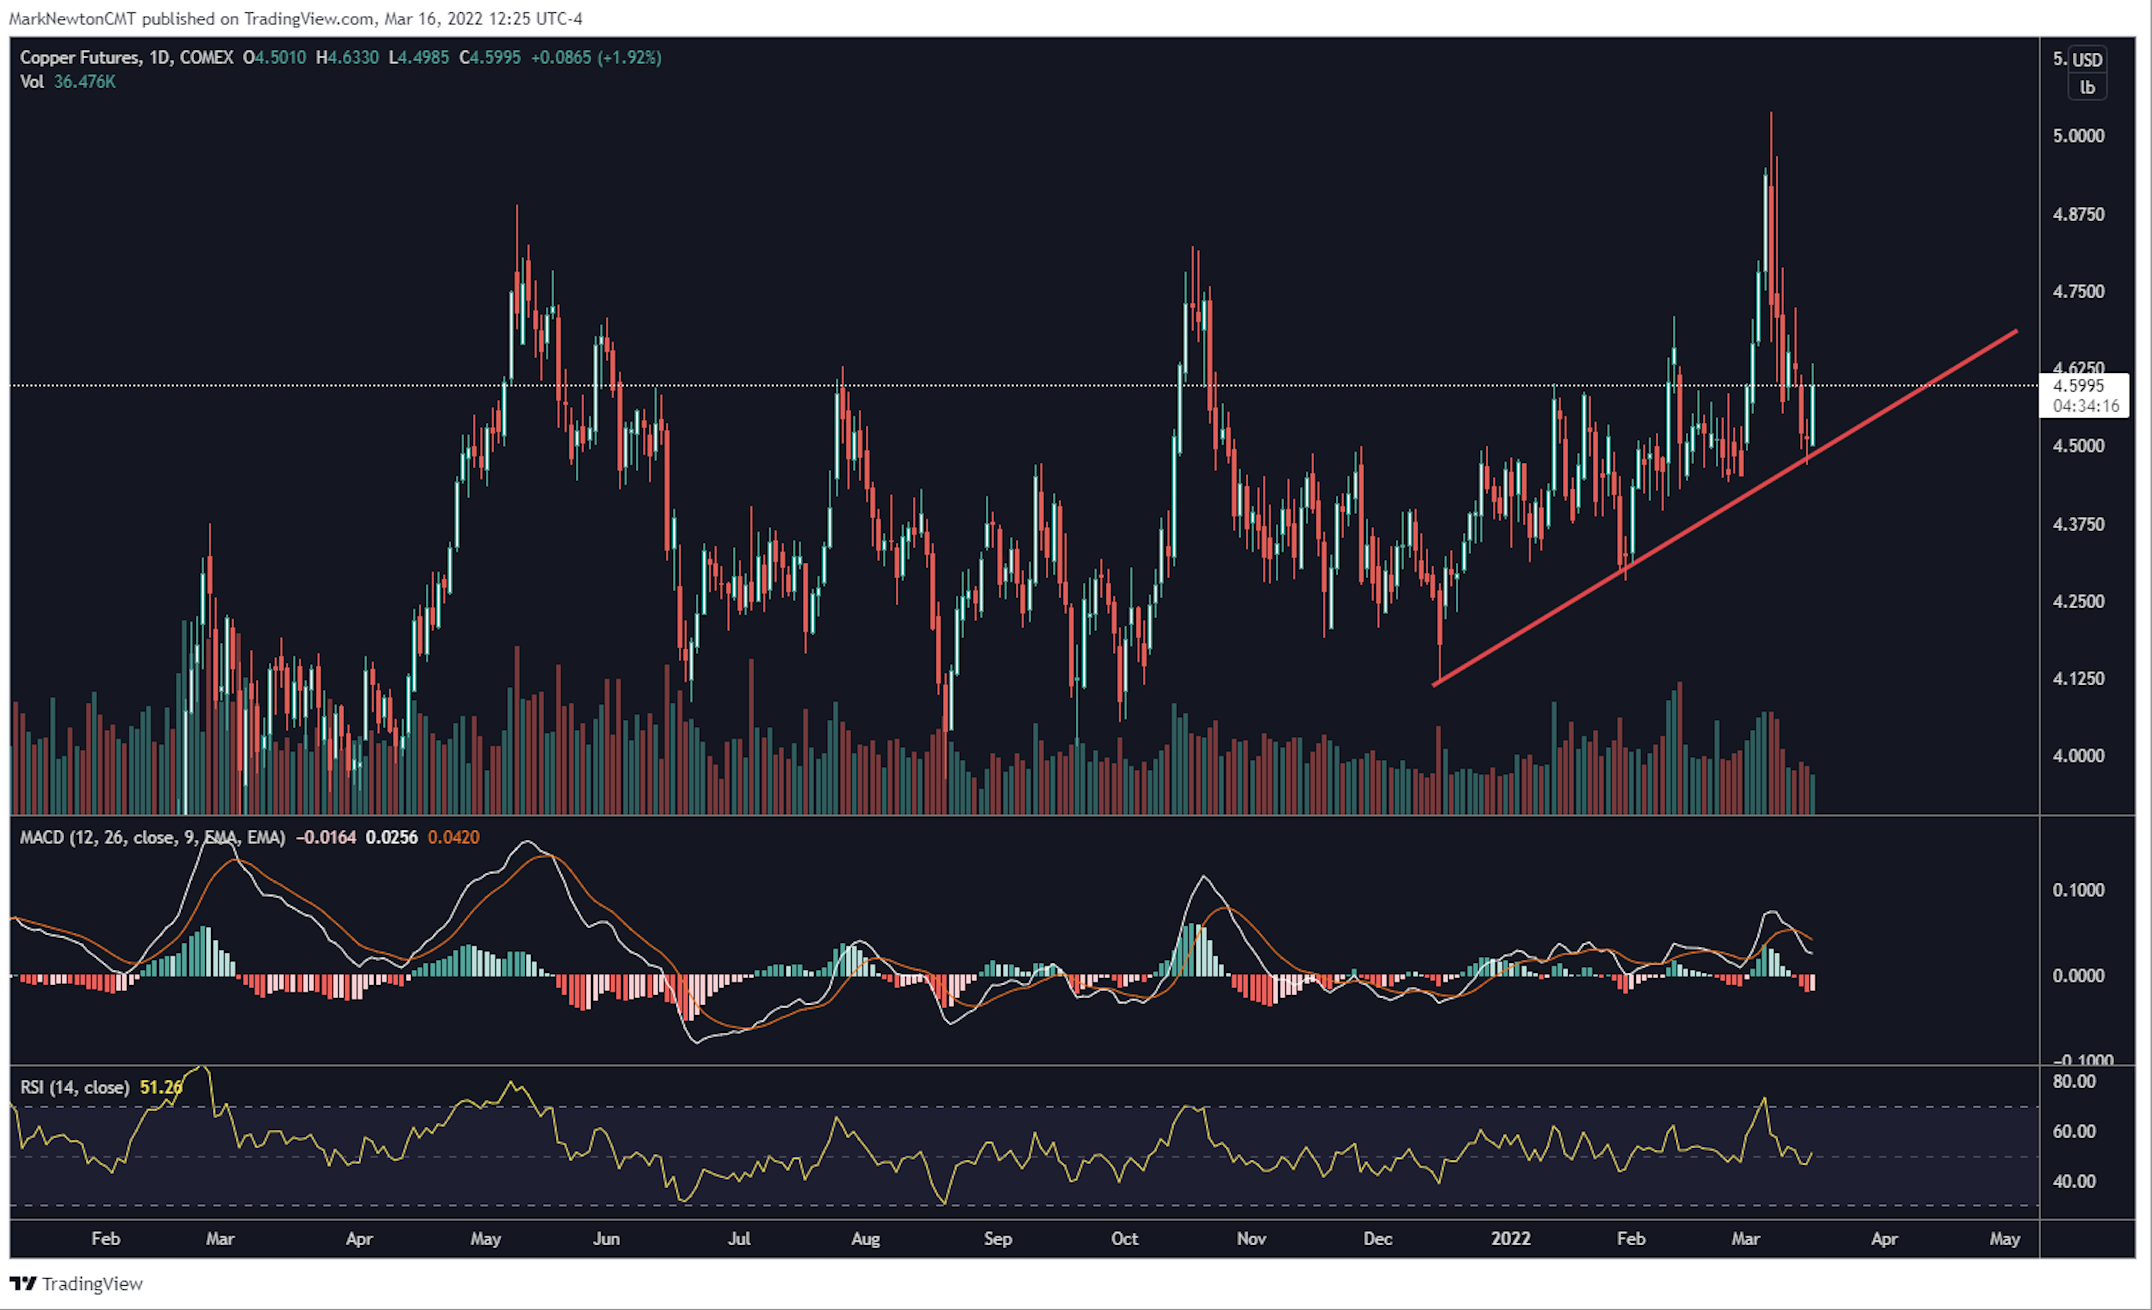
Copper looks to be actionable following its sharp pullback, and subsequent Wednesday reversal right near trendline support. This daily chart of Copper is not unlike what we’ve seen in Gold and Silver in recent days. The breakout in prices was reversed sharply in the last week. However, the larger uptrend remains intact for Copper and should give way to move back to new monthly highs. Technically speaking daily charts of front month Copper futures show prices having settled in right at a key uptrend line support. Thus after a successful intermediate-term Cup and Handle breakout, prices have now pulled back, offering a much better risk/reward opportunity to buy dips. One could consider COPX, CPER, or the stock Freeport McMoran (FCX2.40% ), as possible vehicles which might allow one to participate in an upside rally.
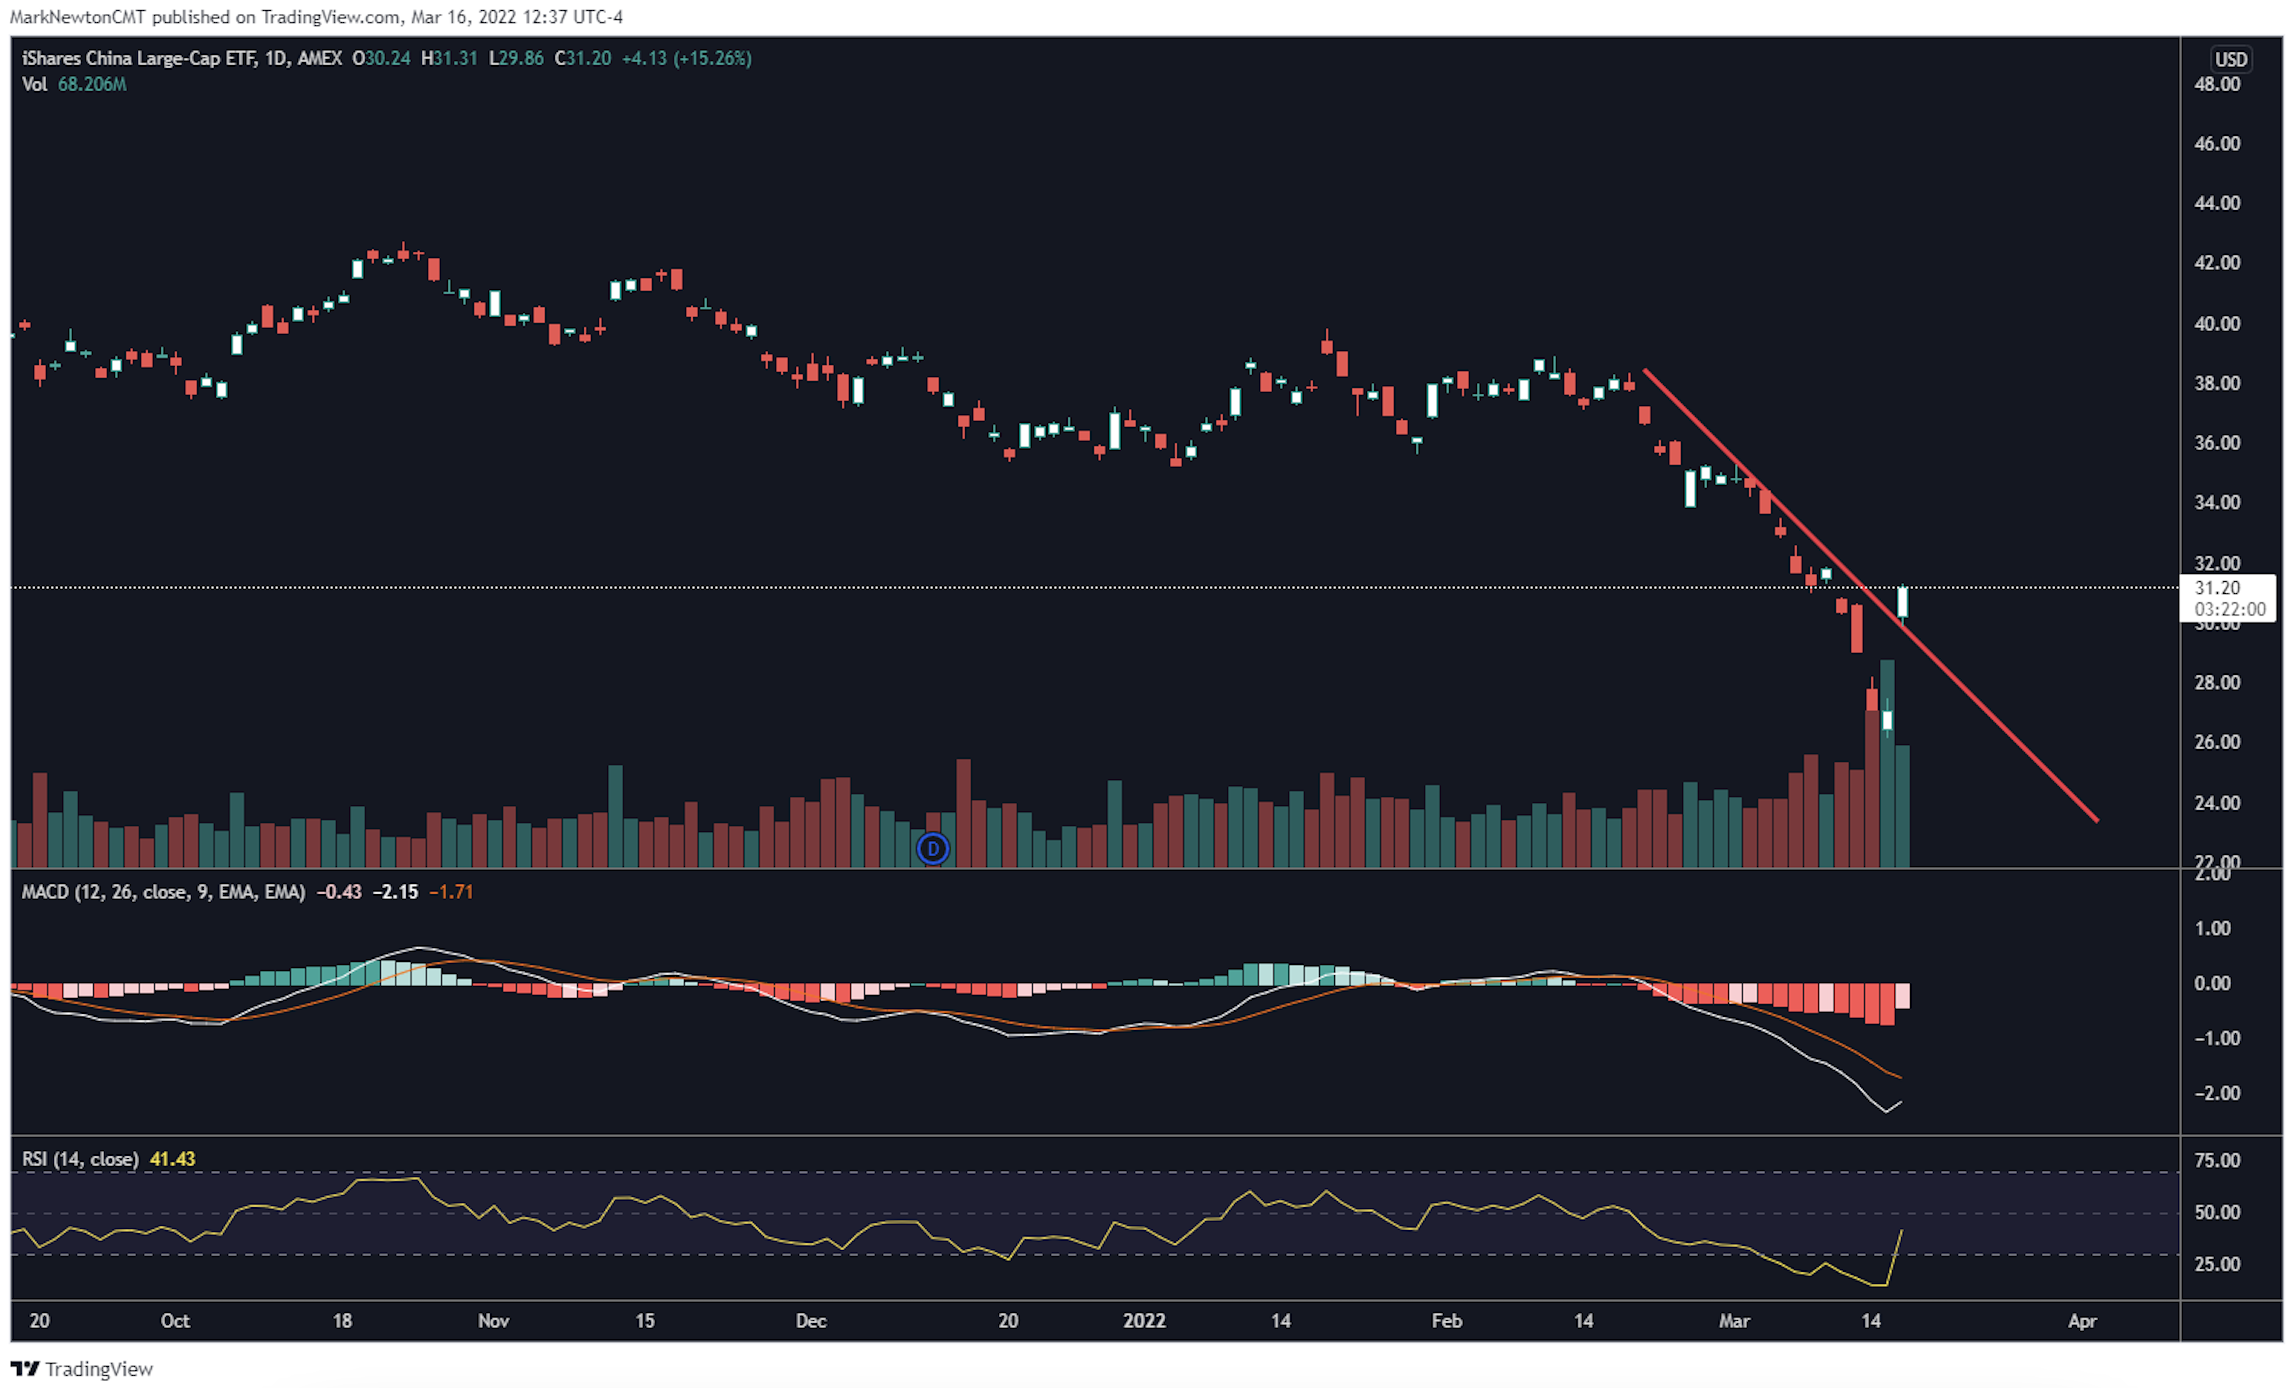
China Rally looks to have legs after a dismal February/early March decline. Finally, in what seems like a long—term coming for many, FXI0.67% , the China Large-Cap ETF, finally showed some meaningful strength after a capitulatory decline in recent weeks. Prices had undercut former lows and accelerated which had taken momentum indicators like RSI to very oversold levels. As of Wednesday’s close, FXI successfully regained the current downtrend, and closed near the highs of the day with very heavy volume. Technically this is a constructive sign that typically bodes well for upside follow-through following such a steep decline. Areas of interest on the upside lie near $35.50-37 as an initial targeted area of resistance on this rise, while far more strength is necessary on an intermediate-term basis before gaining conviction that a larger rally can occur. At present, this is an initial constructive sign that finally gives me a bit more confidence that Chinese equities might be able to show some follow-through.
More from the author
Articles Read 1/2
🎁 Unlock 1 extra article by joining our Community!
Stay up to date with the latest articles. You’ll even get special recommendations weekly.
Already have an account? Sign In 820d80-7087d1-599947-264a51-179524
Already have an account? Sign In 820d80-7087d1-599947-264a51-179524

