

What Our Clients Are Talking About Behind The Scenes

FLASH COMMENTS:
With things quieting down as many are away for this last week of the summer, I am once again going to keep my comments brief.
Well, we finally got past Jackson Hole and Chair Powell seems to have definitively cleared up the issue of the “Dovish Pivot.” From my perspective, it has been interesting and frustrating to watch the equity market move aggressively higher on the perceptions that the Fed had supposedly signaled that it was moving closer to easing, especially when my view and research did not support that conclusion.
Thus, it should not be surprising to my regular readers that, now that the main driver for the equity bounce since the July Fed meeting has been taken off the board, selling pressure has once again resumed. My work has and still suggests that downside risk is significant and that a full retest of the June lows near 3600 is quite likely, and this remains my base case. Moreover, my indicators are still warning of even further potential weakness down to 3200-3000 if the earnings revisions cutting cycle that I have been discussing not only accelerates but also considerably weakens.
With domestic economic growth surely to be weakish going forward as commodity prices remain elevated, interest rates are up, and the labor market likely to slow, it’s hard for me to find evidence in my work that suggests that the profit outlook for 2023 will meaningfully improve. And if the Fed is going to be higher for longer before moving back to easing, I am also hard pressed to make a case for higher valuation multiples. Does this sound like the usual case for a new sustained bull market run to higher highs? Not for me and my indicators. I am also beginning to see some anecdotal evidence that the “extreme bearishness” in positioning might not be as extreme as once thought.
So, bottom line for me, the cranky in-house bear, forward earnings expectations still remain too high and likely need to be lowered. Hence, there is still more estimate cutting that is on the way in coming months, and maybe quarters. With it now looking less likely that the Fed is going to ride in and rescue us, my work strongly suggests that earnings DO MATTER, which was still an unanswered question last week. Therefore, I continue to be concerned about downside risk, and my indicators suggest selling rallies and NOT buying dips. For positioning, I am still recommending Growth, both defensive and offensive, relative to Cyclicality. The opportunity to aggressively pivot towards increasing risk, lowering cash levels, and moving to offense is still in front of us.
Enjoy your last week of summer as it may be a wild, challenging journey into year end.
MAIN CLIENT ISSUES
- Activity levels began to slow a bit last week, but there were still enough people around to get a sense what the main issues were and how investors were positioned. Almost all the comments were similar to last week’s, which I will once again include below. The big shift was a handful of clients I spoke with post Powell’s Jackson Hole speech was — “FINALLY!”
- Clients that are more fundamental/macro driven with a medium/longer-term outlook remain quite skeptical of the ongoing bounce and most are more inclined to sell into the recent strength rather than chase it higher.
- On the other hand, clients that are more tactical and open to technical analysis have been more willing to play the bounce and chase for more because they can shift to neutral/bearish quite quickly. I will be alert to see how this might change this week.
Additional Takeaways and Main Discussion Points Are As Follows:
- That the rate of change on inflation has peaked is nearly 100% agreed upon.
- However, a 50/50 split on whether inflation’s downward trend is now firmly in place or will it be a challenge to break its back and get pressures below 4-5%.
- The U.S. economy will likely not reaccelerate without a supply side change for energy and a fall in crude below $70, or the beginning of Fed easing. There was not a lot of conviction on soft vs hard landing, but there were a lot of questions asking about my view.
- Earnings are not likely to accelerate going forward, but there is some disagreement on whether they should be flattish or need to be lowered. No one had the view that there was significant risk to forward profits like the COVID lockdown period or Financial Crisis.
- There were a lot of questions asking about an update on the S&P 500’s ASM indicator, which is my proprietary earnings revision metric, and my thoughts on how much further I think it must fall.
- No one had the view that a Fed easing was imminent. With that being said, there were a lot of varied opinions on how much higher, how much longer, and when will policy have less of an impact on equities.
- There was not a strong consensus on what the impact will be of the Fed’s upcoming increase in their monthly Quantitative Tightening actions, and most are not considering it in their positioning thought process.
- No one was fully on board with the rally that began at the June low, and most were between skeptical to “the last 100-200 SPX points make zero sense”.
- Nearly everyone was aware that positioning still appears to be negative, that there is a record short positioning in SPX futures, and there may be more mechanical flows/corporate share buybacks. This was a point of concern for most.
- Lots of questions on positioning.
SPECIFIC CLIENT QUESTIONS
- What are your thoughts on sector (GICS L-1) positioning?
- What are your most aggressive tactical indicators saying?
- Has HALO also turned unfavorable?
MY ANSWERS
- What are your thoughts on sector (GICS L-1) positioning?
The sector 8-panels have not shifted that much over the last several months and continue to suggest that investors be above neutral in Staples, HC, Energy, Utilities, and Technology and below neutral for CD, Finanicals, Industrials, Materials, and Comm Services.
My indicators continue to suggest a portfolio construction that is overweight Growth versus Cyclicals with a mix of both defensive and offensive Growth. While there is upward pressure on interest rates, the defensive part of this mix will likely outperform Tech and growthier parts of HC as their higher multiples will likely come under pressure. Based on my work, patience is going to be important as downside risk is elevated. In addition, if the Fed is indeed going to be higher for longer before moving back to accommodation and with my sector 8-panels not signaling that extremes on either side are present, then there could be an extended period of weakish equity market performance.
The deep dive into my sector weights will occur this week so be alerted for my updated views.
- What are your most aggressive tactical indicators saying?
Since both flipping to unfavorable on 8/17 as I discussed in my 8/19 Whispers, my most aggressive tactical tools are still falling, which suggests more tactical downside is likely until they both can positively inflect.
When using my highest-frequency and most aggressive tactical timing tools — V-squared (orange line top chart) and HALO-2 (purple line bottom chart) – which were extremely helpful in identifying many of the tactical trading reversals since 4Q17, they are now both unfavorable for the first time since the S&P 500’s June low, which are contrarian bearish readings.
Granted the rollover in V-squared is quite small, but if it holds and both indicators keep heading south there is a high probability that the S&P 500’s rally may have just ended. Investors need to be quite careful while they both remain unfavorable.
If my other tactical tool, HALO, also rolls over next week, it would be a strong confirmation and raise the odds even more that the equity market has downside risk until they both reached their next bullish reversal signals.
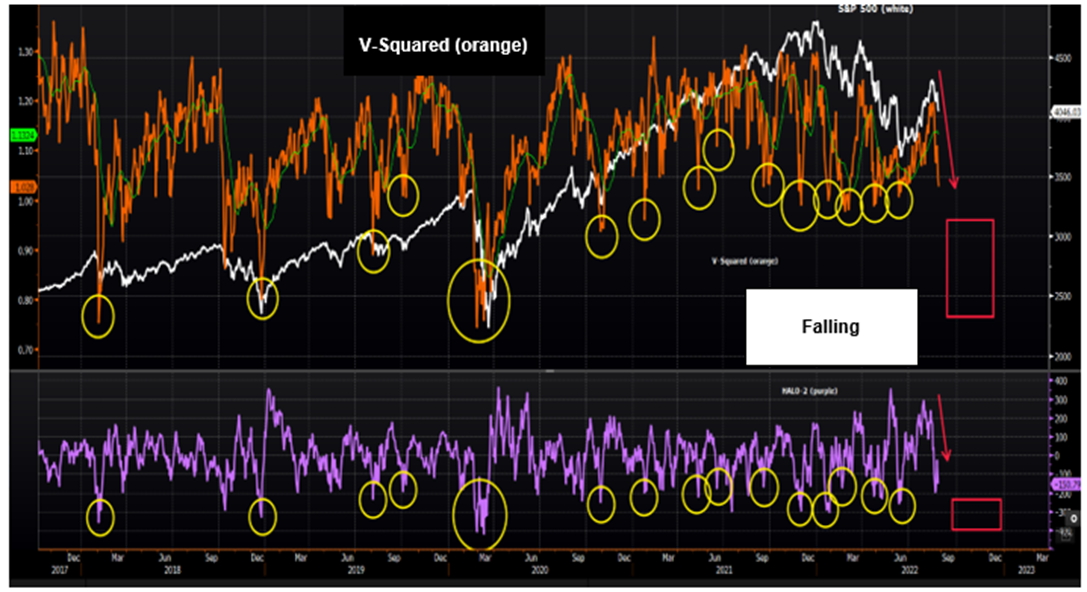
** NOTES – The proprietary Fundstrat Portfolio Strategy V-squared indicator shown in the top chart (orange line) shows the ratio of VXV (the 3-month CBOE S&P 500 Volatility Index) and the VIX (the 1-month CBOE S&P 500 Volatility Index). This tool is also useful for identifying aggressive tactical trading bottoms for the S&P 500.
The proprietary Fundstrat Portfolio Strategy HALO-2 Model, which is the purple line in the lower chart shown above, is the raw tactical data behind our standard HALO multi-factor model described on the previous page. It is useful for identifying aggressive tactical trading bottoms for the S&P 500.
- Has HALO also turned unfavorable?
Yes, it finally rolled over. The early warning that came from the HALO-2 and V-squared negative inflection has proved to once again have been accurate. Thus, not only is the tactical outlook challenged, but also the 1-3 month forecast as well.
My preferred tactical indicator (HALO, blue line below) for the index has provided many significant tactical reversal signals since 4Q18, which all ended up rewarding investors. As a result, the model continues to be value-added and remains quite relevant. Beginning in June, HALO had a positive inflection and rose until last week when it finally rolled over. Importantly, with both my aggressive metrics unfavorable as well as mentioned above, my work is suggesting that rallies should be sold, and that the downside risk is considerable until my historically helpful tools begin to show signs of negative extremes and bottoming.
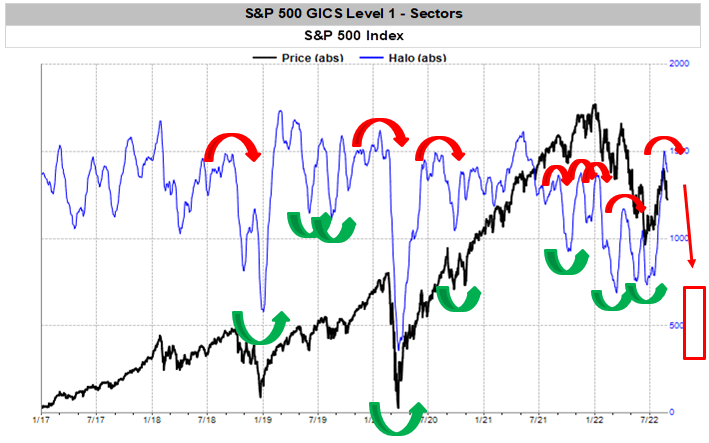
* NOTE – The proprietary Fundstrat Portfolio Strategy Halo Model is a multi-factor model that attempts to predict the forward 1 – 6 month relative performance of a group. The goal is to help both strategic accounts better time their implementation strategies that would be consistent with our more strategic conclusions derived by our sector/sub-industry 8-panels as well as our stock specific Estimate Revisions Model (ERM), and to generate tactical ideas for aggressive trading accounts.
The model has both momentum and contrarian characteristics. When the blue line, which is the model, is trending, our proprietary tool is in a momentum phase, and our research shows a high probability that relative performance will mirror the slope of the line. Importantly, because the model is built to oscillate, an extreme reading that inflects strongly suggests that a reversal in the most recent performance trend is likely to occur.
More from the author
Articles Read 1/2
🎁 Unlock 1 extra article by joining our Community!
Stay up to date with the latest articles. You’ll even get special recommendations weekly.
Already have an account? Sign In c48dca-a21aa9-60e307-c1b852-b212fb
Already have an account? Sign In c48dca-a21aa9-60e307-c1b852-b212fb

