Click HERE to access the FSInsight COVID-19 Daily Chartbook.
STRATEGY: 3 trading days into election day… 21 trading hours of agony
A state of COVID-19 in 8 bullets:
– COVID-19 rising in Northern hemisphere –> US and Europe
– COVID-19 fading in Southern hemisphere –> Latin America and India
– Europe cases are rising parabolically
– US cases are rising linearly
– Wave 3 in US is encompassing 20 states that were unscathed in wave 1 and wave 2
– Within wave 3, 6 states are driving surge –> WI, IL, ID, ND, SD, UT, or WIINSU for short
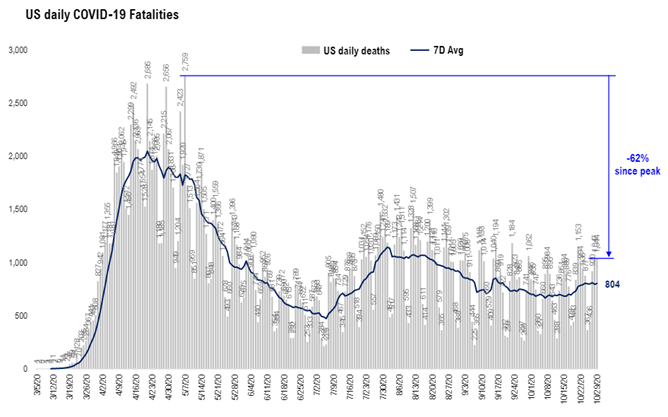
– As US cases reach new highs, US daily deaths are steadily falling.
– COVID-19 is unforecastable and the future is uncertain
So in a nutshell, COVID-19 is spreading and much worse in Europe. Yet, mortality is falling. The skeptics would say mortality is low because the virus is making its way to the vulnerable cohorts (lag). Others would point to the “deadwood” issue and many of the vulnerable have already been killed. Therapeutics are far better. And mitigation is better. But the key issue is avoiding the level of policymaker panic that would lead to broad economic shutdowns.
Many experts view the Europe surge as a prelude to a wave coming to the US. This was certainly true in March of this year, when the outbreak started in Europe.

Source: WSJ
Indeed, in March 2020, Europe was a prelude to a surge in the US:
– Europe hit 3,000 cases on 3/11/2020
– USA hit 3,000 cases on 3/20/2020
– both regions saw a parabolic surge after 3,000 cases
– 9 day lag between Europe and the USA
Source: Johns Hopkins and Fundstrat
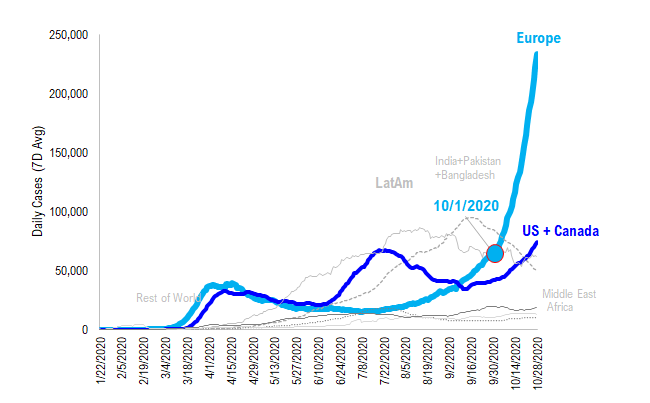
– Europe parabolic since 10/1/2020
– USA linear since 10/1/2020
Europe has been in a parabolic surge in cases for the past 28 days. In that same period of time, the US has been in a linear, but a painful rise in cases.

Source: Johns Hopkins and Fundstrat
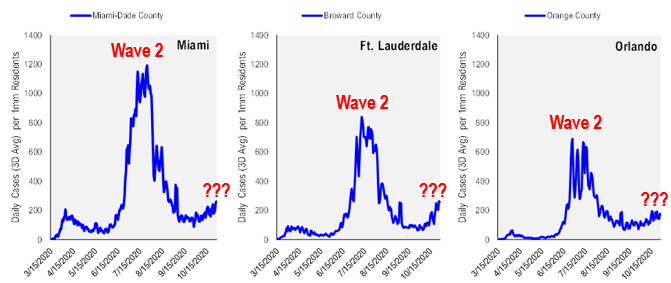
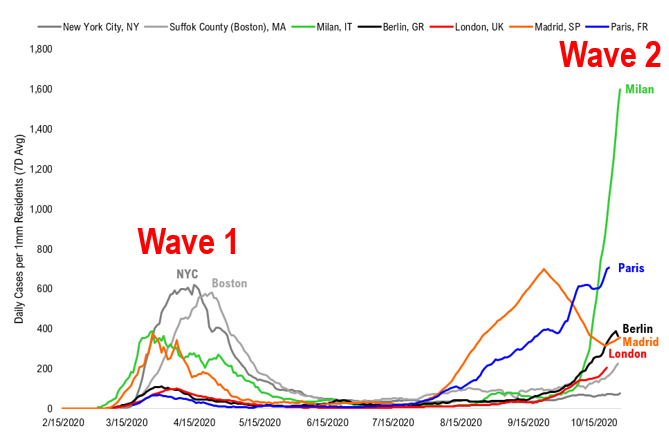
In fact, if we look at some of the cities at the heart of Wave 1 and Wave 2, we can see that there is hardly a new wave of cases burning across these cities.
– Recall how bad we saw that wave of cases in Florida?
– Since September, FL has lifted all restrictions, as a result of an Executive Order of Gov Ron DeSantis
Daily cases in FL have hardly increased from their lows. And they remain way off their peaks.
Source: Johns Hopkins and Fundstrat
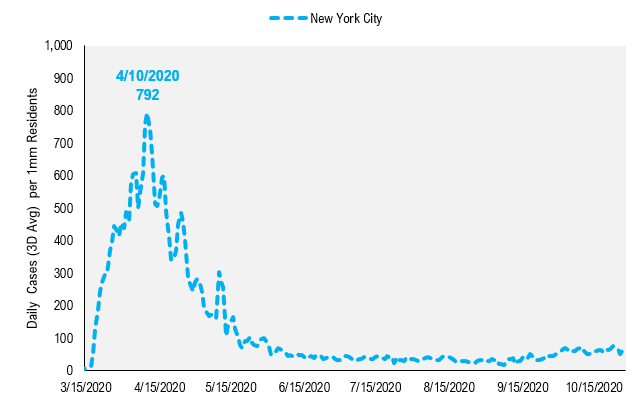
And NYC has seen a barely perceptible rise in cases since October 1. The takeaway is to again emphasize that wave 3 is really a wildfire through areas of the US that were largely untouched.
Source: Johns Hopkins and Fundstrat
Harvard study affirms the safety of air travel. Why are cruise lines still banned?
Last week, we had highlighted how traveling on a plane is even safer than walking on the streets of NYC. There is a 1 in 10,000 chance of encountering an infected on a plane. And a recent Harvard study has done further work on this. Their recent study suggests that given the air filtration and with mask usage, flying is safer than grocery shopping.

https://www.hsph.harvard.edu/news/hsph-in-the-news/with-proper-precautions-flying-can-be-safer-than-grocery-shopping/
If reality is better than perception, epicenter stocks are better risk/reward…
This comes back to our view that many epicenter activities are perceived to be a lot riskier than they actually prove to be. The other areas that are currently restricted but likely going to prove to be safer are:
– cruise lines
– movie theaters
The reason we think cruise lines will prove to be safer, is that the industry’s survival depends on it. I am sure the past problems of cruises have involved careless passengers and lax enforcement. But like casinos, airlines and restaurants, enforcement is not stigmatized. And passengers will undoubtedly be more careful as well.
In fact, our Head of Technical Strategy, Rob Sluymer, shared this message with me. I asked him what he would add in this carnage.

So bottom line. This has been an ugly week. And there are another 3 trading days before election day. But we are still seeing this weakness as a positive risk/reward.
Below is a reprint of the list we published last week.
What else were we afraid of that proved to less scary?
– air travel
– professional sports
– schools
– restaurants
– subways
– casinos (yup)
– grocery stores
– retail stores
– beaches
– mass protests
What is worse?
– bars
– nursing homes
– homeless shelters
– prisons
– choir practice
– vaping
– huge weddings
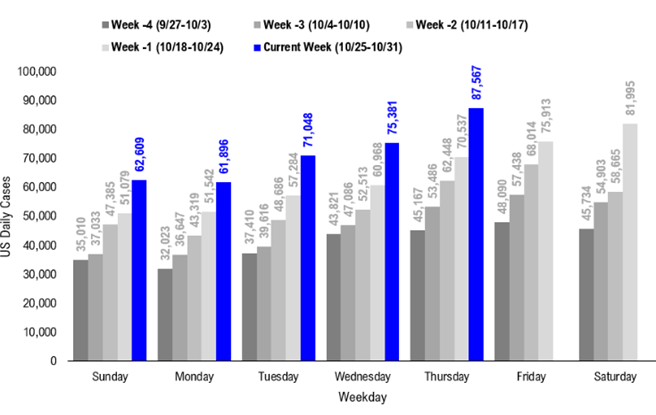
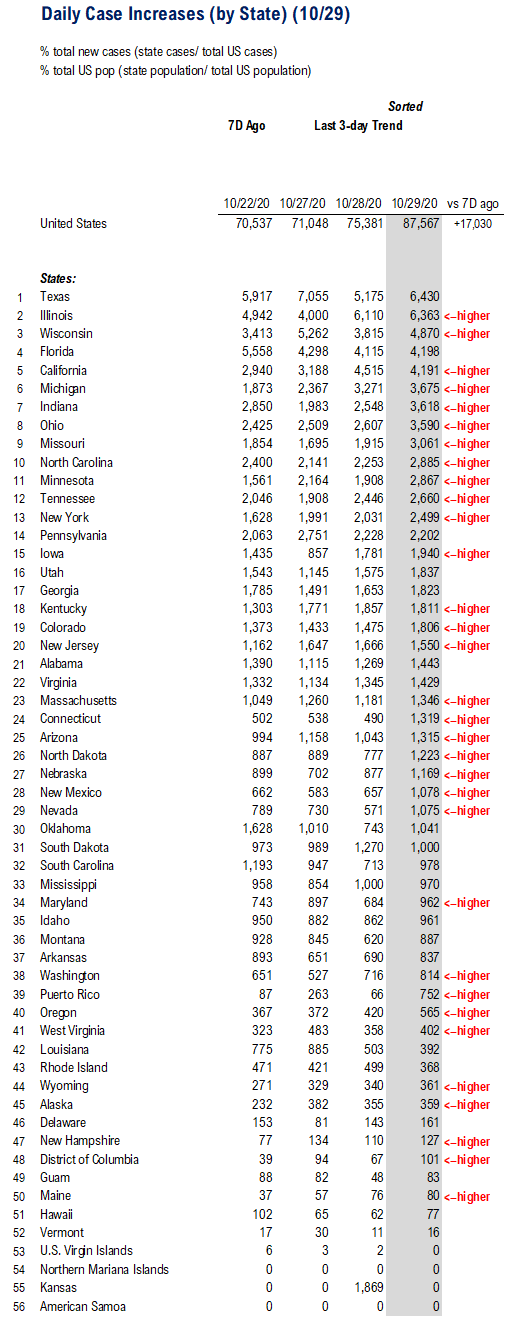
POINT 1: Daily cases 87,567, +17,030 vs 7D ago — less linear closer to parabolic
The latest COVID-19 daily cases came in at 87,567, up +17,030 vs 7D ago. We are still waiting for policymakers and citizens in wave 3 states to panic. This has not happened yet and cases are rising at a slightly elevated pace.
– still linear increase
– but less linear last 4 days
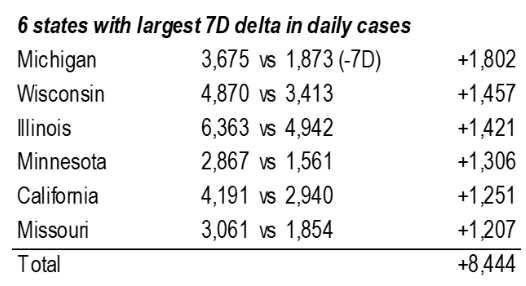
– 6 states account for 60% of the rise in cases — all wave 3 basically
Source: COVID-19 Tracking Project and Fundstrat
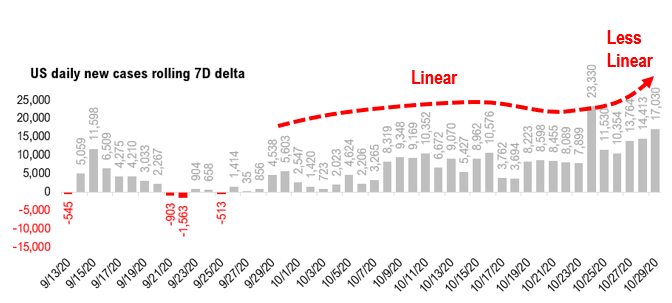
US daily cases 7D delta is up but not exponential…
Again, the daily change vs 7D ago, in our view, is the leading indicator as it is what influences the 7D moving average.
– Daily cases are rising vs 7D ago, but the rate of increase is been constant.
– It does not seem to be accelerating (becoming exponential), which is key
– there was 1 day where daily cases surged 23,000 (exponential-like) but it was a 1-day surge
Source: COVID-19 Tracking and Fundstrat
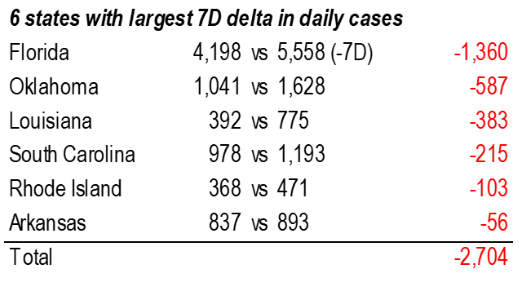
The 6 states with the largest increase are basically all wave 3 states (except CA). And we are waiting for people in these states to really panic and start to mitigate the spread. These 6 states are 60% of the rise in cases. So, it is still a wave 3 story.
Source: COVID-19 Tracking and Fundstrat
Daily deaths remain muted as well. In fact, the trend for daily deaths is actually falling.
Source: COVID-19 Tracking and Fundstrat
Looking at the 7D delta, we can see daily deaths are flat to down while daily cases are soaring. Hospitalizations are up as well. This is a reminder that the future is very uncertain. So, while this is a relatively benign picture now. It could easily worsen.
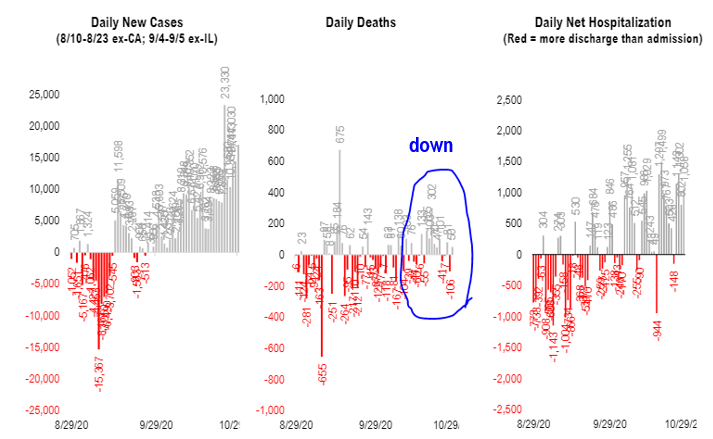
Source: COVID-19 Tracking and Fundstrat
Source: COVID-19 Tracking and Fundstrat
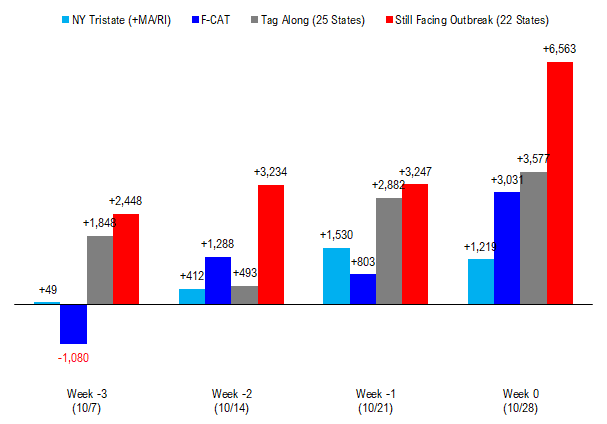
POINT 2: Wave 3: Looking at case prevalence of 6 worst states — WIINSU
6 states represent the heart of Wave 3–WIINSU, or WI, IL, ID, ND, SD, UTto wave 1 (April, NY tristate) and wave 2 (July, FL, CA, AZ, TX, or F-CAT), wave 3 in the US is comprised a broader set of states 20 and these were states not previously torched in the prior waves. So tracking this breakout in wave 3 involves a considerably large number of states, with much smaller cities, and thus, there are many more areas to track.
– the chart below tracks 7D delta in cases
– the largest 7D increase is coming from the wave 3 states
Within this group of 22 states, 6 states are out-sized contributors, based upon daily cases per 1mm:
– Wisconsin
– Illinois
– Idaho
– North Dakota
– South Dakota
– Utah
The simplified acronym is WIINSU
Source: COVID-19 Tracking Project and Fundstrat
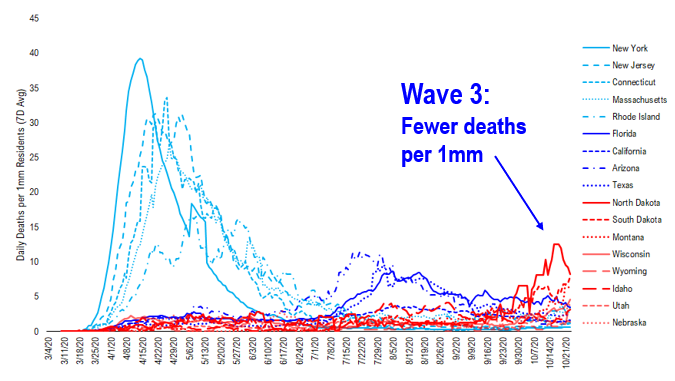
COVID-19 deaths have been mild in wave 3, which is probably a factor why residents have not panicked…
Once cases surge to a certain level, we expect policymakers and residents to panic. And it is this panic that allows for the R0 to break and for cases to the peak. But daily case figures are probably not the only factor creating panic, it is mortality. And as shown below, the daily deaths per 1mm residents is a fraction of what we saw in wave 1 and milder than wave 2 (except for North Dakota). So I can see the arguments made by residents that COVID-19 does not warrant them to take immediate mitigation measures.
Source: COVID-19 Tracking Project and Fundstrat
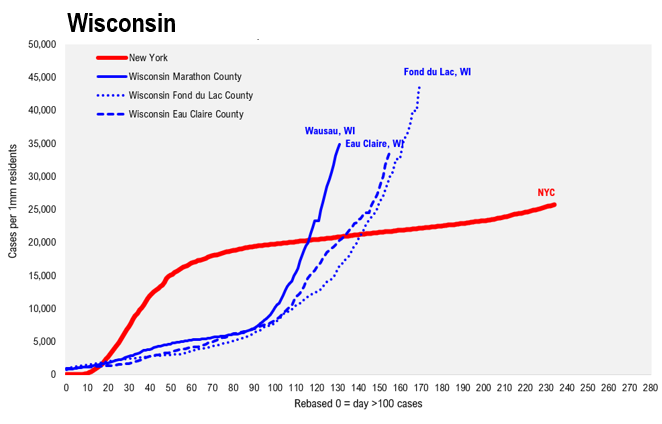
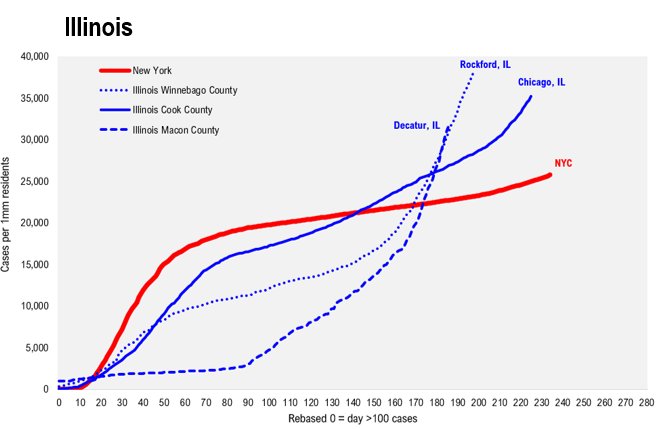
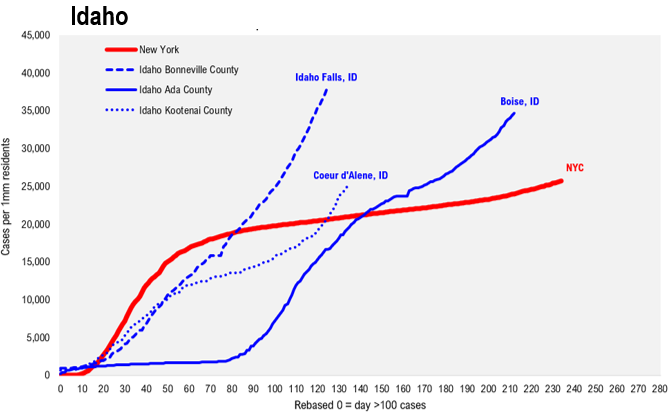
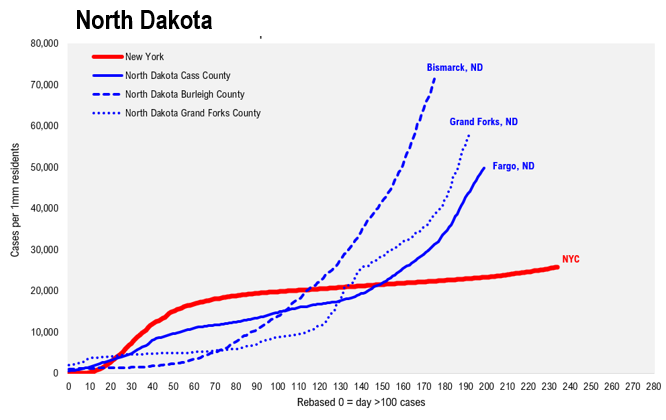
Looking at the key counties within WIINSUWithin each of these 6 states, our data science team identified the 3 key counties, based upon either case prevalence or case velocity (daily cases per 1mm) and looking only at counties >100,000 residents. Altogether, these 18 counties would be key to watching wave 3 unfold. After all, once policymakers and residents panic, we could start to see a mitigation of case growth rates. And this means looking at both case prevalence as well as daily cases.
WI — Wausau, Eau Claire, Fond du Lac
IL — Chicago, Rockford, Decatur
ID — Boise, Idaho Fall, Coeur d’Alene
ND — Fargo, Bismarck, Grand Forks
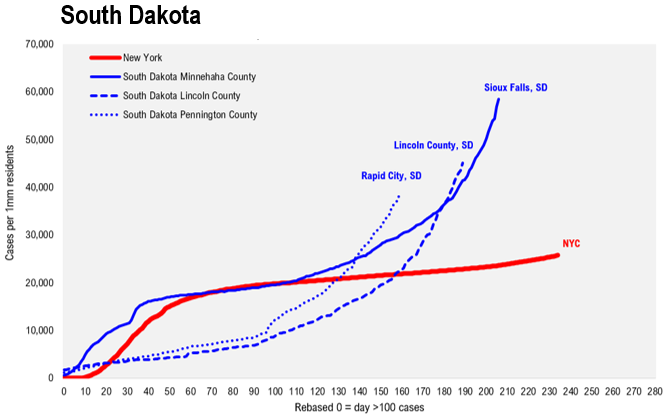
SD — Rapid City, Lincoln, Sioux Falls
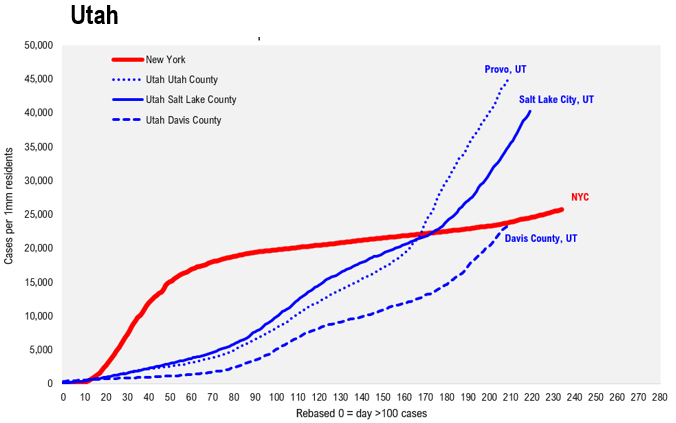
UT — Salt Lake City, Provo, Davis County
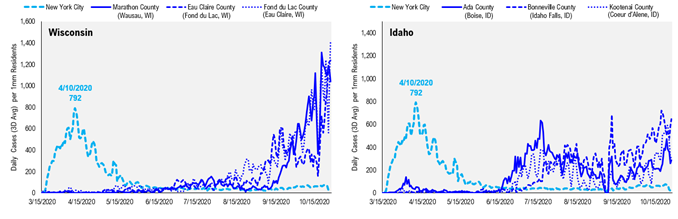
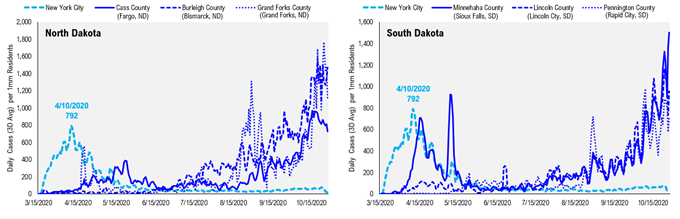
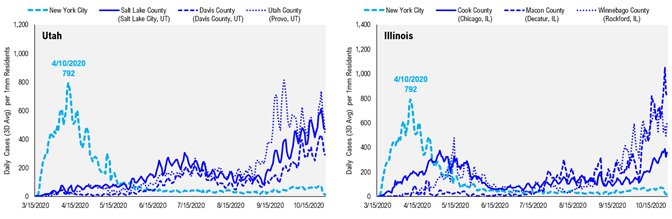
WIINSU Velocity — daily cases per 1mm surging past NYC levels, but some signs of peaking…
The 6 charts below reflect the 3 most important counties in each state and the daily cases per 1mm residents. These are measures of case velocity. That is, by looking at daily cases per 1mm residents, at a certain level, the spread is so fast that we expect residents to panic. In NYC, this reaches ~800 daily cases per day and that is when NYC peaked. And it was that level of spread that also changed the behavior of NYC.
– WI, ND, SD and IL are at these levels
– But these daily charts seem to show cases are still surging
Once these begin to roll over, we can get a better sense that overall US cases could be peaking.
Source: Johns Hopkins and Fundstrat
Overall case prevalence is astonishingly high in these key WIINSU counties…
But the other metric to watch is case prevalence, measured as cumulative cases per 1mm. NYC is at 25,000 per 1mm.
– at 25,000 per 1mm, this is a confirmed case rate of 2.5%
– assuming infection is 10X confirmed cases, this means NYC prevalence is 25%
Look at the prevalence levels in these counties.
– Bismarck, ND is at 75,000 per 1mm, or confirmed case rate of 7.5%. Does 75% of the county have COVID?
Take a look at these charts below. It is remarkable. And the takeaway for me, is there are a lot of cases but not a whole lot of dying.
Source: Johns Hopkins and Fundstrat
Source: Johns Hopkins and Fundstrat
Source: Johns Hopkins and Fundstrat
Source: Johns Hopkins and Fundstrat
Source: Johns Hopkins and Fundstrat
Source: Johns Hopkins and Fundstrat
POINT 3: As COVID-19 fades from the Southern hemisphere, is this a seasonal thing?
Is COVID-19 seasonal? Surging in Western World and fading from Southern Hemisphere
Somewhat lost in the discussion around COVID-19 has been the movement of the COVID-19 hotspot — the region in the World where COVID-19 has seen the biggest outbreak. A simple summary would be:
Northern Southern
hemisphere hemisphere
Jan-Feb Asia
March Europe
April-May USA
May-July Latin America
Aug-Sep India/Pakistan
Early Oct Europe
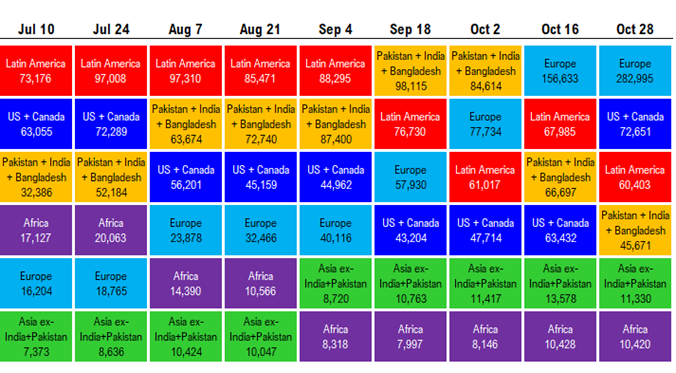
So COVID-19 has shifted back to the Western world with USA and Europe now the region with the greatest number of cases. Take a look at the quilt below, the prior hotspots are seeing a collapse in cases:
– Latin America 60,000 daily cases vs ~100,000 in August
– India+ 45,000 daily cases vs ~100,000 in September
Is this a seasonal pattern? The season is turning into the Summer/warm months in those regions.
Source: Johns Hopkins and Fundstrat
Europe and USA are the new “global hotspot” — but one has gone parabolic and the other linear…
The new hotspot is Europe and USA again. This comes as both regions are entering the flu season. There are many reasons flu season increases the risk of disease:
– cold weather = weaker immune system
– colder temps = more indoor time
– more indoor time = greater density + viral load
– winter less sun = less Vitamin D
But these are just guesses. I don’t know exactly why COVID-19 is moving around the World seasonally. Curiously, the path of COVID-19 cases in Europe and US is completely different. Notice how Europe has gone absolutely parabolic while US cases are rising, but in a much more linear manner. To simplify, COVID-19 cases:
– Europe parabolic since 10/1/2020
– USA linear since 10/1/2020
Europe has been in a parabolic surge in cases for the past 28 days. In that same period of time, the US has been in a linear, but a painful rise in cases.
Source: Johns Hopkins and Fundstrat
In March 2020, the lag between Europe parabolic surge and USA surge was 8 days…For those fearful that the US is a sitting duck and will soon see a parabolic surge. There have been some notable differences between this breakout between the US and Europe. Most notably:
– Europe wave 2 is playing out as a far more aggressive spread in the same cities hit in wave 1.
– US wave 3 is taking place in areas of the US that were unscathed in prior waves.
This is the big difference.
Source: Johns Hopkins and Fundstrat
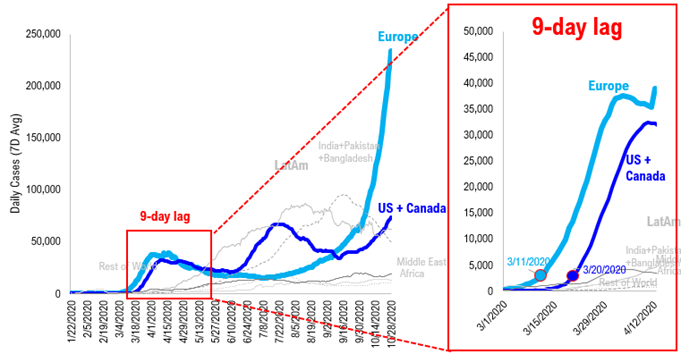
Is Europe a prelude to USA? In March 2020, the lag between Europe parabolic surge and USA surge was 9 days…
Naturally, someone recalling March 2020, sees the Europe surge as a prelude to havoc coming to the US. In fact, many experts have been warning about this. But let’s look at the lag between the two regions:
– Europe hit 3,000 cases on 3/11/2020
– USA hit 3,000 cases on 3/20/2020
– both regions saw a parabolic surge after 3,000 cases
– 9 day lag between Europe and USA
So the Spring wave saw a 9-day lag between the Europe outbreak and USA surge. Europe’s wave 2 cases have gone parabolic since 10/1/2020. This has been 28 days and the US is still seeing only linear, not parabolic growth.
– So this pattern has already broken from the Spring wave 1.

Source: Johns Hopkins and Fundstrat
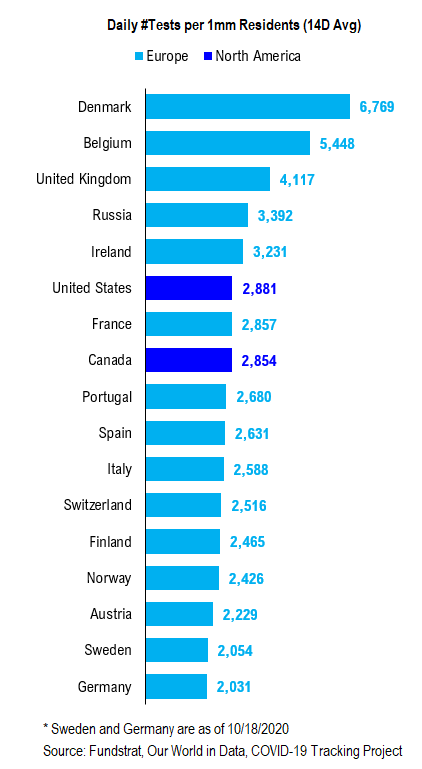
European testing per capita is similar to USA
One might wonder if testing is the difference between Europe and USA outbreak. We have shown daily testing per capita of European nations vs USA. As shown below, the per capita testing levels (per 1mm) is similar to the US. In fact, UK is quite a bit higher