COVID-19 UPDATE: For the past 4 days, 7D delta in daily cases negative, affirming Wave 3 rolling over, for now...We should not view 2020 pre-pandemic highs as the ceiling for Epicenter stocks.

Click HERE to access the FSInsight COVID-19 Daily Chartbook.
STRATEGY: Strong year likely to see a strong finish…
We are now in the final month of 2020 and the first 11 months are best characterized, in my view, as vastly outperforming expectations. Despite a global pandemic and economic depression, equities have been surprisingly resilient.
– We don’t see how stocks suddenly weaken in this final month.
– Granted, the risk is that this is a consensus view, but we are in a seasonally strong period for equities
– Hence, we see the S&P 500 ending the year at 3,800, or roughly 4.5% upside from current levels.
Don’t view 2020 highs as the “absolute max” for Epicenter stocks, since their P/E can expand substantially…We think most investors are skeptical of the rally in Epicenter stocks. In fact, we have noted many pointing to the fact that many of these are within 20% of the 2020 pre-COVID highs as a reason to avoid them.
But this exposes a flaw in the framework.
– Why should 2020 pre-COVID highs be the high for epicenter stocks?
– Given the future operating leverage, their earnings power is substantially stronger
– Equity risk premia should fall = higher P/E
– Epicenter stocks have been underperforming and de-rating for 15 years, so why is 2020 pre-COVID multiples the “peak”?
– Growth stocks are 30%-50% above the pre-COVID-19 highs
Thus, we view epicenter stocks as a good risk/reward currently. Their market capitalizations have fallen to ~27% of the S&P 500 and this group collectively, has substantial operating leverage
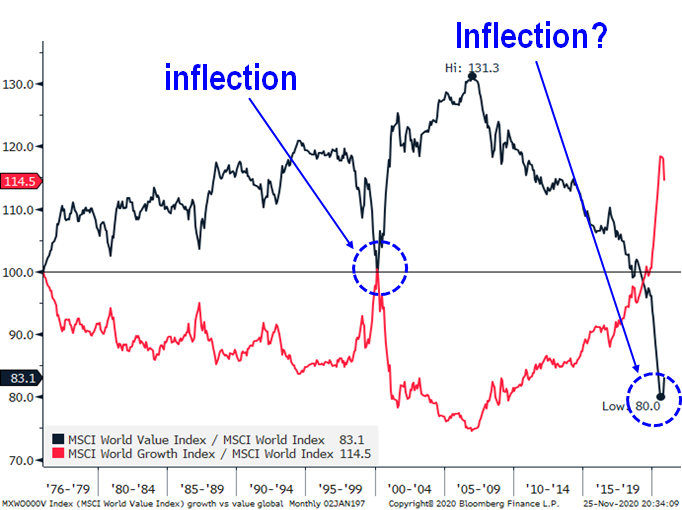
Bigger question… is this the turn? Like the 10-year turn?
The surge in epicenter stocks (aka Cyclicals aka Value) in the past few weeks has caused a noticeable “inflection” in the MSCI Growth vs Value charts (see below). The two lines represent Growth (red) and Value (blue) relative to MSCI ACWI. And as you can see, the red line is posting a pretty sharp reversal in the past month.
– the natural question is whether this is similar to the inflection seen in 1999
– at the time, that inflection led to a 10-year surge in Value stocks, outperforming Growth by ~8,000bp in that period of time
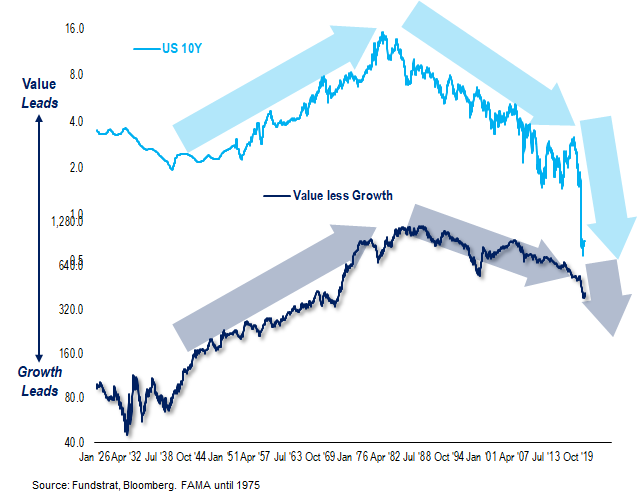
Part of the answer ultimately depends on the trajectory of interest rates. If you are in the camp that we are facing higher rates in the future, then this is indeed the inflection for Value. This chart below shows nearly 100 years of relative performance.
– when rates are rising, Value leads
– when rates are falling, Growth leads
So future rates are a key question.
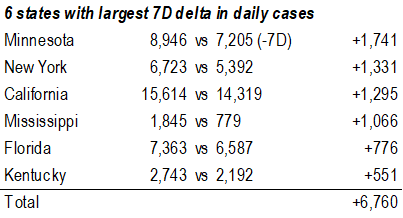
As for COVID-19 trends, it has been quite positive over the past 4-5 days. As shown below, the 7D delta in daily cases has turned negative. That is, Wave 3 is meaningfully rolling over. In fact, this is also seen in the 6 states at the heart of Wave 3, WI, IL, ID, ND, SD, UT, or WIINSU.
But we have to keep in mind, the data for the week of Thanksgiving is giving us an artificially better than expected view of COVID-19 trends. The reasons are two-fold:
– first, testing activity fell due to the holiday weekend (closures, etc.)
– second, the social gatherings over Thanksgiving likely will contribute to a renewed spread in cases
But a win is still a win. So the drop in cases is a good thing, to the extent the baseline is lower.
Source: COVID-19 Tracking and Fundstrat
ADDENDUM: We are attaching the stock lists for our 3 portfolios:
We get several requests to give the updated list for our stock portfolios. We are including the links here:
– Granny Shots –> core stocks, based on 6 thematic/tactical portfolios
– Trifecta epicenter –> based on the convergence of Quant (tireless Ken), Rauscher (Global strategy), Sluymer (Technicals)
– Biden vs Trump –> based on correlation to either candidate odds
Granny Shots:
Full stock list here –> Click here
Tickers: AAPL, AMZN, AXP, BF.B, CSCO, EBAY, GOOG, GRMN, GWW, INTC, KLAC, LEN, LOW, MNST, MSFT, MXIM, NVDA, OMC, PM, PYPL, QCOM, TSLA, XLNX
Trifecta Epicenter:
Full stock list here –> Click here
Tickers: ACM, AGCO, AN, ASB, BBY, BHF, BK, BOH, BWA, CF, CFX, CPT, CRI, CSL, DAL, DOV, DRI, EMR, EOG, F, FITB, FL, FLS, FNB, GE, GM, GPC, GPS, GRMN, HAS, HFC, HIW, HLT, HOG, HP, IBKR, IEX, JBHT, JBLU, KIM, LB, LEG, LUV, LYB, MAR, MGM, MIDD, MLM, MMM, MOS, MPC, MTG, NCLH, NEU, NNN, NOV, NUE, NVT, NWL, NYCB, OC, PB, PBCT, PHM, PII, PNFP, PNR, PSX, PXD, RCL, RS, SBNY, SBUX, SIX, SLB, SNA, SON, STL, STOR, SYF, TOL, TPX, UBER, UNP, VFC, VNO, WAB, WBS, WH, WTFC, WYND, XYL
Biden White House vs. Trump White House:
Full stock list here –> Click here
ADDENDUM II : Did you miss our Webinar on Nov 19? We had the big guns, including David Zion, of Zion’s Research
We had a great line up and discussed a lot of things between now and year-end. Here are the replay links:
– Replay –> Click here
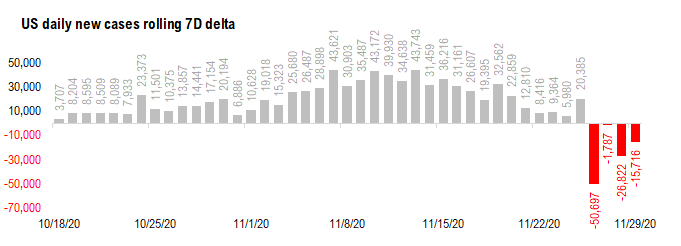
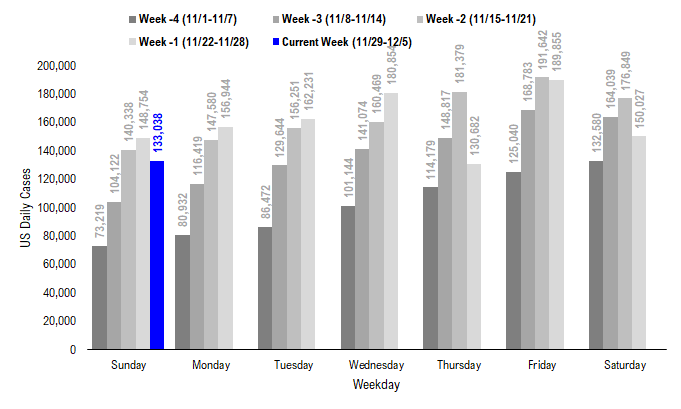
POINT 1: Wave 3 rolling over. Daily cases 133,038, -15,716 vs 7D ago
The latest COVID-19 daily cases came in at 133,038, down -15,716 vs 7D ago.
– Over the past 4 days, daily cases were lower vs 7D ago, in each of the past 4 days
– It looks like Wave 3 is definitely rolling over
– But as discussed in point #2, tests have fallen, so this is impacting case figures
Source: COVID-19 Tracking Project and Fundstrat
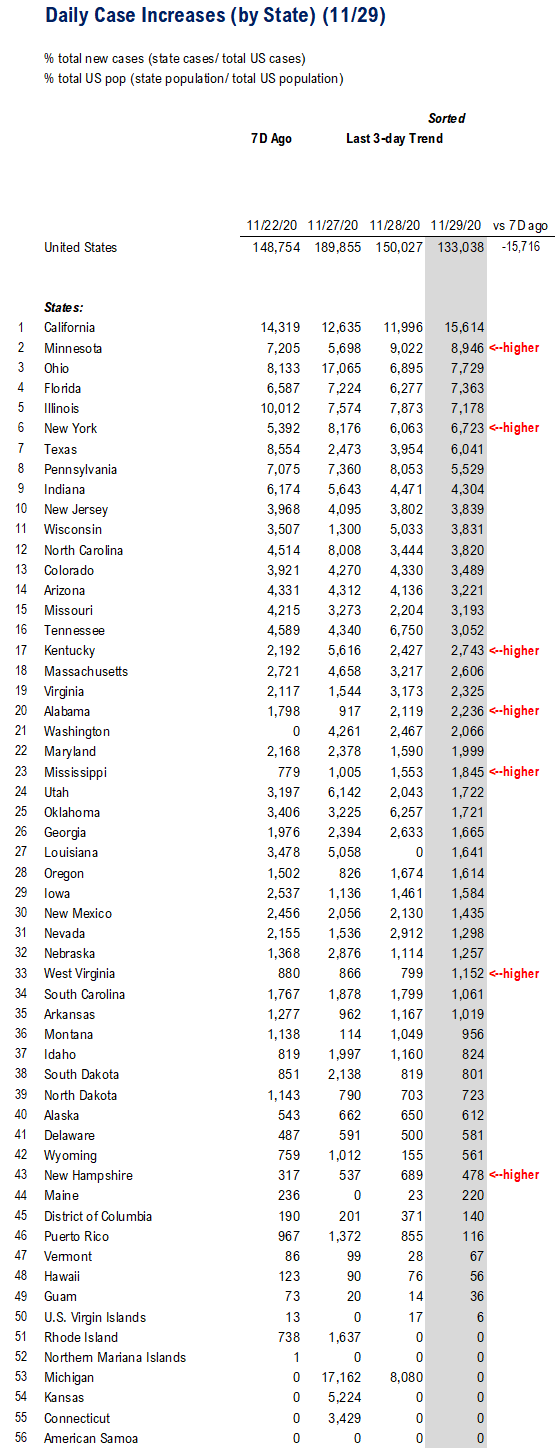
7D delta at -15,716 and cases are declining in each of the past 4 days (vs 7D ago)
Again, the daily change vs 7D ago, in our view, is the leading indicator as it is what influences the 7D moving average.

Source: COVID-19 Tracking and Fundstrat

Source: COVID-19 Tracking and Fundstrat
Source: COVID-19 Tracking and Fundstrat
POINT 2: Daily cases rolling over, but partly attributable to the holiday-week drop in tests
The data for the week of Thanksgiving is giving us an artificially better than expected view of COVID-19 trends. The reasons are two-fold:
– first, testing activity fell due to the holiday weekend (closures, etc.)
– second, the social gatherings over Thanksgiving likely will contribute to a renewed spread in cases
But a win is still a win. So the drop in cases is a good thing, to the extent the baseline is lower.
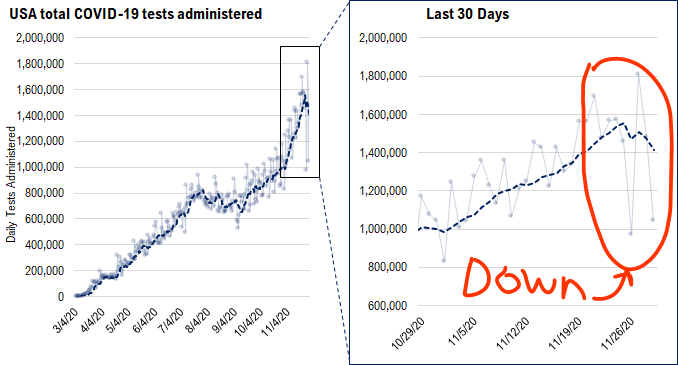
Daily tests jumped around, but notice the 7D moving average is declining…The zoomed chart on the right shows daily tests jumped around quite a bit over the past few days. But the 7D moving average highlights the extent of reduced testing.
– the 7D moving average fell to 1.4 million from ~1.6 million a week ago
– thus, one could view the decline in daily cases are mostly a result of a drop in testing
Source: COVID-19 Tracking and Fundstrat
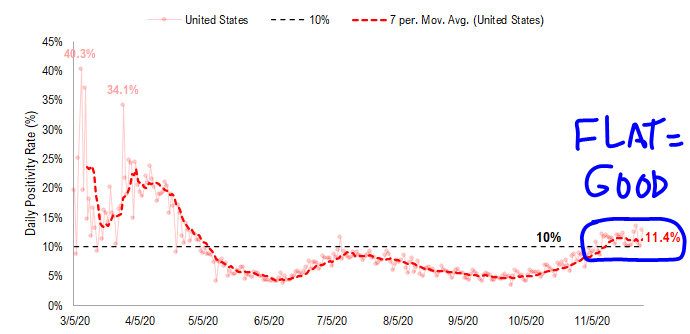
In fact, the positivity rate has been basically flat at 11.4% for the past week. 11.4% is not a great figure, and above the 10% level the WHO views as indications of an infection is under control. But the fact is not continuing to surge is a good thing.
Source: COVID-19 Tracking and Fundstrat
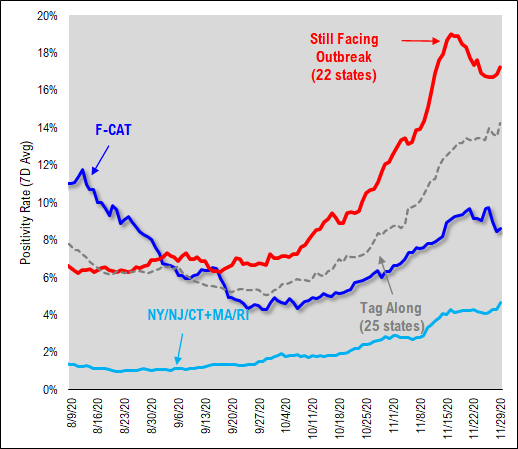
Looking at this by tiers of states, we can see the highest positivity rates are those states engulfed in Wave 3 (red line). I guess the good news is the positivity rate is declining for Wave 3 states.
Source: COVID-19 Tracking and Fundstrat
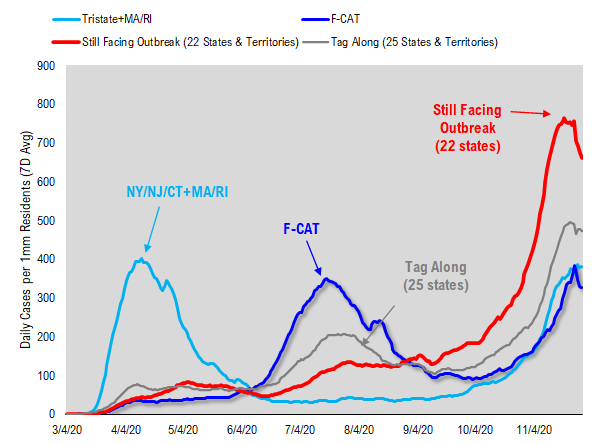
And if we look at daily cases per 1mm, we can see the broad decline in cases across all the cohorts of states. For instance:
– Wave 2 states, or FL, CA, AZ, TX are seeing cases rollover
– even Wave 3 states this rolling over
– interestingly, we continue to see daily cases rise in Wave 1 states and now surpass Wave 2
Source: COVID-19 Tracking and Fundstrat
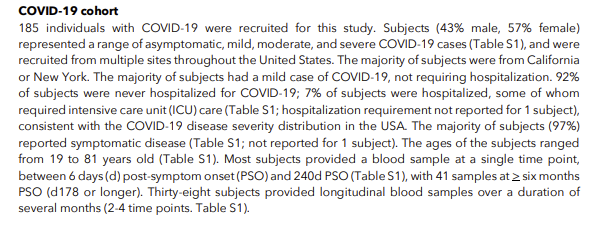
POINT 3: Another study again shows T-cell + immune memory post-COVID immunity could last years
A recent study was published on BioRxiv that again supports the idea that post-infection, T-cell immunity plus other immune memory to COVID-19 could last years. This is very good news and is substantially longer immunity than generally perceived. Even as recently as a few weeks ago, US healthcare experts warned that COVID-19 immunity might only last months and thus, we could see continued cycles of infection.
– if this study’s conclusion is indeed correct, the chances for the US to reach herd immunity is substantially greater
– that is, people are unlikely to get COVID-19 twice.
– Sure, there seem to be some documented cases, but this is the exception, not the rule
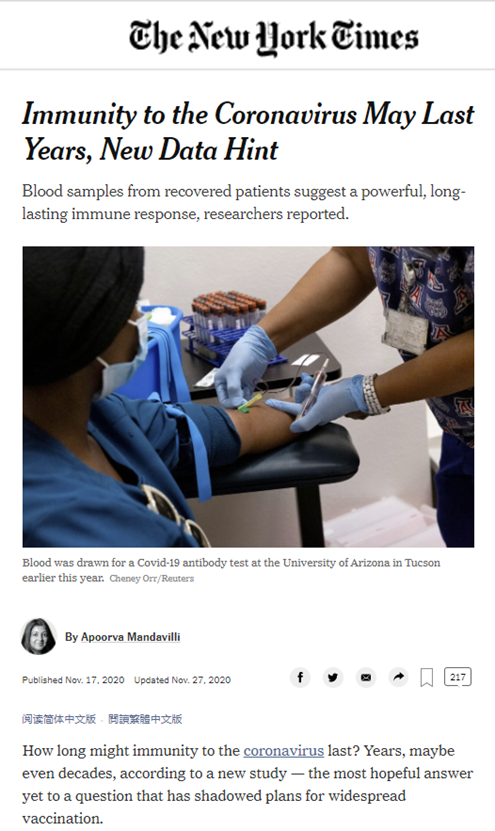
Source: NY Times
The actual BioRxiv link is below. The study itself was first published a few weeks ago, but it seems like it took some time before there was sufficient media attention to put it on people’s radar screens.

https://www.biorxiv.org/content/10.1101/2020.11.15.383323v1
The study was based upon 185 individuals. I don’t know if that is considered a large cohort, but it is a fraction of the millions infected.