

COVID-19 UPDATE: COVID-19 daily cases tracking sub-40,000 next week. Changing definition of Risk-off = now Technology + Healthcare, not the case since 2009

Click HERE to access the FSInsight COVID-19 Daily Chartbook.
We are shifting to a 4-day a week publication schedule:
- Monday
- Tuesday
- Wednesday
- SKIP THURSDAY
- Friday
STRATEGY: Risk-off now means Technology sells off, which was not the case since 2009
COVID-19 data showing steady improvement, and now it is a matter of time before more states ease restrictions…
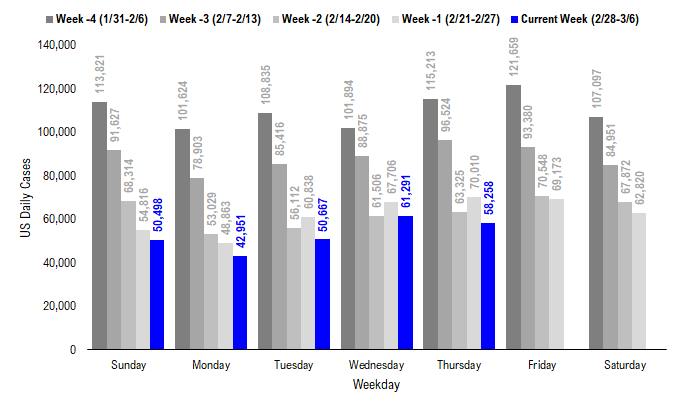
While the move by Texas to fully lift COVID-19 related restrictions is not universally popular, the fact is, more states will be following it as we move through 2021. After all, COVID-19 cases are showing consistent declines overall. Take a look at the summary of the past week:
– Daily cases 58,258 vs 70,010 7D ago, down -11,752
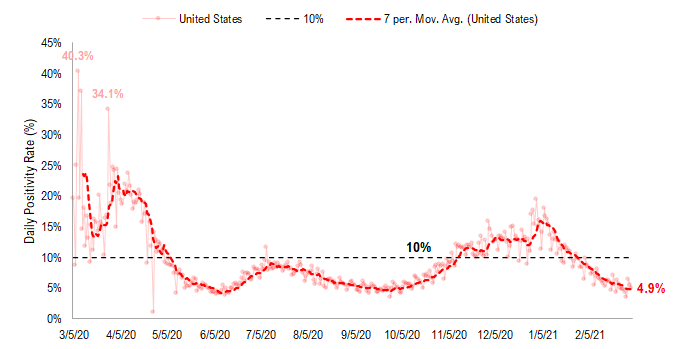
– 7D positivity rate 4.9% vs 5.5% 7D ago
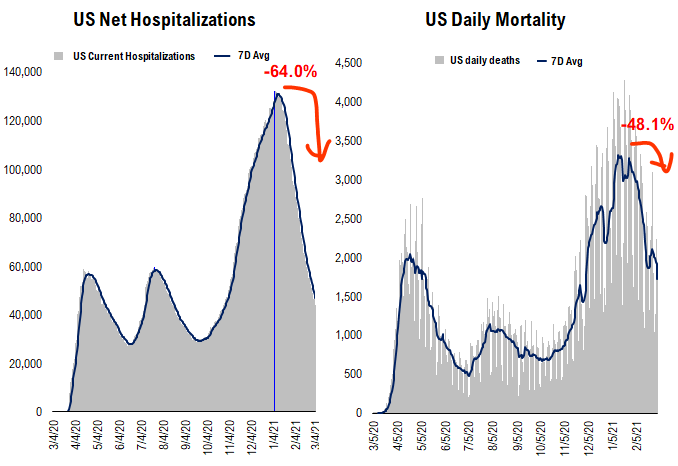
– Hospitalized patients 44,172, down -16% vs 7D ago
– Daily deaths 1,723, down -18% vs 7D ago
Vaccinations ramping steadily
– avg 2.0 million daily this past week vs 1.9 million daily last week
– overall, 8.3% have 2-doses, 16.2% 1-dose
These are all steadily improving figures. And consider that about 14 million Americans are getting vaccinated every week, 50 million per month. And with J&J soon supplying the third vaccine, these figures might jump to more than 20 million per week, or even 30 million. At that pace, we should expect to see more states lifting restrictions.
– that can only happen if daily cases continue to fall
– daily cases are falling by >10,000 vs 7D ago, so it is a pretty impressive decline now
– at this pace, we could see cases call to 30,000 by next week
– and sub-25,000 before month end

Source: COVID-19 Tracking and Fundstrat
STRATEGY: In 2021, risk-off now means sell “Growth” reversing the definition over the past 12 years…
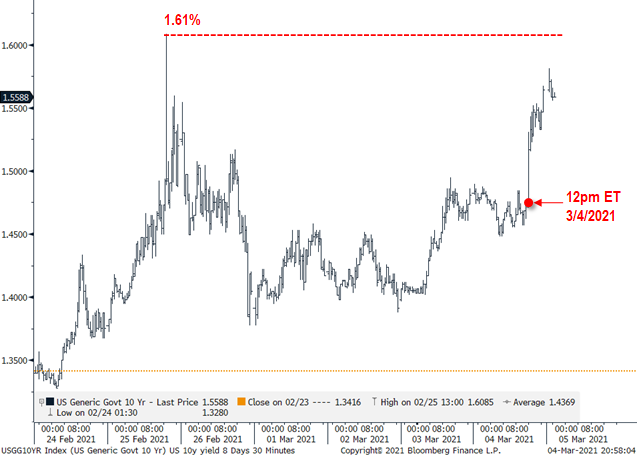
…Bond market still testing the Fed
Stocks suffered further declines yesterday as interest rates surged higher yesterday, at 12pm ET, as Fed Chair Powell was speaking at a WSJ Forum. The surge in interest rates in the past few weeks has alarmed investors, with the rise in rates reflecting a combination of rising inflation expectation (inflation breakevens showing this), stronger economic growth and the bond market pricing in Fed rate hikes sooner than policy guidance.
Speaking with several credit and macro fund managers yesterday, several mentioned that one of the nuances from Fed chair’s statements and comments was it seemed a small window is created for the Fed to be data dependent on its dovish policy stance — and this small “crack” could lead to a broader data dependent stance — and freeing rates to move higher and in some sense, allows the bond market to push the Fed in a direction.
While I did not fully appreciate the nuances in these discussions, it seems that bond managers essentially said the Fed was mis-interpreted (data dependence) but this also means the Fed could easily fix this miscommunication — in other words, there is not necessarily lasting damage. Among the potential remedies, Fed could simply clarify its stance. And if necessary take bolder steps like: (i) calendar guidance
(no hike until this date), (ii) suggest something like Operation Twist (yield curve control) or (iii) extend maturities of its programs. In short, the Fed is being tested but it is not out of policy tools.
Source: Fundstrat and Bloomberg
STRATEGY: Changing the definition of Risk-off. Now it means 3 sectors Technology, Healthcare and Discretionary (together 52% of market cap) leading downside in risk-off, no longer Cyclicals.
Whenever interest rates surge or VIX surges, we know that hedge funds reduce leverage = risk-off. But what is curious, is that “risk-off” for much of the past 12 years meant Cyclicals and “weak sectors” get sold. And Defensive sector rally. Well, since 2009, Defensive growth was essentially Technology stocks.
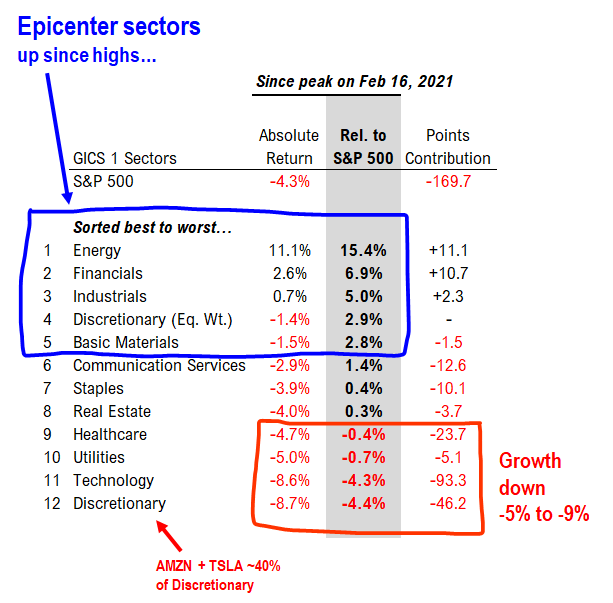
This has not been the case in 2021. Take a look at the table below, showing the relative return of sectors since Feb 16, 2021 (the S&P 500 recent high).
S&P 500 down 4.3% since 2/16
– Energy +11%
– Financials +3%
– Industrial +1%
– Technology -9%
– Discretionary -9%
– Healthcare -5%
This has become a tale of two markets, where Epicenter sectors, aka Cyclicals, are rallying. But Growth and crowded trades are down. This raises a question of whether rising rates is causing a risk-off. After all, since 2009, I am used to seeing Cyclical stocks sell off hard when risk-off happens. But it seems like it is now Growth sectors. This could mean two things:
– Growth is more sensitive to rising rates = true = hit harder by rising rates
– Investors are trying to “get out” of Growth stocks and into Cyclicals = true
In other words, the takeaway to me is that investors need to be adding to their Cyclical exposure. These have held up far better than Growth stocks in this recent correction.
Source: Fundstrat and Bloomberg
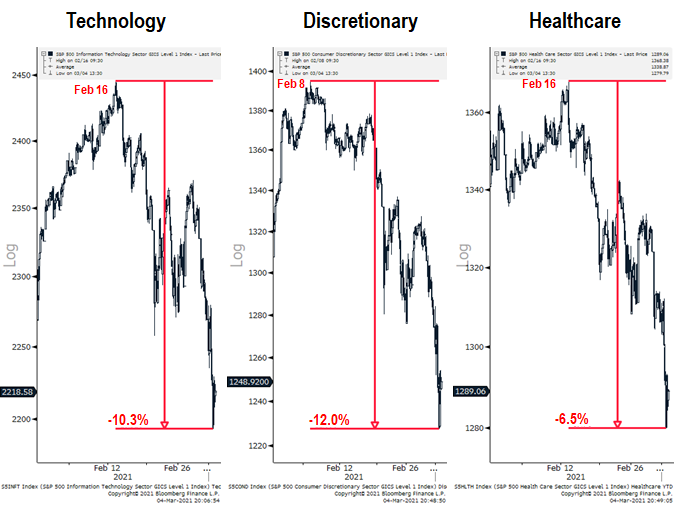
Discretionary is distorted by Amazon and Tesla, with both accounting for 40% of Discretionary market cap. Hence, Discretionary is falling for the same reasons Technology is falling — the sell-off in Growth stocks.
– since the peak, the declines are 10% to 12% (the above table is based only on closing prices)
Source: Fundstrat and Bloomberg
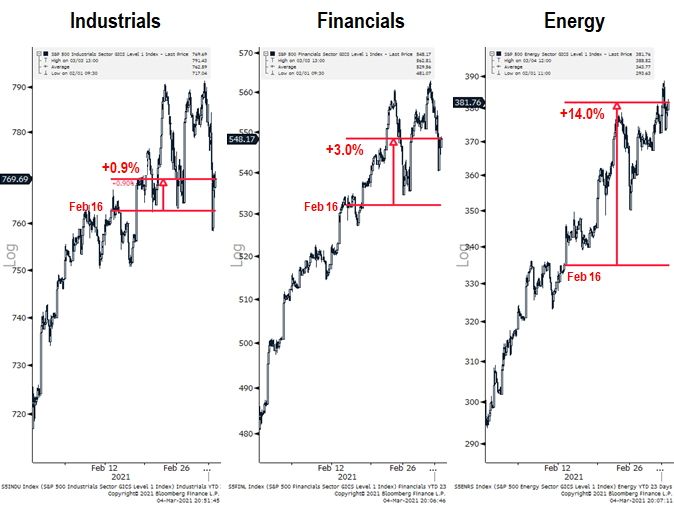
Epicenter stocks have actually risen since 2/16/2021 (S&P 500 peak)
And below, you can see the contrasting returns posted by Epicenter sectors. Again, the standout is Energy, which is up 14% since 2/16/2021. The fundamental and supply/demand outlook for Energy has become favorable in 2021, with oil prices showing considerable upside support. So we do not see any reason these sectors will not continue to be steady.
Source: Fundstrat and Bloomberg
STRATEGY: 7 reasons stocks are “buy the dip” even as the bond market is on “edge” …
We get the February jobs report on Friday. And given the sensitivity of markets to higher interest rates, markets would prefer economic miss to the downside — bad economic data reduces the risk of inflationary pressures. And bad data means Fed has more reasons to stay dovish.
But the larger story arc, in our view, is that equities have multiple positive supports and this constructive backdrop will likely dominate in 2021. More specifically, we see 7 positive supports for stocks in the near-term:
1. Washington is moving forward with passing a large fiscal relief package, and Treasury Sec. Yellen has made a forceful case for it
2. Fed has been vocal in policy stance (last week’s minutes affirmed) and Fed is patient
3. US economy is re-opening and economic momentum is strong — so strong, JPMorgan’s Chief Economist, Bruce Kasman, says US V-shape recovery will soon surpass China. Wow.
4. There remains a substantial perception gap between policymakers/media and COVID-19 realized data, and a closing of this gap is positive for risk assets.
5. Millennials are steadily allocating assets toward equities, and the surge in retail brokerage account openings is evidence of this.
6. Bonds are becoming less attractive total return vehicles as inflationary expectation are increasing, boosting the attractiveness of equities
7. VIX should ultimately steadily decline in 2021, and as we pointed out in our 2021 Outlook, periods of declining volatility historically lead to big equity gains, particularly for cyclicals.
STRATEGY: 25 “Power Epicenter Trifecta” stock ideas(*)
We are introducing a “Power Epicenter Trifecta” stock list. This is designed to identify the strongest stocks within our “Trifecta” epicenter stock list. We essentially added a “power” rating to the stocks in the trifecta list to find stocks with the strongest price appreciation potential. Thus, the criteria for the “Power Epicenter Trifecta” is:
Positive views (i) Quant (tireless Ken),
(ii) Global Portfolio Strategy (Brian Rauscher, aka Rocky) and
(iii) Technicals.
Plus strong “power” rating:
(i) trailing 1M return > 12M return
(ii) outperformed S&P 500 past 6M
(iii) price > 20D MAVG
(iv) price > 50D MAVG
Consumer Discretionary:
RL, NCLH, RCL
Financials:
PBCT, NYCB
Industrials:
NVT, DAL, KEX
Energy:
XOM, HP, NOV, SLB, COP, EOG, MRO, MUR, HFC, PSX
Real Estate:
BXP, HIW, UDR, KIM, WRI, VNO, JBGS
(*) the 25 “Power Epicenter Trifecta” stock ideas are the subset of the original 121 “Epicenter Trifecta” stock list. For the full list of our original “Epicenter Trifecta” stock list, please click the link below. Please note that the stocks rated OW on this list meet the requirements of our investment theme as of the publication date. We do not monitor this list day by day. A stock taken off this list means it no longer meets our investment criteria, but not necessarily that it is neutral rated or should be sold. Please consult your financial advisor to discuss your risk tolerance and other factors that characterize your unique investment profile.
For the full list of the 121 “Epicenter Trifecta” stock ideas, please Click Here.
ADDENDUM: We are attaching the stock lists for our 3 portfolios:
We get several requests to give the updated list for our stock portfolios. We are including the links here:
– Granny Shots –> core stocks, based on 6 thematic/tactical portfolios
– Trifecta epicenter –> based on the convergence of Quant (tireless Ken), Rauscher (Global strategy), Technicals
– Violence in USA –> companies that are involved in some aspect of home or personal security. We are not “recommending” these stocks, but rather, bringing these stocks to your attention.
Granny Shots:
Full stock list here –> Click here
Tickers: AAPL, CSCO, INTC, MXIM, NVDA, EBAY, KLAC, GRMN, GOOG, MNST, MSFT, AMZN, QCOM, TSLA, PYPL, AXP, BF/B, PM, XLNX, TGT, PG, XOM, VLO, GL, RF, ATVI, BBY, GE, AMAT, LRCX, MU, HPQ
Trifecta Epicenter (*):
Full stock list here –> Click here
Tickers: AN, GM, F, GRMN, LEG, TPX, TOL, NWL, MAT, PII, RL, MGM, HLT, MAR, NCLH, RCL, WH, TNL, SIX, DRI, SBUX, FL, GPS, KSS, LB, VFC, FITB, WTFC, ASB, BOH, FHN, FNB, PB, PBCT, RF, STL, TFC, WBS, PNFP, PACW, SBNY, NYCB, MTG, EVR, GS, IBKR, VIRT, BK, STT, SYF, BHF, AGCO, OC, ACM, WAB, EMR, GNRC, NVT, CSL, GE, IEX, PNR, CFX, DOV, MIDD, SNA, XYL, FLS, EAF, TTC, ITT, ALK, DAL, JBLU, LUV, MIC, KEX, UNP, JBHT, R, UBER, UHAL, LSTR, MAN, XOM, HP, BKR, HAL, NOV, SLB, COP, EOG, FANG, HES, MRO, MUR, PXD, XEC, HFC, MPC, PSX, LYB, EXP, MLM, CF, MOS, ESI, NEU, NUE, RS, SON, IP, BXP, HIW, UDR, KIM, NNN, WRI, VNO, JBGS, RYN
Violence in USA:
Full stock list here –> Click here
(*) Please note that the stocks rated OW on this list meet the requirements of our investment theme as of the publication date. We do not monitor this list day by day. A stock taken off this list means it no longer meets our investment criteria, but not necessarily that it is neutral rated or should be sold. Please consult your financial advisor to discuss your risk tolerance and other factors that characterize your unique investment profile.
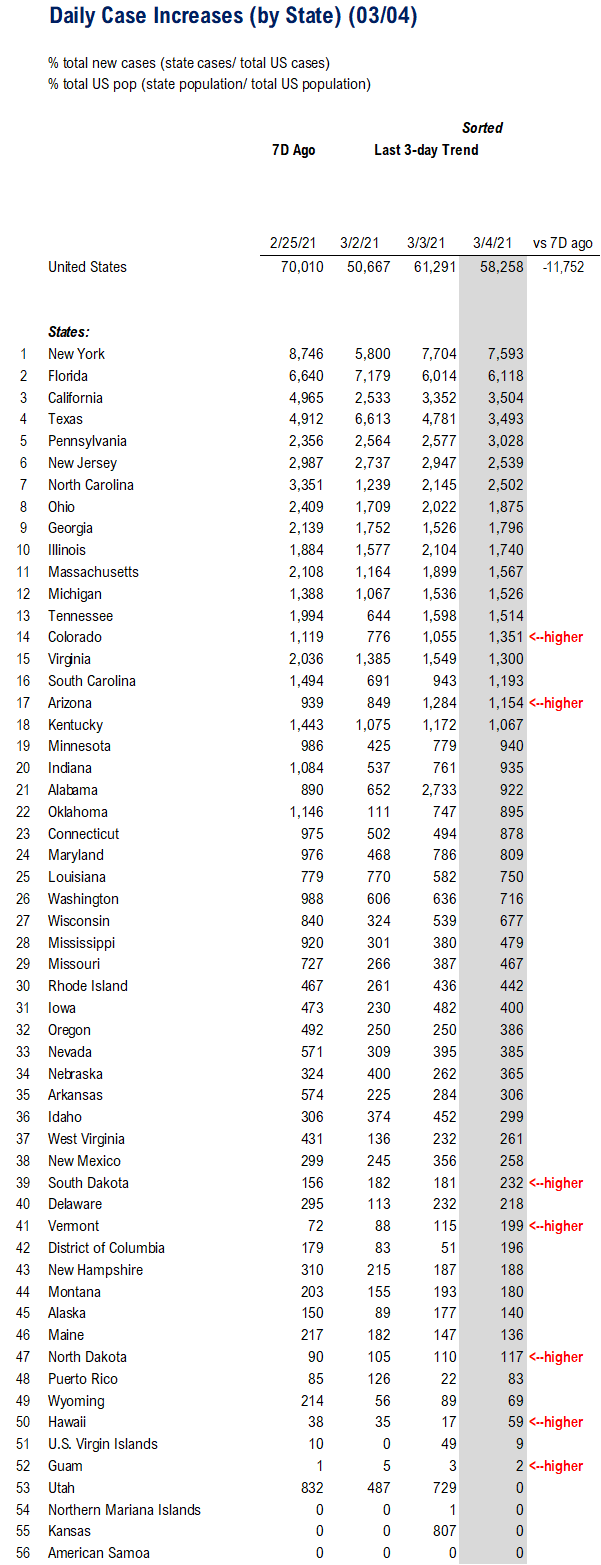
POINT 1: Daily COVID-19 cases 58,258, -11,752 vs 7D ago…
_____________________________
Current Trends — COVID-19 cases:
– Daily cases 58,258 vs 70,010 7D ago, down -11,752
– 7D positivity rate 4.9% vs 5.5% 7D ago
– Hospitalized patients 44,172, down -16% vs 7D ago
– Daily deaths 1,723, down -18% vs 7D ago
_____________________________
– The latest COVID-19 daily cases came in at 58,258, down -11,752 vs 7D ago.
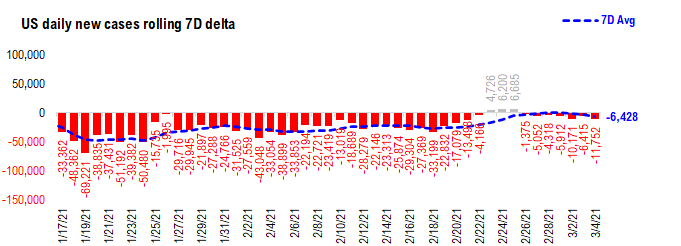
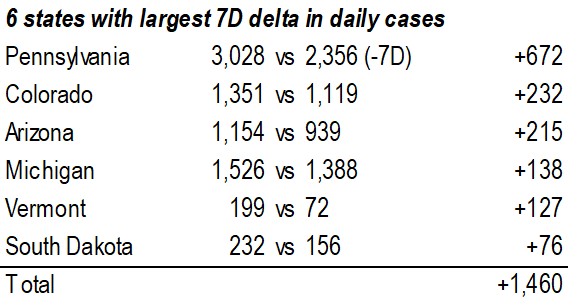
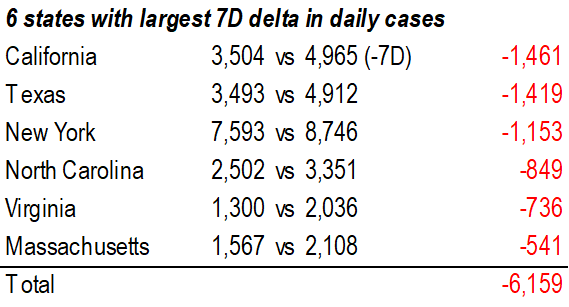
– After being positive for three days last week, the 7D delta in daily cases has turned negative again. This shows the rise in daily cases last week could just be the results of the distortion of test/case data due to the cold snap.
– The 7D delta in daily cases now is accelerating to the downside, and US COVID-19 cases are on the track for sub-40,000 later this week or early next week.
Source: COVID-19 Tracking Project and Fundstrat
7D delta in daily cases turns negative for 7 consecutive days and accelerates to the downside…
After being positive for three days last week, the 7D delta in daily cases has turned negative again. This is good news – it shows the rise in daily cases last week could just be the results of the distortion of test/case data due to the cold snap, and the daily cases in the US are still falling.
Source: COVID-19 Tracking and Fundstrat
US hospitalization still rolling over … and even US deaths seem to be rolling over…
Below we show the aggregate patients who are currently hospitalized due to COVID. It has fallen significantly from the wave 3 peak.
Source: COVID Tracking Project and Fundstrat
Source: COVID Tracking Project and Fundstrat
Source: COVID-19 Tracking and Fundstrat
Source: COVID-19 Tracking and Fundstrat
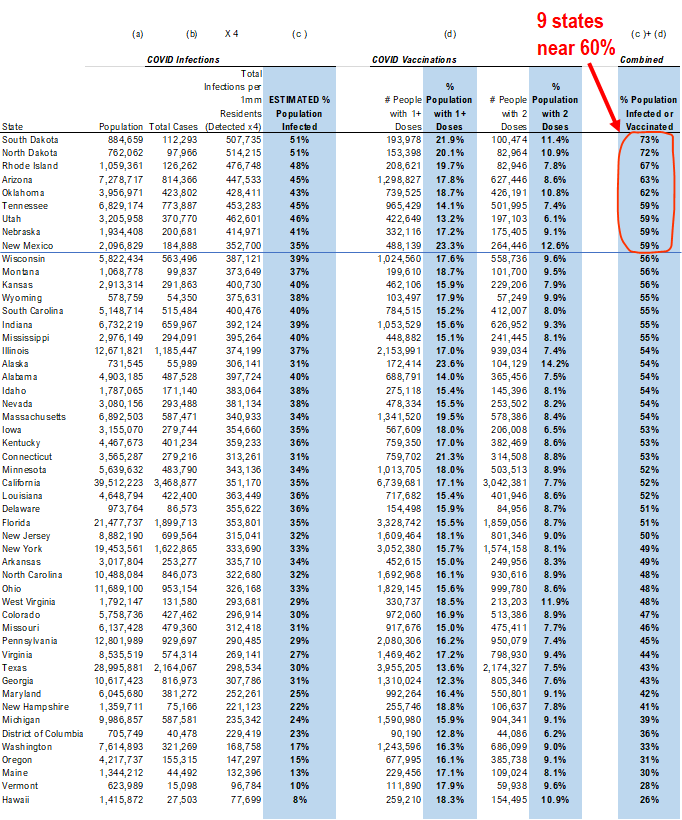
POINT 2: VACCINE: 9 states (+2 vs Friday) near ~60% infected + vaccinated
_____________________________
Current Trends — Vaccinations:
Vaccinations ramping steadily
– avg 2.0 million this past week vs 1.9 million last week
– overall, 8.3% have 2-doses, 16.2% 1-dose
_____________________________
Vaccination frontier update –> 9 states > 60% combined penetration (vaccines + infections)
Below we sorted the states by the combined penetration (vaccinations + infections). As we commented in the past, the key figure is the combined value >60%, which is presumably near herd immunity. That is, the combined value of infections + vaccinations as % population > 60%.
– Currently, ND + SD + RI + AZ + OK + UT + TN + NM + NE are basically all at this level
– So slowly, the US is getting to that threshold of presumable herd immunity
Source: CDC, COVID Tracking Project and Fundstrat
There was a total of 1,691,492 doses administered on Thursday, slightly down from 1,804,667 doses 7D ago. However, the pace overall is steadily rising, as evidenced by the 7D moving average (see blue line).
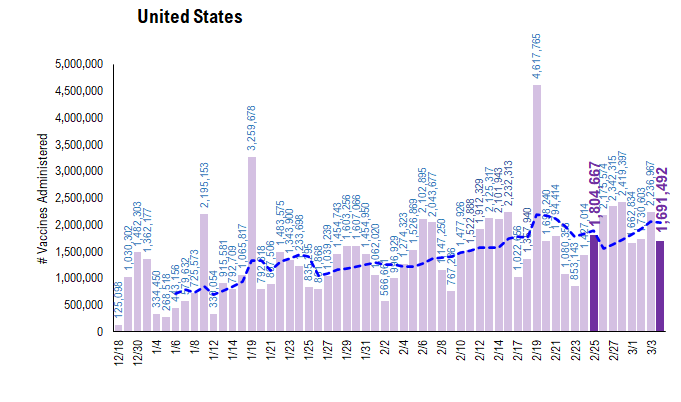
Source: CDC, COVID-19 Tracking Project and Fundstrat
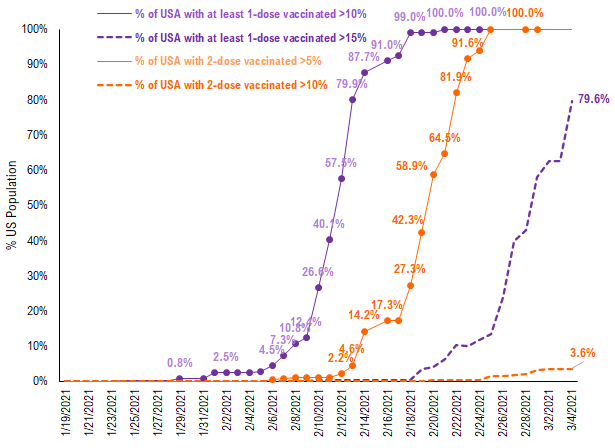
~80% of the US has seen 1-dose penetration >15%… still not wide geography
To better illustrate the actual footprint of the US vaccination effort, we have a time series showing the percent of the US with 2-doses covering at least 5% (and 10%) of its residents, displayed as the orange line on the chart. Currently, all US states have seen 5% of their residents with 2-doses administered. However, when looking at the percentage of the US with 2-doses covering at least 10% of its residents, this figure is only 3.6%.
– While all US states have seen vaccine penetration >10%, 80% of them have seen 1 dose penetration >15%.
– All of the US has at least 5% of its residents with the full 2 doses, However, only 3.6% of US has 2-dose vaccinated >10%
– This is still a small figure (5%/10% of residents with 2 doses) but this figure is rising sharply now
– the takeaway is the vaccination efforts are unlikely to be having much of an effect on case figures, currently
Source: CDC, COVID-19 Tracking Project and Fundstrat
This is the state by state data below, showing information for states with one dose and for those with two doses.
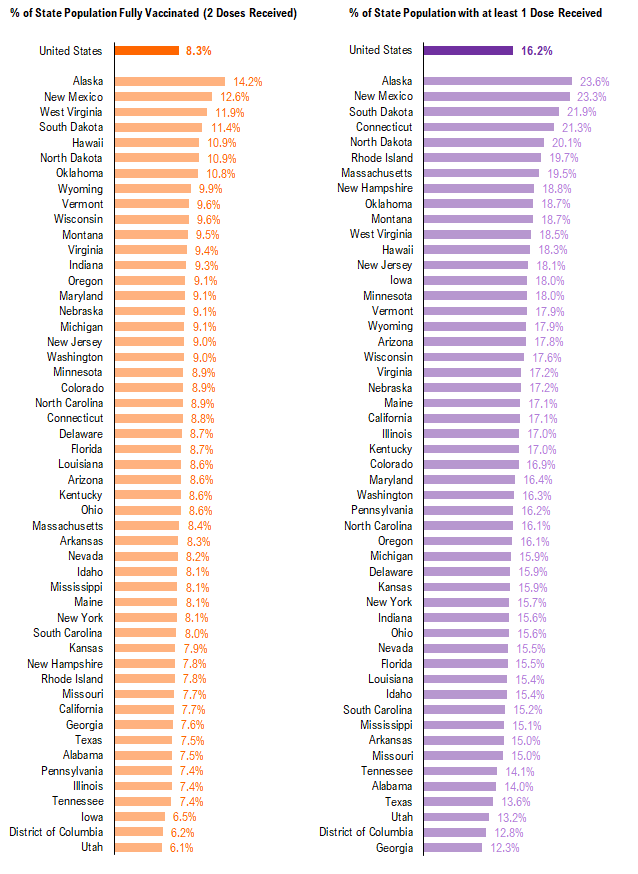
Source: CDC, COVID-19 Tracking Project and Fundstrat
The ratio of vaccinations/ daily confirmed cases is generally trending higher (red line is 7D moving avg) and this is the most encouraging statistic.
– the 7D moving average is about ~30 for the past few days
– this means 30 vaccines dosed for every 1 confirmed case
This figure is rising nicely and likely surges in the coming weeks
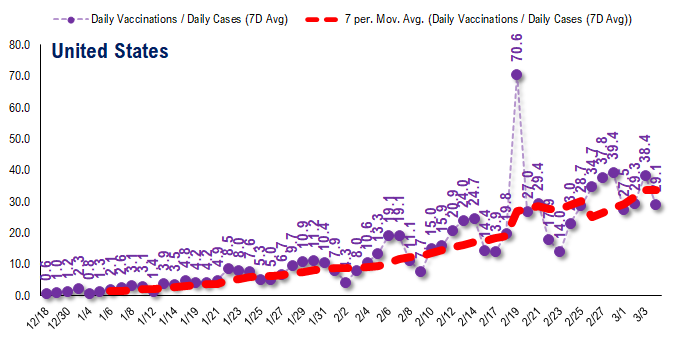
Source: CDC, COVID-19 Tracking Project and Fundstrat
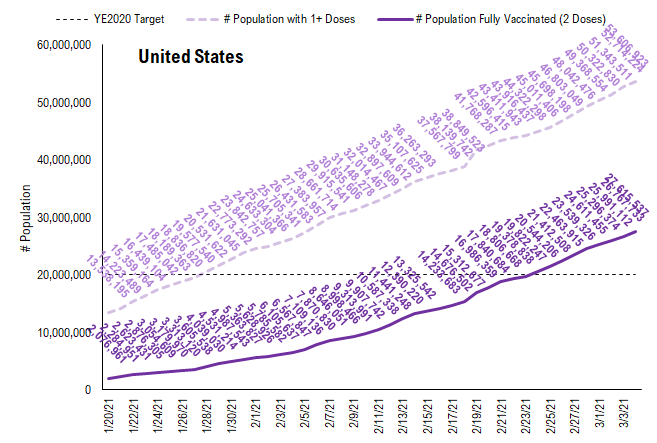
In total, about 54 million Americans have received at least 1 dose of a vaccine. This is a good pace and as we noted previously, implies 30% of the population by April.
Source: CDC and Fundstrat

