

VIX surges but high-yield rises --> HY > VIX --> everything YE rally intact

Click HERE to access the FSInsight COVID-19 Daily Chartbook.
We publish on a 4-day a week schedule:
Monday
Tuesday
Wednesday
SKIP THURSDAY
SKIP Friday
STRATEGY: VIX surges but high-yield rises –> HY > VIX –> everything YE rally intact
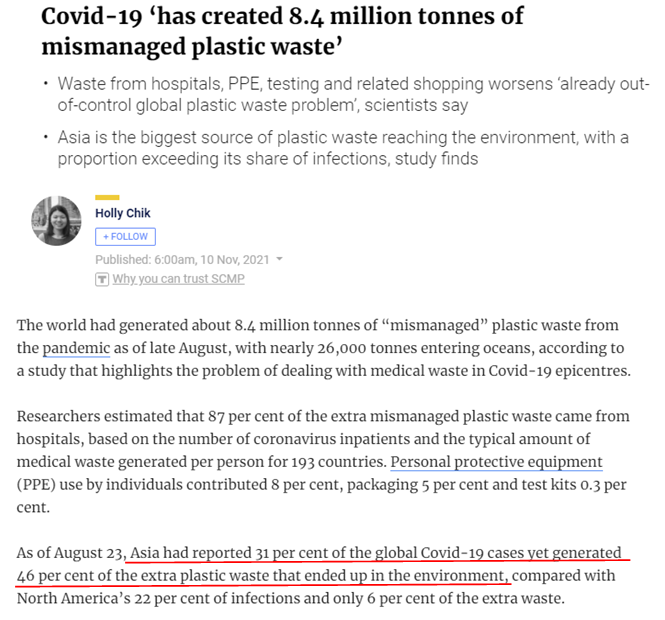
WOKE DILEMMA: Covid-19 has created 8.4 million tons of excess plastic waste
We all know that mitigation measures in COVID-19, particularly around infected and preventing infection, has created complex processes and usage of PPE (personal protection equipment). But this article below highlights the cumulative environment waster created by these measures:
– a study by UCDS in CA shows that COVID-19 created tons of excess plastic waste
– 8.4 million tons by their estimate
– Asia accounted for nearly half (46%) of the waste, but only 31% of cases
– Hospitals accounted for 84% of the waste
– arguably, the goal of “zero cases” created enormous waste
– This is the reason endemic > pandemic
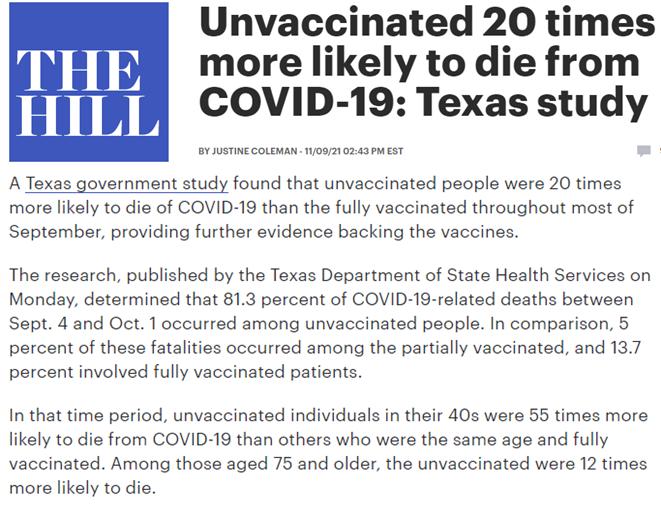
VACCINATIONS: Texas study shows “unvaxxed” 20X more likely to die from COVID-19
A considerable number of our clients disagreed with our view that the Pfizer pill would obviate the need for vaccination. That is:
– many believe the baseline remains a population needs a high level of vaccine penetration
– therapeutics are used to treat the “breakthroughs”
– but given the sizable anti-vax cohort, both left and right, we think therapeutics will obviate this case
Still, the rationale for vaccination is high, for most adults. This Texas TDSHS study shows a stark fact:
– unvaccinated Texans are 20X more likely to die from COVID-19 versus vaccinated
– this is a strong rationale to be vaccinated
– however, the Pfizer pill likely reduces the risk of death by 10X
– thus, vax or pill remains a point of contention
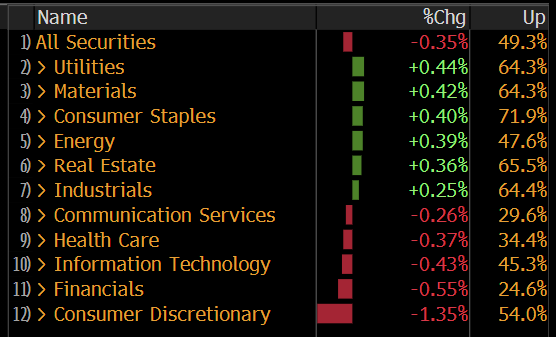
STRATEGY: Equities “gut punched’ Tuesday: VIX surges but credit rallies = credit > VIX = everything YE rally intact
Equities got gut punched Tuesday. All the major indices saw widespread losses, nearing 1%.
– 6 of the 11 sectors rose Tuesday
– Epicenter mostly rallied with Materials, Consumer Staples, Energy, Industrials
– Only Financials fell
– see below
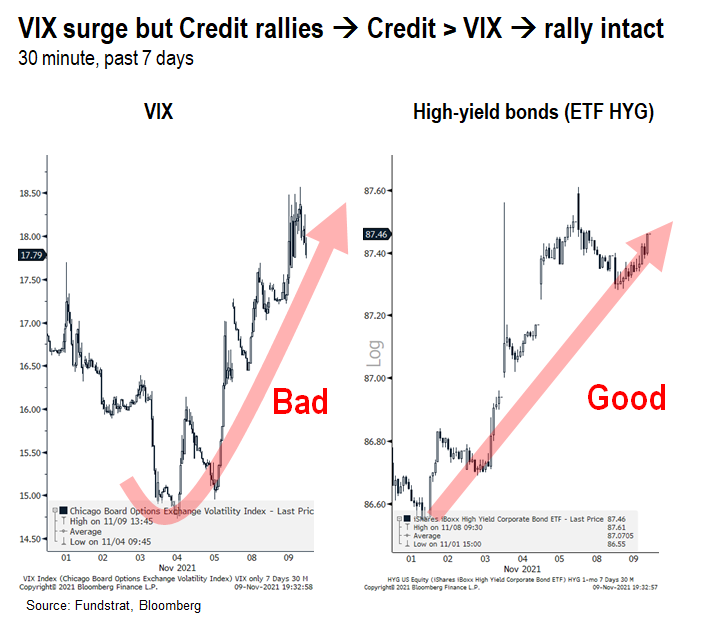
VIX surges = bad, but High-yield rallies = good –> HY > VIX
As we mentioned Monday, the VIX surge > 20% and rose another 10% Tuesday. Given the fall in equity markets, this obviously is hard to “spin positively.” But take a look at the chart below:
– high-yield bonds rallied Tuesday
– high-yield bonds rallied strongly in the past 4 days (see right chart)
– high-yield rally generally leads equities
Thus, we do not view the VIX surge as necessarily negative. For instance, one could view this as investors simply hedging:
– S&P 500 is at an all-time high
– VIX was at a nearly a multi-year low = protection is cheap
– buying VIX might be a good hedge
USA + INDIA > REST OF WORLD
We have compiled relative performance of equity markets by country/region. And a simple glance makes something evident:
– YTD, only 2 regions have seen pronounced outperformance
– India and USA
– possibly Canada too (to a lesser extent)
There is not a common thread to explain why both the USA and India have outperformed.
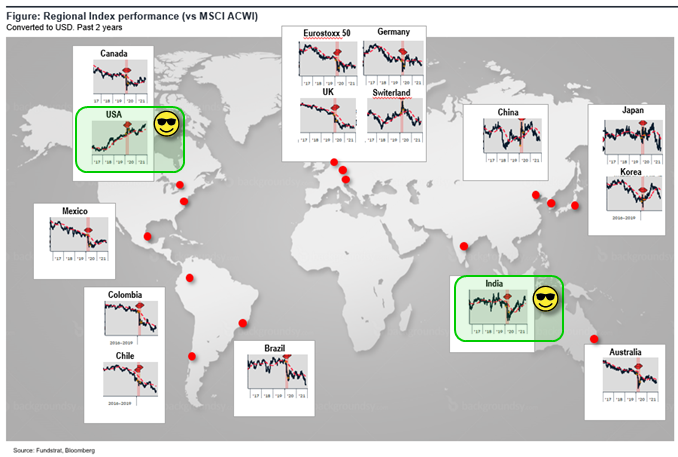
Mark Mobius, a well known emerging markets investor, believes India is about to see “takeoff stage” and as he alludes to in this interview, he sees India similar to China a decade ago. Thus, a decade of potential dynamic growth and outperformance.

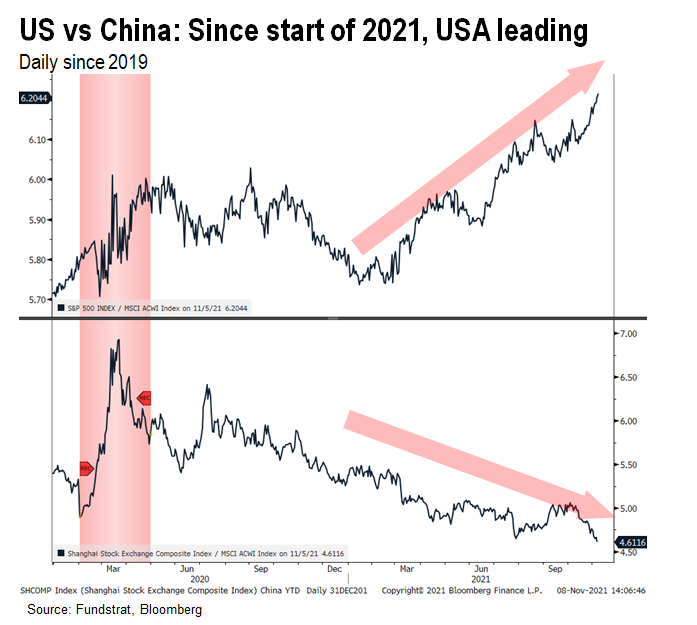
USA and China have moved in opposite directions in 2021…
The more notable divergence, in our view, is the sizable outperformance of the US equity market relative to China:
– China has managed COVID-19 better than the US (in total cases, etc)
– China GDP moved above pre-pandemic 2019 levels well ahead of the US
So why is China underperforming so drastically in 2021?
Is this because the US handling of COVID-19 is now seen by markets are superior to China?
Perhaps the simplest explanation is the US economy is actually closer to returning to normalization. Why? There are two simple reasons:
– US is closer alignment than China to treating COVID-19 as an endemic
– China is still pursuing “zero case” strategy
– US has essentially lifted all restrictions to inbound travel
– China remains largely closed
There is a NY Times article below, which highlights the growing frustration by many Chinese nationals with the policy of full COVID-19 elimination. This often results in mass quarantines, separation of children from parents and severe restrictions for those complying. And a resulting economic hardship.

And as of Monday, the US has essentially fully re-opened its borders to inbound international travelers. As this Straits Times article notes, there have been massive inbound travel to the US in response to these eased restrictions. And by contrast, China has largely kept its borders closed.
– so this divergence in relative equity market performance might simply reflect financial markets viewing the US approach as better for the economy

MEAN REVERSION? with the Pfizer pill and easing supply constraints, should this boost China and EM? Not necessarily
Looking forward, it would be natural to think that there should be a mean-reversion. That is, things that have been headwinds for China in the past year might ease:
– COVID-19 treatment options expand with the Pfizer pill, reducing rationale for vaccinating to reach something akin to “herd immunity”
– Supply chain constraints ease, boosting potentially China GDP, which is more export driven
– Investors might re-allocate to EM given the strong relative performance of USA vs rest of world
These are all valid reasons, in our view, to expect China and EM to strengthen. But as we discuss below, these factors may not be determine the relative performance of USA vs China.
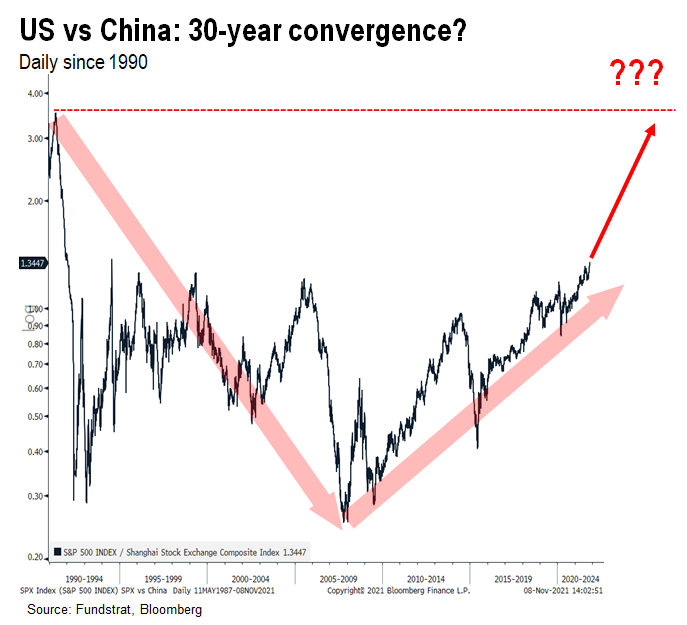
Foremost, is USA outperformance actually a 30-year convergence?
Below is a chart showing the price ratio of USA vs China’s Shanghai Composite since 1990. And is it as simple as as the US equity market mean reverting relative to China:
– China outperformed from 1990 to 2008, or 18 years
– Is next 18 years, 2008 to 2026, the US simply mean-reverting?
This is possible but it is simply an observation.
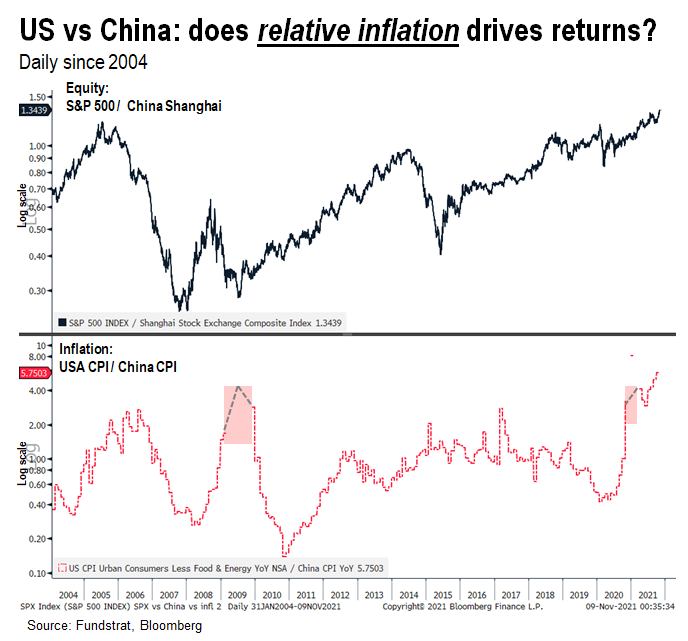
“Relative inflation” has widened in US (higher than China) and it seems to partially explain US outperformance
The chart below is somewhat counterintuitive and not entirely that obvious.
– the top chart is USA vs China equity market ratio (similar to above)
– lower chart is USA CPI YoY divided by China CPI YoY
– But the y-axis is “log scale” and thus, negative plots are omitted
– A negative plot would result in USA or China, but not both, having negative CPI YoY
– This happened to China a few times, but not the US
But notice something interesting? Whenever USA inflation strengthens vs China, this seems to coincide with USA equity outperformance.
– the mechanism is not entirely clear to me
– but it potentially highlights how :”inflationary” developments are a positive relative signal
– this is counter to consensus thinking
Consensus, as we are aware, tends to view inflation with alarm and as a factor to de-rate a market. The reason we don’t entirely agree with the consensus view, however, is that the counter is not true:
– investors don’t re-rate higher, nations with deflation
– right?
– Japan and Europe essentially have deflation
– those markets are de-rating
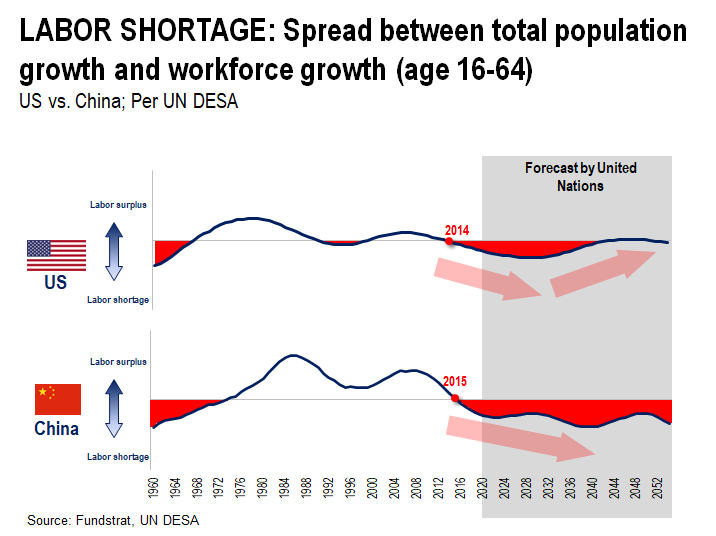
Lastly, USA demographics are likely to be superior to China. Take a look at the 5-year growth rate of the “workforce” or people ages 16-64:
– China’s figure turned negative beginning in 2015, and is set to worsen through 2052
– USA’s figure turned negative in 2014 (GenX is driver) but will bottom in 2029 before turning upwards
– USA surge is due to both Millennials and GenZ cohorts being larger than the current GenX
– the same is not true for China
Thus, USA demographics suggest the overall outlook for US organic economic resilience is potentially more attractive than China. That is, with a growth in the overall labor force returning (in late 2020s) while China sees a sustained decline, there is less urgency for USA to create “productivity” to grow overall GDP.
– this is another factor supporting USA relative outperformance.
BOTTOM LINE: USA outperformance might continue for several more years, even as pandemic recedes globally
Bottom line, the case for US stocks to continue outperforming, while not necessarily intuitive, might continue for some time. Add in the potential upside from fiscal stimulus and a dovish central bank, and there is a case for both EPS upside and valuation expansion.
Our recommended strategies are:
– Energy
– Homebuilders (Golden 6 months) XHB
– Small-caps IWM-0.14%
– Epicenter XLI-0.33% XLF0.43% XLB0.06% RCD
– Crypto equities BITO3.94% GBTC4.29% BITW5.27%
Into 2022…
– Industrials

30 Granny Shot Ideas: We performed our quarterly rebalance on 10/25. Full stock list here –> Click here
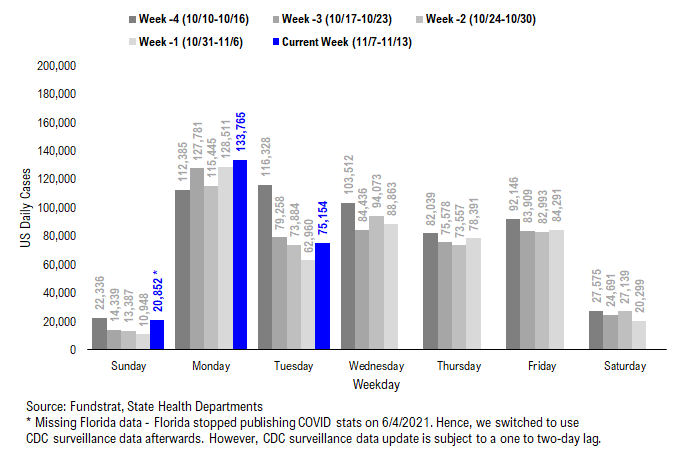
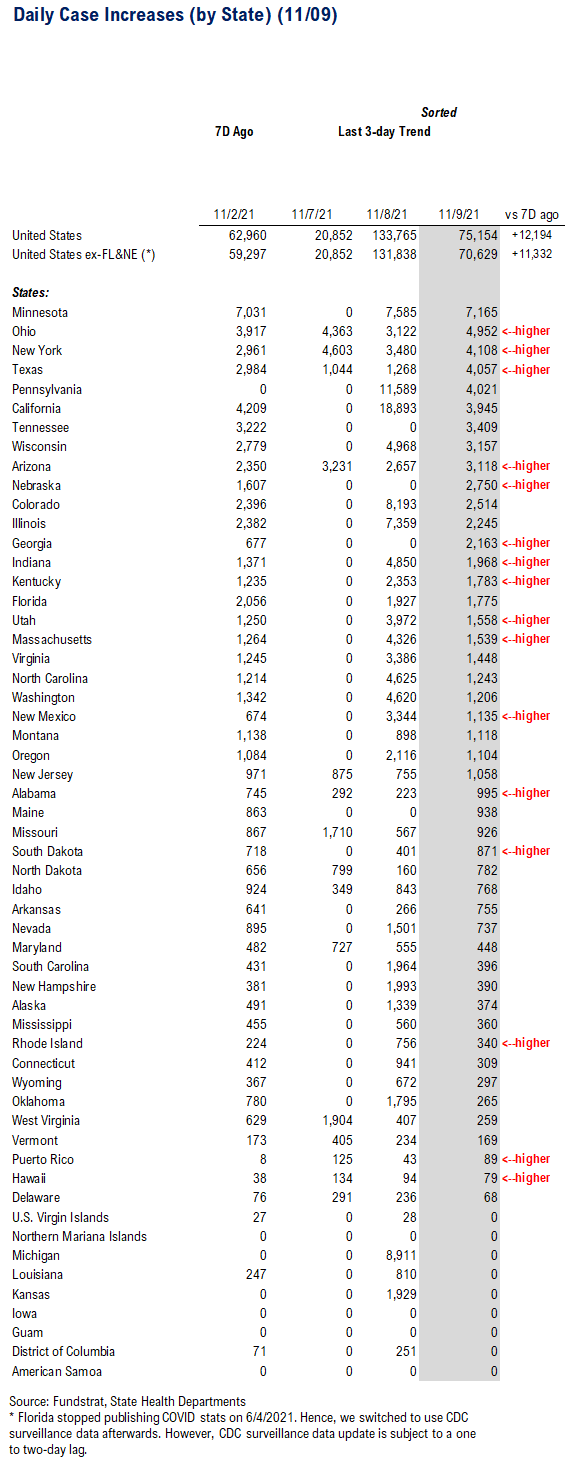
POINT 1: Daily COVID-19 cases 75,154, up +12,194 vs 7D ago…
Current Trends — COVID-19 cases:
- Daily cases 75,154 vs 62,960 7D ago, up +12,194
- Daily cases ex-FL&NE 70,629 vs 59,297 7D ago, up +11,332
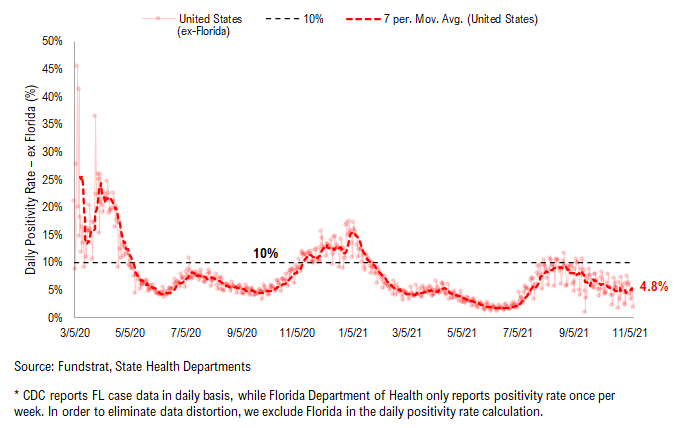
- 7D positivity rate 4.8% vs 4.8% 7D ago
- Hospitalized patients 43,163 , down -2.4% vs 7D ago
- Daily deaths 1,011, down -16.7% vs 7D ago
*** Florida and Nebraska stopped publishing daily COVID stats updates on 6/4 and 6/30, respectively. We switched to use CDC surveillance data as the substitute. However, since CDC surveillance data is subject to a one-to-two day lag, we added a “US ex-FL&NE” in our daily cases and 7D delta sections in order to demonstrate a more comparable COVID development.
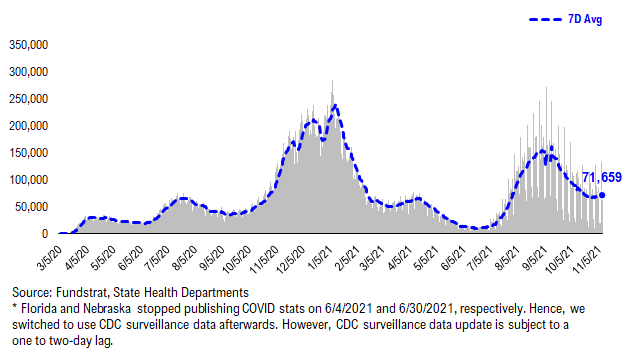
The latest COVID daily cases came in at 75,154, up +12,194 vs 7D ago. The 7D deltas have been trending upward recently, and as seen below, the speed of case rollover appears to be slowing. Nonetheless, as booster shots are becoming more widely available, the speed of case rollover should increase once again.
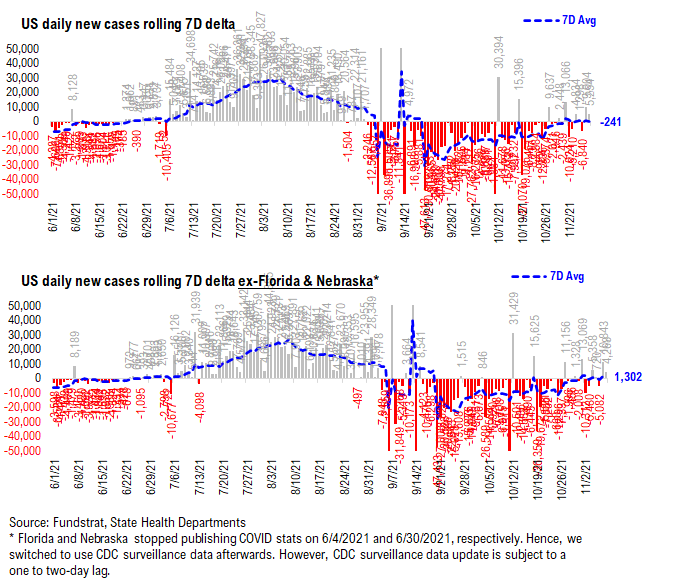
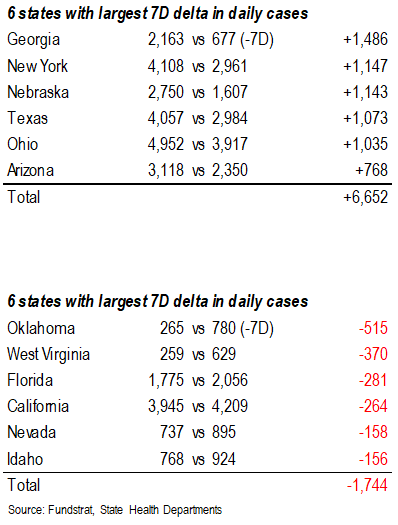
Rolling 7D delta in daily cases is flat…
The rolling 7D delta is currently flat as the speed of case rollover has slowed. As booster shots are becoming more widely available, the speed of case decline should resume and the rolling 7D delta should once again turn negative.
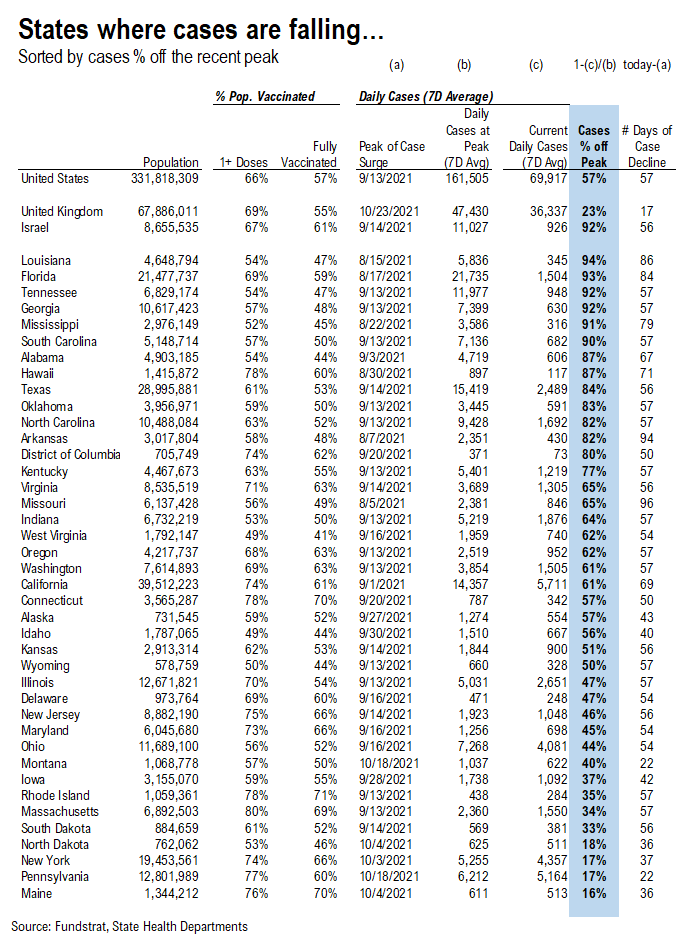
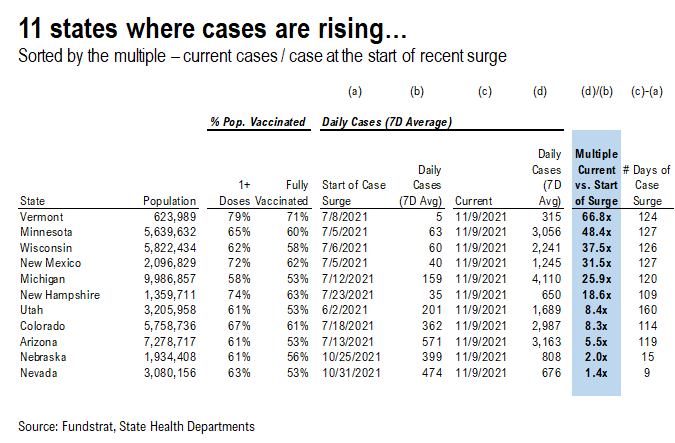
11 states are seeing a rise in cases while cases continue to decline in the remaining states…
*** We’ve split the “Parabolic Case Tracker” into 2 tables: one where cases are falling, and the other where cases are rising
In these tables, we’ve included the vaccine penetration, case peak information, and the current case trend for 50 US states + DC. The table for states where cases are declining is sorted by case % off of their recent peak, while the table for states where cases are rising is sorted by the current daily cases to pre-surge daily cases multiple.
- The states with higher ranks are the states that have seen a more significant decline / rise in daily cases
- We also calculated the number of days during the recent case surge
- The US as a whole, UK, and Israel are also shown at the top as a reference
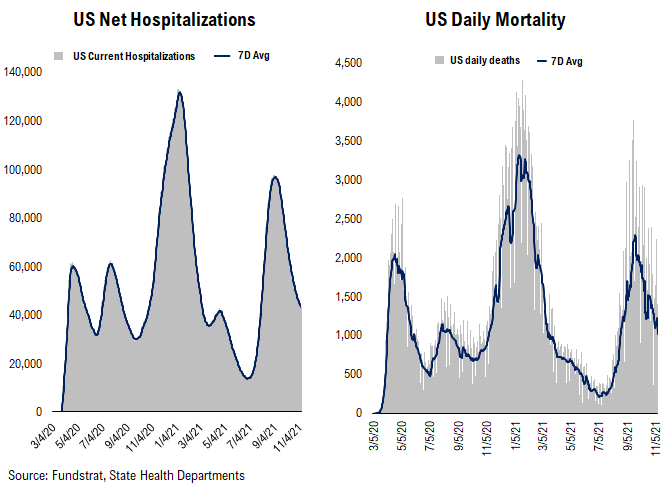
Hospitalizations, deaths, and positivity rates are rolling over amidst case rollover…
Below we show the aggregate number of patients hospitalized due to COVID, daily mortality associated with COVID, and the daily positivity rate for COVID.
– Net hospitalizations peaked below the Wave 3 peak and are currently rolling over
– Daily death peaked slightly above the Wave 2 peak and are currently rolling over
– As per the decline in daily cases, the positivity rate is currently rolling over
POINT 2: VACCINE: vaccination pace accelerates as boosters become more widely available…
Current Trends — Vaccinations:
- avg 1.3 million this past week vs 1.3 million last week
- overall, 58.1% fully vaccinated, 67.0% 1-dose+ received
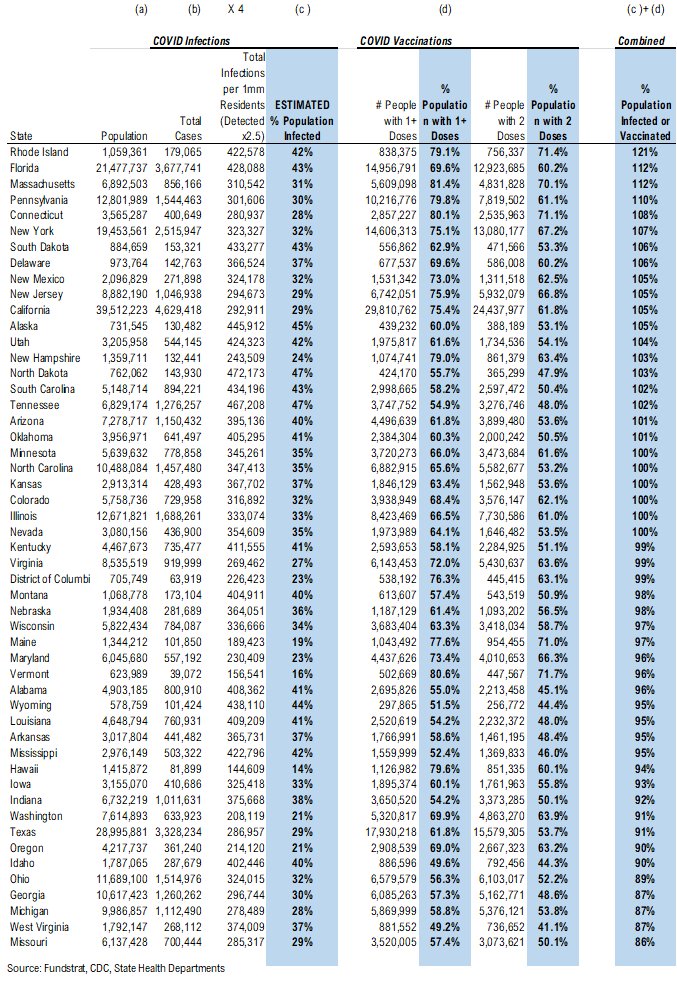
Vaccination frontier update –> all states now near or above 80% combined penetration (vaccines + infections)
*** We’ve updated the total detected infections multiplier from 4.0x to 2.5x. The CDC changed the estimate multiplier because testing has become much better and more prevalent.
Below we sorted the states by the combined penetration (vaccinations + infections). The assumption is that a state with higher combined penetration is likely to be closer to herd immunity, and therefore, less likely to see a parabolic surge in daily cases and deaths. Please note that this “combined penetration” metric can be over 100%, as infected people could also be vaccinated (actually recommended by CDC).
– Currently, all states are near or above 80% combined penetration
– Given the new multiplier. only RI, FL, MA, CT, NM, NY, NJ, IL, CA, PA, DE, SD, KY, UT, OK, ND, NH, AZ, SC, TN, AK, NC, CO, KS, MN, and NV are now above 100% combined penetration (vaccines + infections). Again, this metric can be over 100%, as infected people could also be vaccinated. But 100% combined penetration does not mean that the entire population within each state is either infected or vaccinated
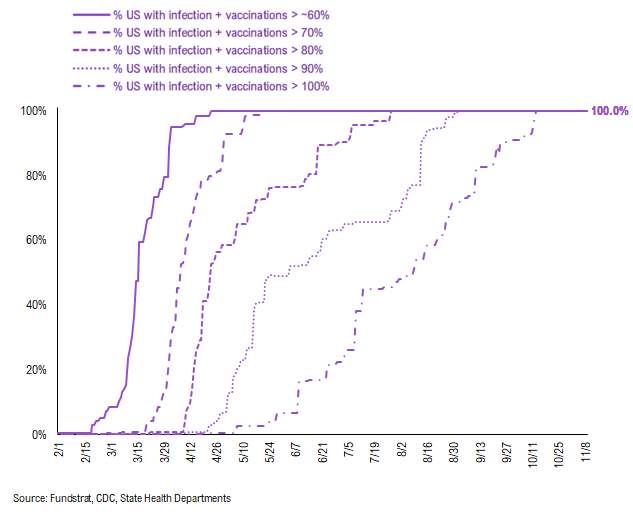
Below is a diffusion chart that shows the % of US states (based on state population) that have reached the combined penetration > 60%/70%/80%/90%/100%. As you can see, all states have reached combined infection & vaccination > 100% (Reminder: this metric can be over 100%, as infected people could also be vaccinated. But 100% combined penetration does not mean that the entire population within the state is either infected or vaccinated).
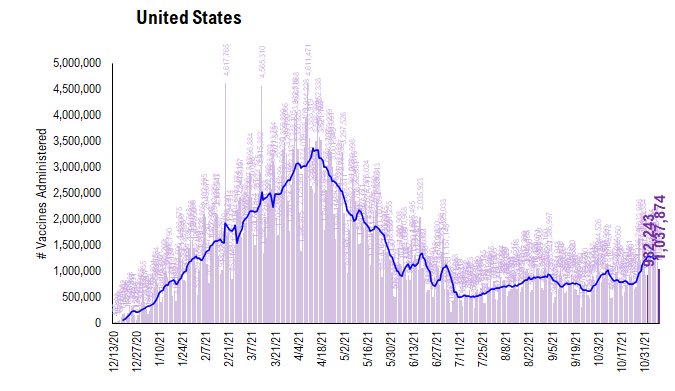
There were a total of 1,037,874 doses administered reported on Monday, up 6% vs. 7D ago. We are seeing the vaccination pace accelerate as booster shots are becoming more widely available. Also, the same catalysts remain in place:
- Proof of vaccination required by many US cities and venues
- Booster shots
- Full FDA approval of Pfizer COVID vaccines (hopefully it could help overcome vaccine hesitancy)
- Biden’s vaccination plan
The daily number of vaccines administered remains the most important metric to track this progress and we will be closely watching the relevant data.
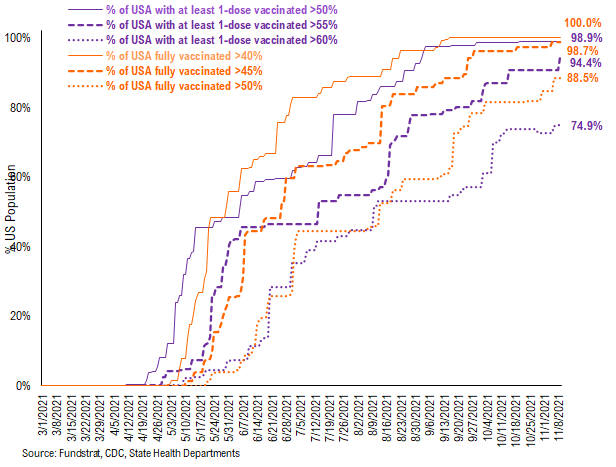
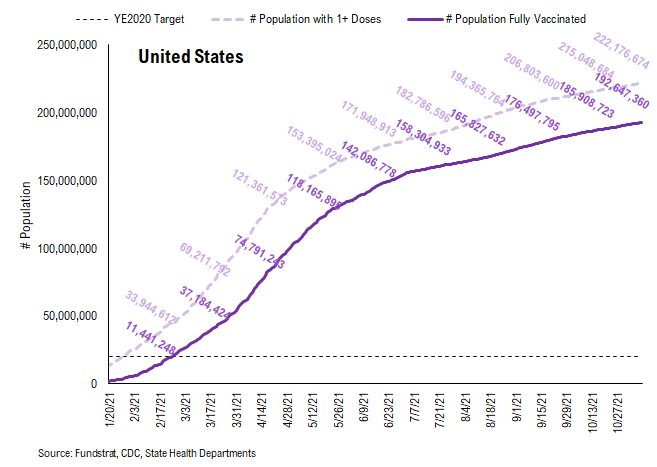
74.9% of the US has seen 1-dose penetration > 60%…
To better illustrate the actual footprint of the US vaccination effort, we have a time series showing the percent of the US with at least 45%/45%/50% of its residents fully vaccinated, displayed as the orange lines on the chart. Currently, 100% of US states have seen 40% of their residents fully vaccinated. However, when looking at the percentage of the US with at least 45% of its residents fully vaccinated, this figure is 98.7%. And only 88.5% of US (by state population) have seen 50% of its residents fully vaccinated.
We have done similarly for residents with at least 1-dose of the vaccination, denoted by the purple lines on the chart. While 98.9% of US states have seen 1 dose penetration > 50%, 94.4% of them have seen 1 dose penetration > 55% and 74.9% of them have seen 1 dose penetration > 60%.
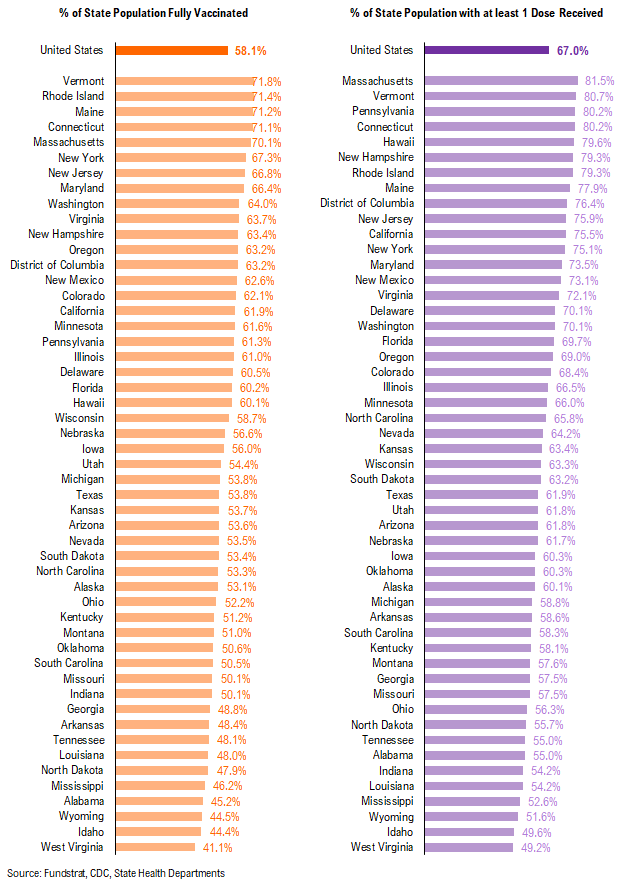
This is the state by state data below, showing information for individuals with one dose and two doses.
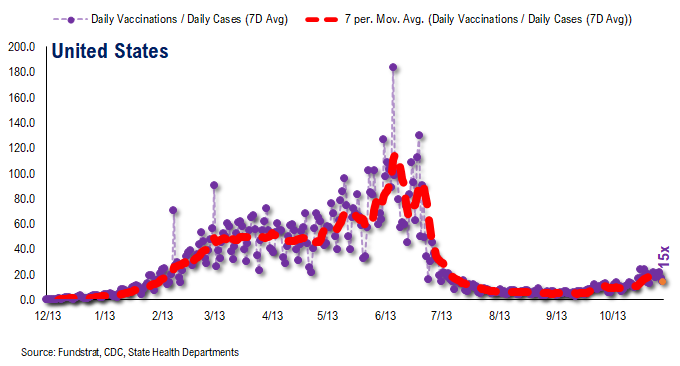
The ratio of vaccinations/ daily confirmed cases has been falling significantly (red line is 7D moving avg). Both the surge in daily cases and decrease in daily vaccines administered contributed to this.
– the 7D moving average is about ~15 for the past few days
– this means 15 vaccines dosed for every 1 confirmed case
In total, 415 million vaccine doses have been administered across the country. Specifically, 222 million Americans (68% of US population) have received at least 1 dose of the vaccine. And 193 million Americans (59% of US population) are fully vaccinated.
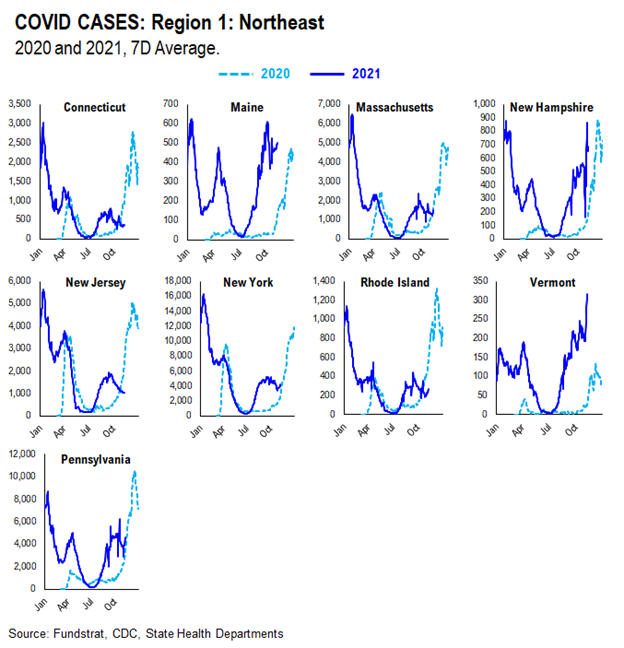
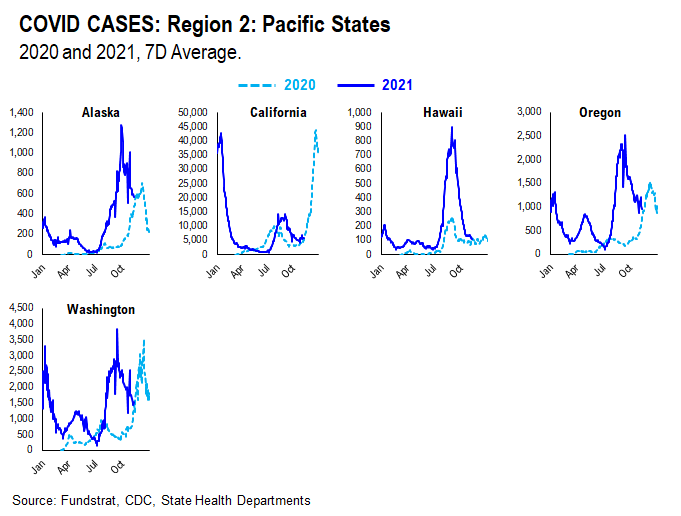
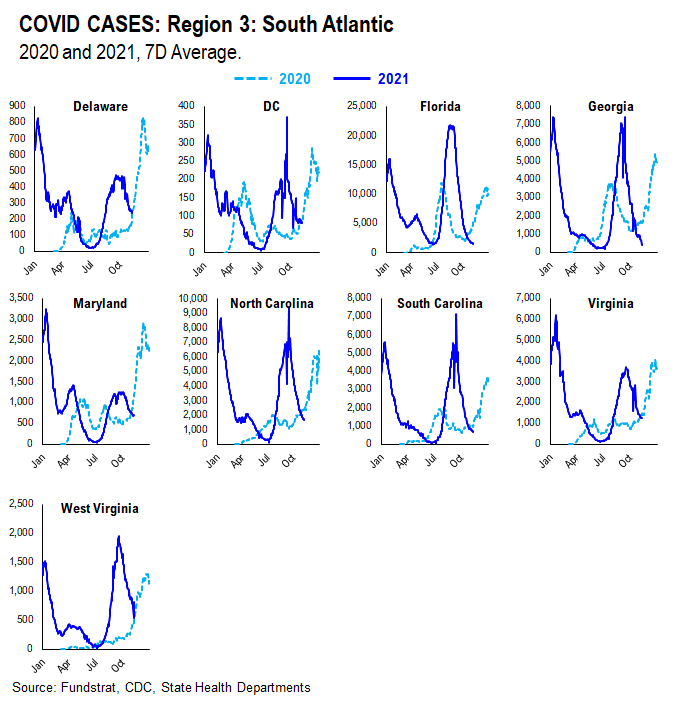
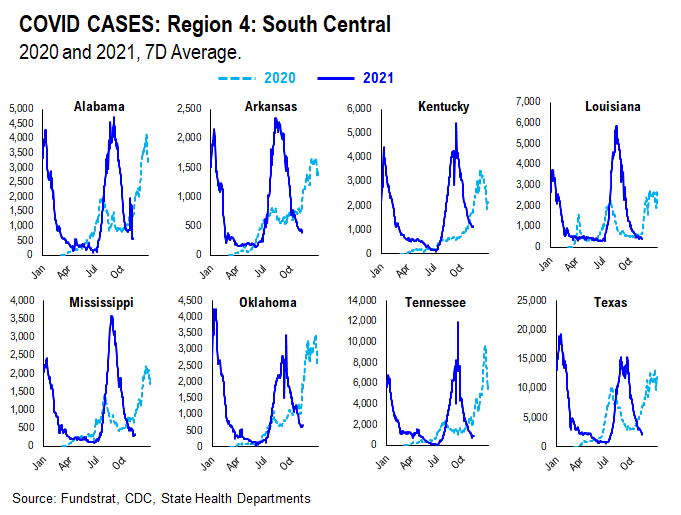
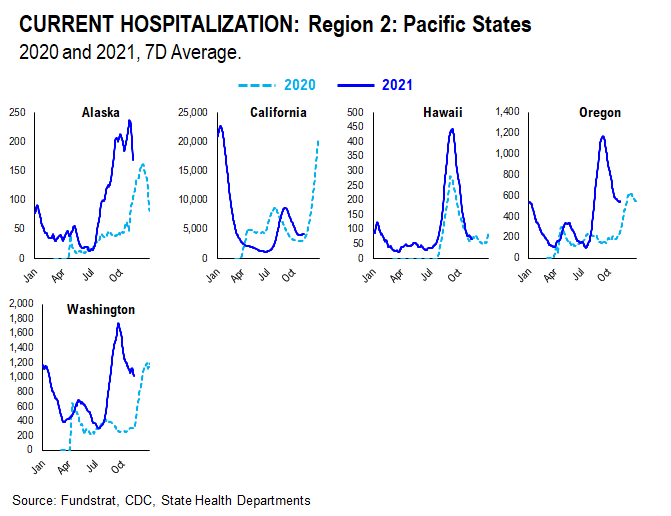
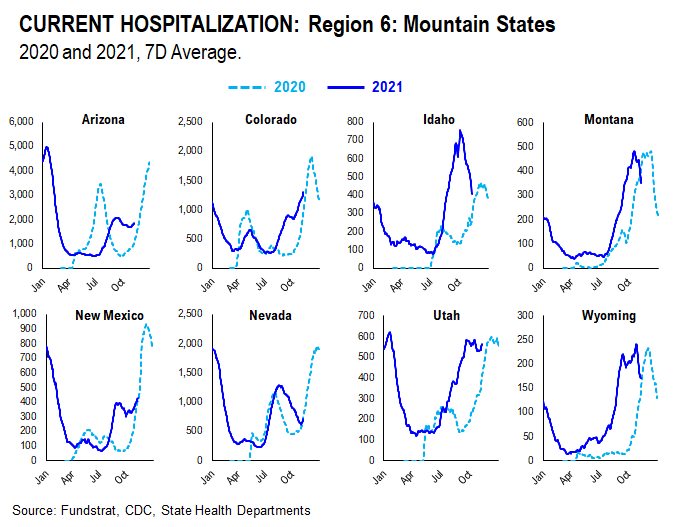
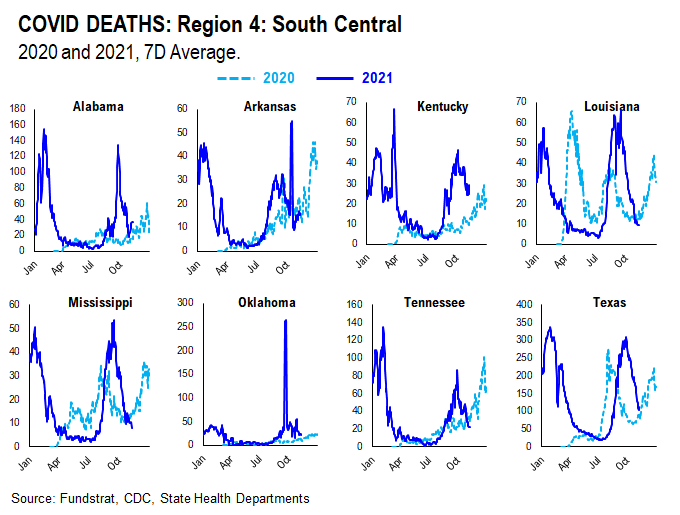
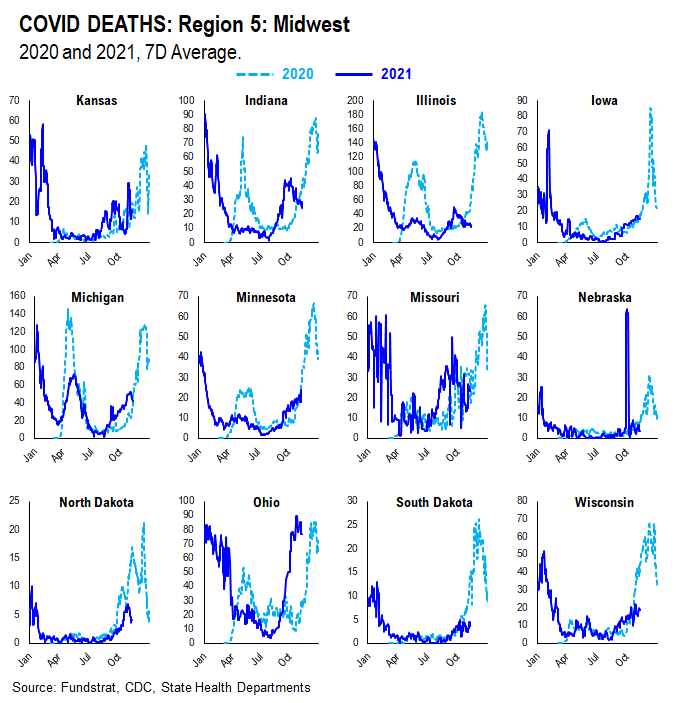
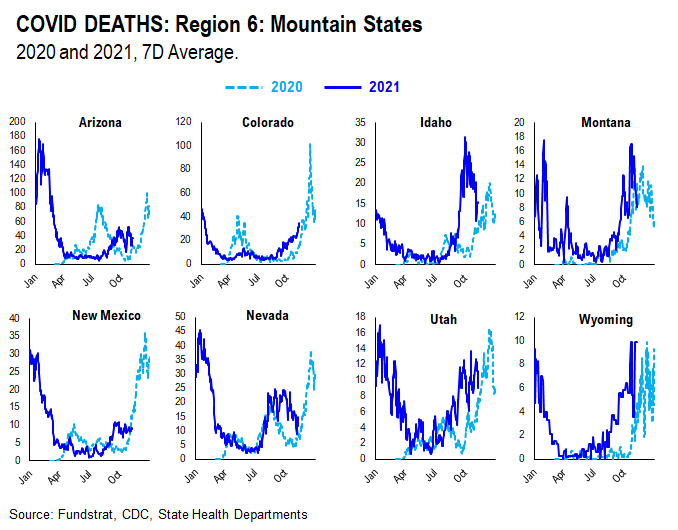
POINT 3: Tracking the seasonality of COVID-19
In July, we noted that many states experienced similar case surges in 2021 to the ones they experienced in 2020. As such, along with the introduction of the more transmissible Delta variant, seasonality also appears to play an important role in the recent surge in daily cases, hospitalization, and deaths. Therefore, we think there might be a strong argument that COVID-19 is poised to become a seasonal virus.
The possible explanations for the seasonality we observed are:
– Outdoor Temperature: increasing indoor activities in the South vs increasing outdoor activities in the northeast during the Summer
– “Air Conditioning” Season: similar to “outdoor temperature”, more “AC” usage might facilitate the spread of the virus indoors
If this holds true, seasonal analysis suggests that the Delta spike could roll over by following a similar pattern to 2020.
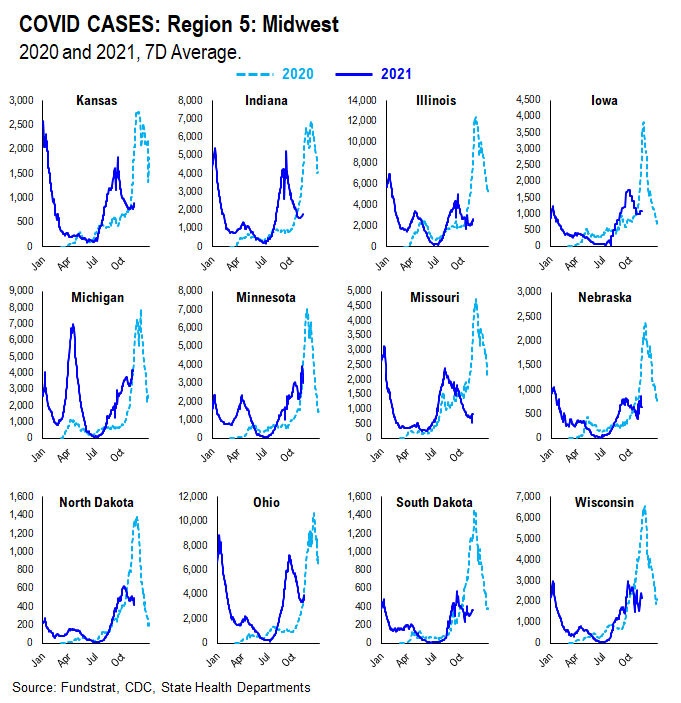
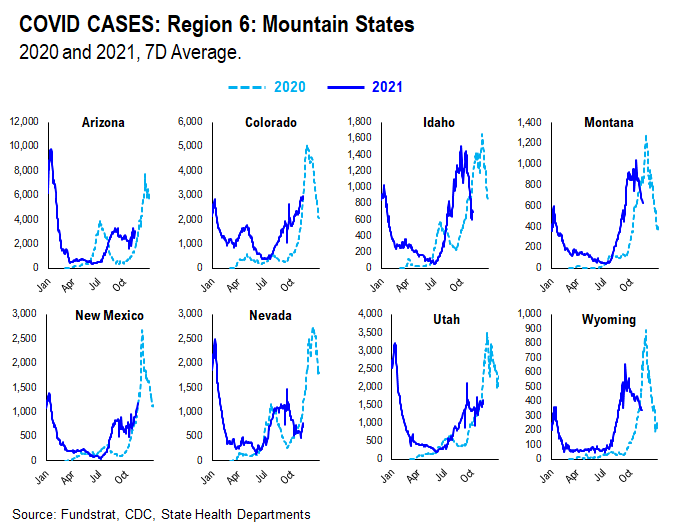
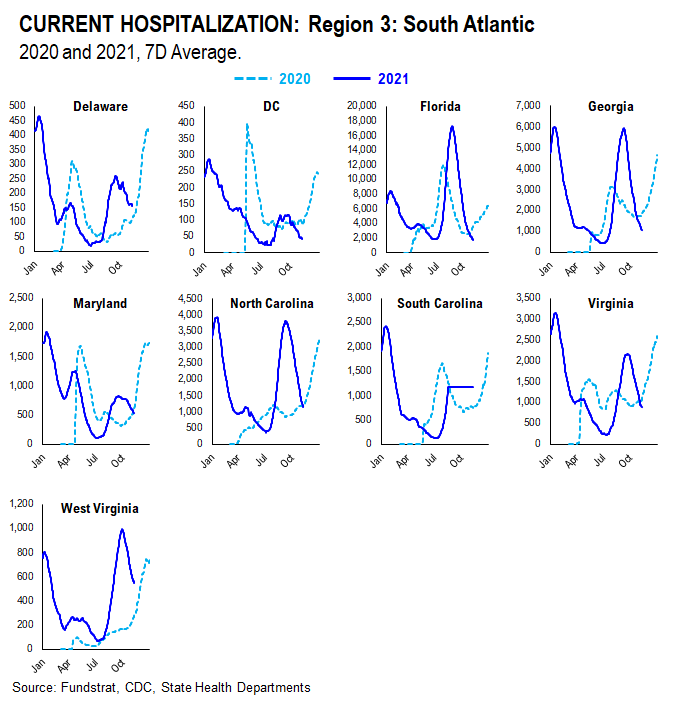
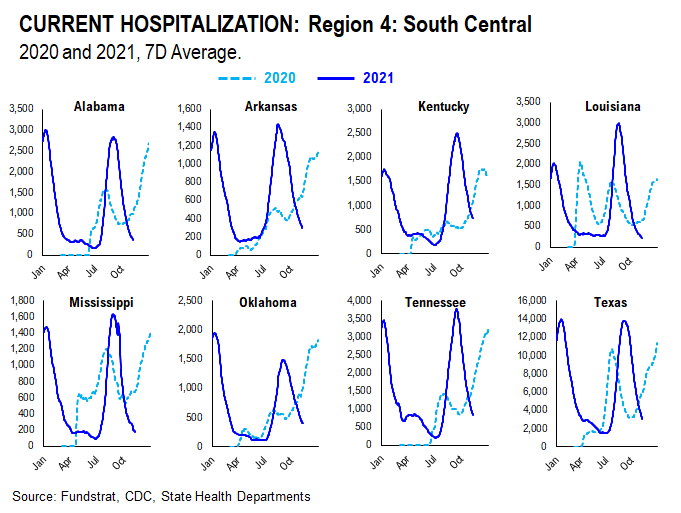
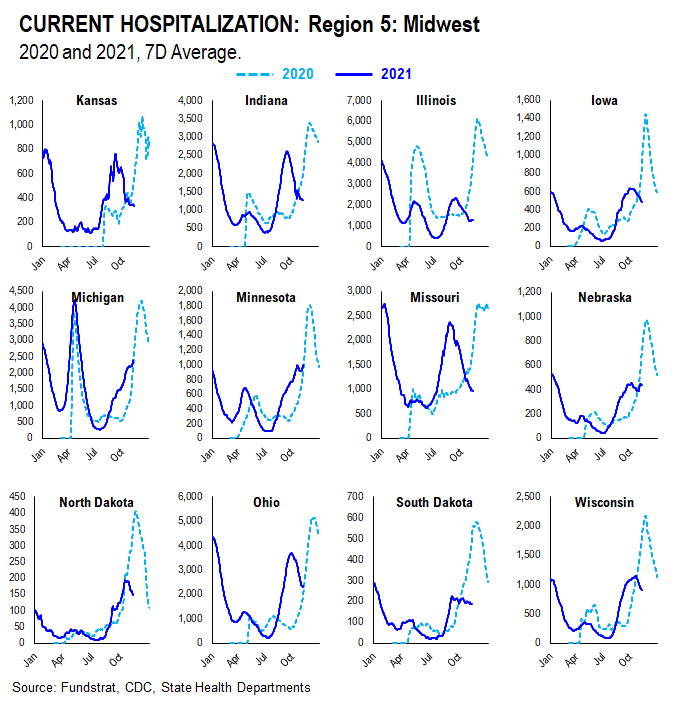
We created this section within our COVID update which tracks and compare the case, hospitalization, and death trends in both 2020 and 2021 at the state level. We grouped states geographically as they tend to trend similarly.
CASES
It seems as if the main factor contributing to current case trends right now is outdoor temperature. During the Summer, outdoor activities are generally increased in the northern states as the weather becomes nicer. In southern states, on the other hand, it becomes too hot and indoor activities are increased. As such, northern state cases didn’t spike much during Summer 2020 while southern state cases did. Currently, northern state cases are showing a slight spike, especially when compared to Summer 2020. This could be attributed to the introduction of the more transmissible Delta variant and the lifting of restrictions combined with pent up demand for indoor activities.
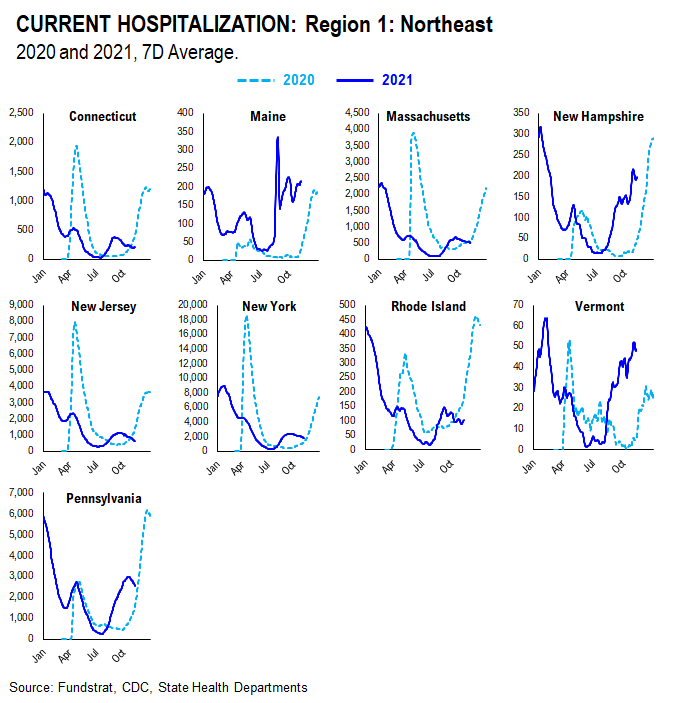
HOSPITALIZATION
Current hospitalizations appear to be similar or less than Summer 2020 rates in most states. This is likely due to increased vaccination rates and the vaccine’s ability to reduce the severity of the virus.
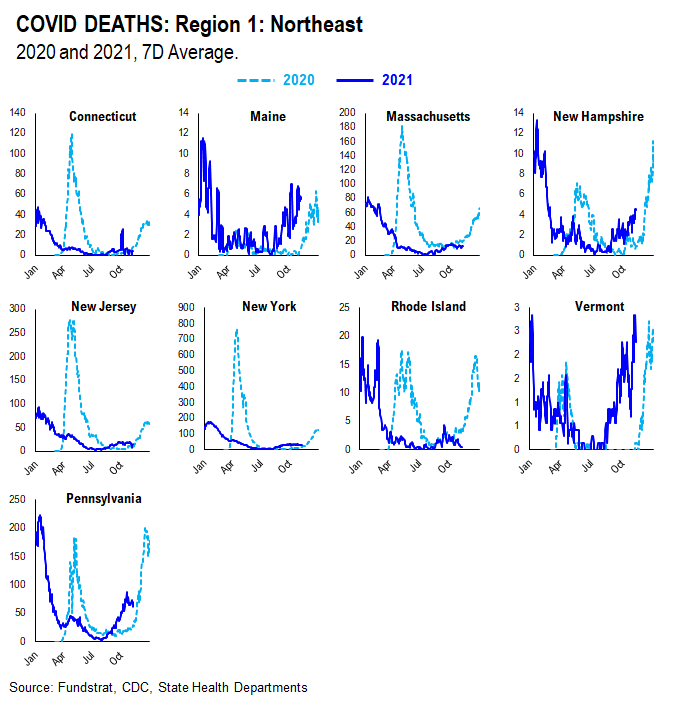
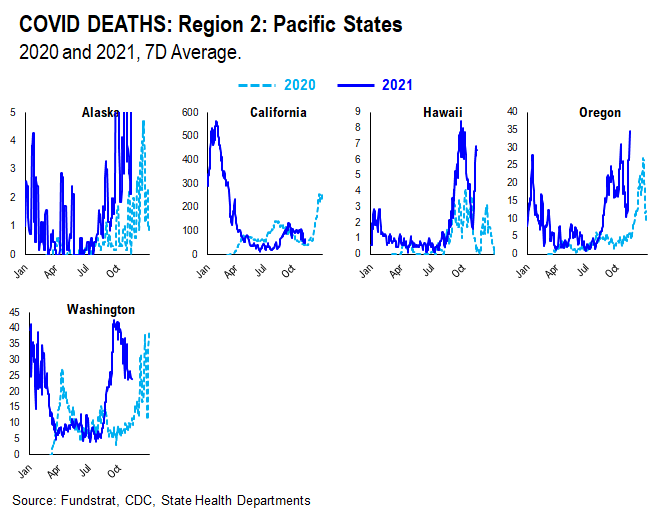
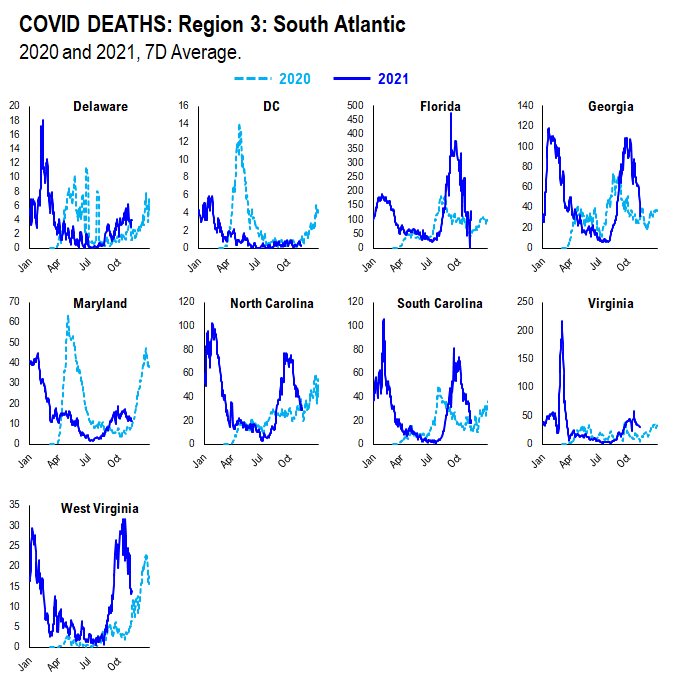
DEATHS
Current death rates appear to be scattered compared to 2020 rates. This is likely due to varying vaccination rates in each state. States with higher vaccination rates seem to have lower death rates given the vaccine’s ability to reduce the severity of the virus; states with lower vaccination rates seem to have higher death rates.
More from the author
Articles Read 1/2
🎁 Unlock 1 extra article by joining our Community!
Stay up to date with the latest articles. You’ll even get special recommendations weekly.
Already have an account? Sign In 16a33e-ace5f3-4275a9-ca1e78-32a418
Already have an account? Sign In 16a33e-ace5f3-4275a9-ca1e78-32a418

