

US has 9 states where cases per 1mm > Germany, yet there is no policymaker nor media panic --> markets should be watching but not wary

Click HERE to access the FSInsight COVID-19 Daily Chartbook.
We publish on a 4-day a week schedule:
Monday
Tuesday
Wednesday
SKIP THURSDAY
Friday
REGISTER NOW: Exclusive Virtual Conference on Market Strategy into the Year-end and Beyond – Tomorrow at 10:00am ET…
Please join us tomorrow – Thursday November 18 at 10:00am ET – for our annual virtual conference as the leading strategists at FSInsight provide their insights to help you navigate the markets into year-end and beyond. We are also pleased to announce that Michael Saylor (Chairman and CEO of MicroStrategy) will be joining the conference for a fireside chat with Tom Lee. Please find the details of the conference agenda below.
Link –> Click here to register

STRATEGY: Incoming economic data strong but markets are overly wary
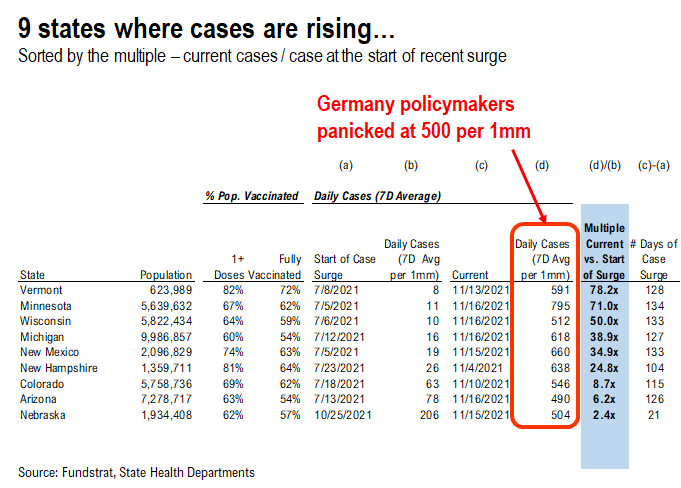
Germany hit “panic” button at 500 cases per 1mm residents –> US has 9 states > and yet no panic in media nor by policymakers
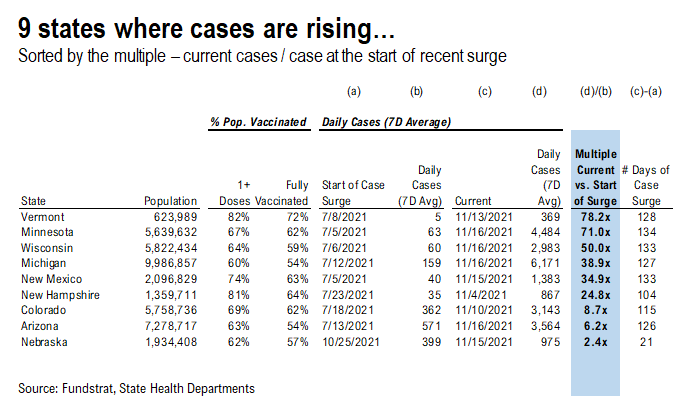
Many may not be aware but Minnesota and Vermont have seen an absolute explosion in COVID-19 cases:
– VT and MN cases are 78X and 71X above their July levels, respectively
– daily cases per 1 million residents are 591 and 795, respectively
– Germany policymakers hit the panic button Monday when cases per 1mm residents moved above 500
In fact, the 9 states below have cases well beyond the levels that caused German officials to panic. And yet, we have not heard about any governors or mayors talking about limiting capacity. Nor has the media talked about the “horrific” surge in cases.
– What is our point?
– It is too early for investors to get too “gloomy” about the uptick in COVID-19 cases in the US
– yes, cases are rising, but this is not warranting concern
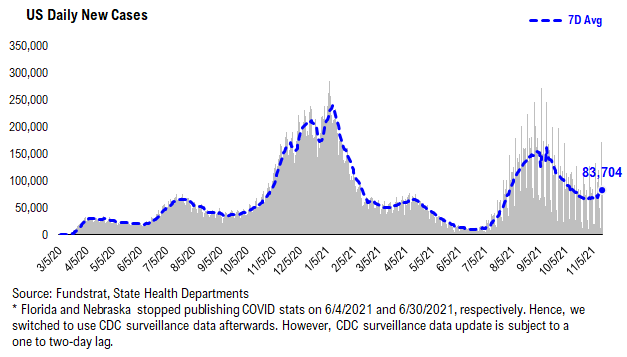
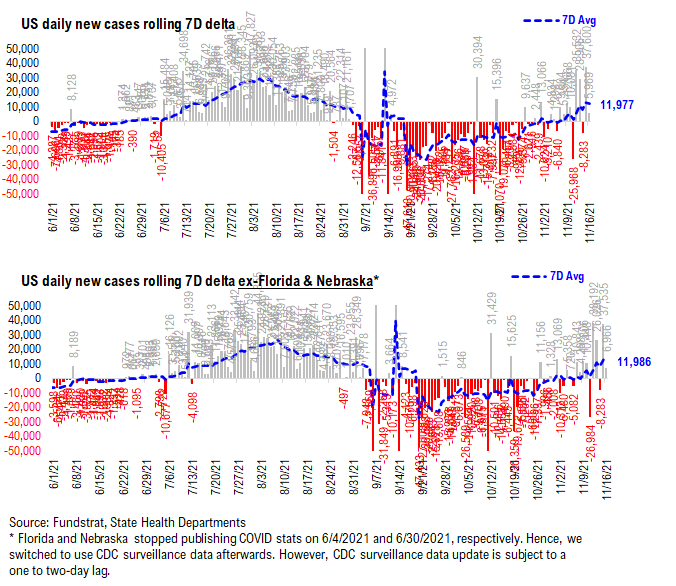
Ever so visibly, daily cases are curling upwards in the US as shown below. After seeing 7D average in cases of the 60,000-70,000 range, daily cases are now inching towards 84,000 as shown below.
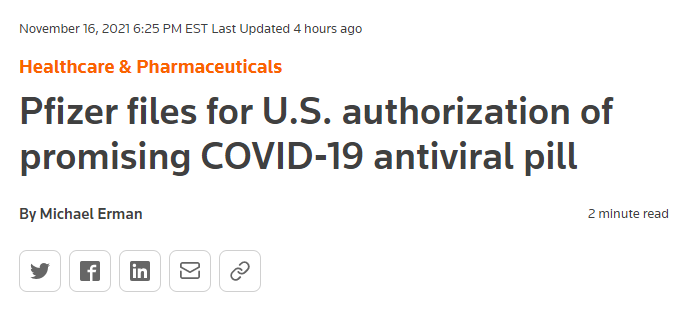
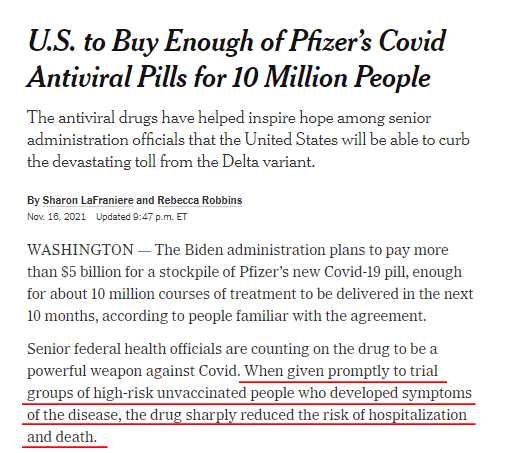
Pfizer files for US authorization of US COVID-19 antiviral pill
Pfizer filed for US authorization of this COVID-19 pill. And as widely reported a few weeks ago, this pill has reduced the risk of hospitalization by 89% and there were no deaths in the trial:
– this pill has the same overall effectiveness as a COVID-19 vaccine
– and only has to be given to an infected person
– rather than inoculate pre-emptively
Thus, this is effectively addressing the lack of vaccination willingness in the US.
…US plans to buy 10 million pills
The US plans to buy 10 million of these pills. This is a huge figure:
– if daily cases move towards 100,000 per day (wave 4)
– and let’s assume 80% or 80,000 per day are unvaccinated
– this supply would cover 125 days of cases or 6 months
– presumably, those subsequently recovering would be organically immune (for a period)
Thus, this pill program can be effective in essentially ending the more severe risks of COVID-19. In other words, this is a reason to believe future waves of COVID-19 will result in a different reaction by:
– consumers –> less likely to panic
– policymakers –> less likely to panic
– media –> less likely to panic
Thus, again, I am emphasizing that while COVID-19 cases are rising. We don’t think investors need to panic. At least not yet.
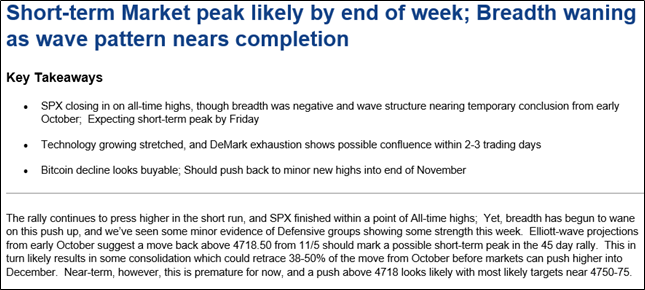
STRATEGY: Our Technical Strategist, Mark Newton, is highlighting potential for near-term peak in markets
Our Head of Technical Strategy, Mark Newton, wrote this commentary, noting he believes the S&P 500 might be near a peak by the end of this week:
– next week is the US Thanksgiving holiday
– so a shortened week, no trading Thursday and a short session Friday
– he also notes Defensive are gaining incrementally –> sign of tactical caution
– Technology might be stretched
I wanted to flag this commentary, because I can certainly sense investors have become wary. Their wariness is a combination of:
– Fed chair change
– Inflation concerns, too high
– COVID-19 surge
And this means there is a chance for a minor “wall of worry” to build. But as we would be “buyers of this dip” — thus, even with the expectations for near-term weakness, and expect markets to be strong into YE.
We will have lots to discuss on our webinar this week, so today’s comments are a bit shorter.
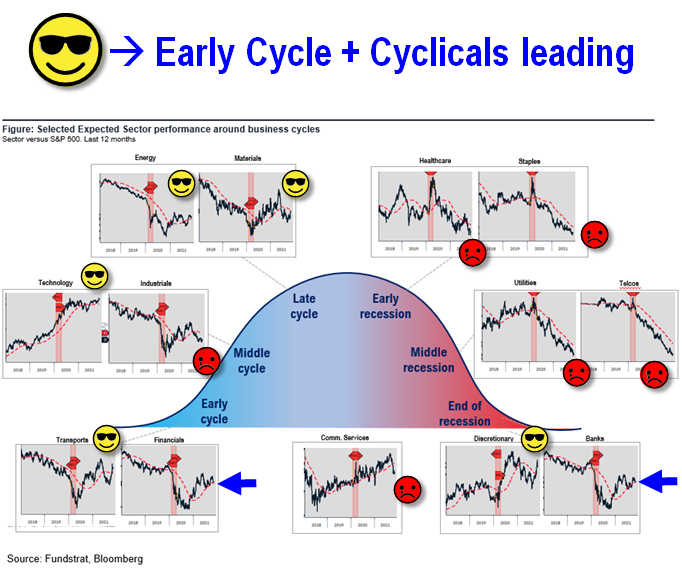
SECTORS: Leadership still Cyclicals/Early-cycle aka Epicenter
Relative sector performance is shown below and as we can see, 5 sectors are showing positive relative trend:
– Energy
– Basic Materials
– Technology
– Transports
– Discretionary
– sort of Financials/Banks
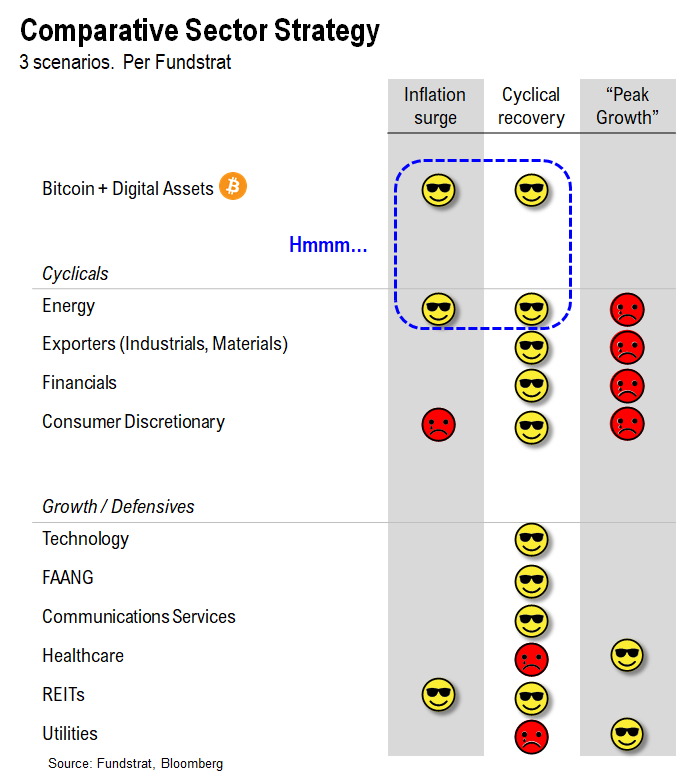
These are all cyclical groups. And also have general positive exposure to reflationary trends. Inflation, incidentally, in isolation is not a bad word. The real risk to markets is:
– too much inflation hurting consumer confidence
– or unanchored inflation expectations, fear of uncontained inflation
This is not necessarily what markets seem to be pricing. If markets were worried about either of the above, Defensive stocks or Growth stocks would be leading. Instead, we are seeing Cyclicals lead.
Into YE, our recommended strategies are:
– Energy
– Homebuilders (Golden 6 months) XHB
– Small-caps IWM-0.14%
– Epicenter XLI-0.33% XLF0.43% XLB0.06% RCD
– Crypto equities BITO3.94% GBTC4.29% BITW5.27%
Into 2022…
– Industrials
30 Granny Shot Ideas: We performed our quarterly rebalance on 10/25. Full stock list here –> Click here
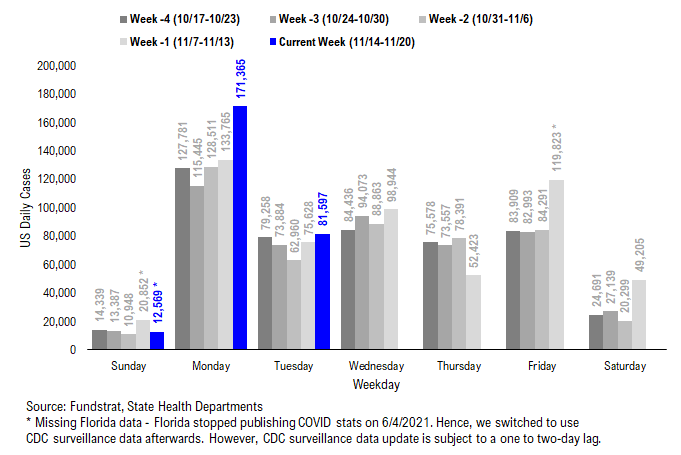
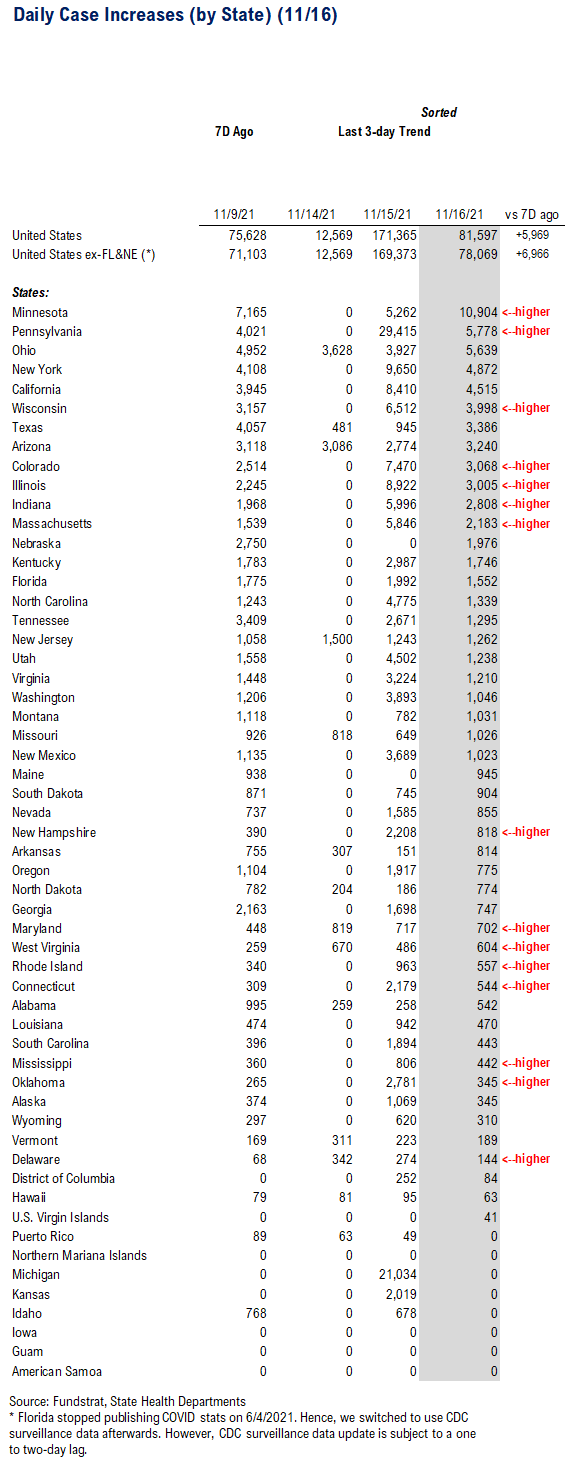
POINT 1: Daily COVID-19 cases 81,597, up +5,969 vs 7D ago…
Current Trends — COVID-19 cases:
- Daily cases 81,597 vs 75,628 7D ago, up +5,969
- Daily cases ex-FL&NE 78,069 vs 71,103 7D ago, up +6,966
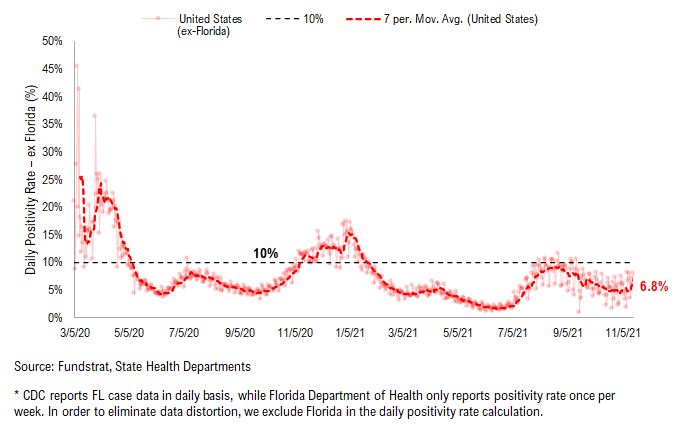
- 7D positivity rate 6.8% vs 4.8% 7D ago
- Hospitalized patients 43,879 , up +1.7% vs 7D ago
- Daily deaths 914, down -25.8% vs 7D ago
*** Florida and Nebraska stopped publishing daily COVID stats updates on 6/4 and 6/30, respectively. We switched to use CDC surveillance data as the substitute. However, since CDC surveillance data is subject to a one-to-two day lag, we added a “US ex-FL&NE” in our daily cases and 7D delta sections in order to demonstrate a more comparable COVID development.
The latest COVID daily cases came in at 81,597, up +5,969 vs 7D ago. Many states didn’t report COVID data last Thursday in observance of Veteran’s Day. As such, the data is currently distorted as evident by the recent fluctuating 7D deltas.

Rolling 7D delta distorted due to observance of Veteran’s Day…
The rolling 7D delta is currently distorted due to the underreporting resulting from the observance of Veteran’s Day.
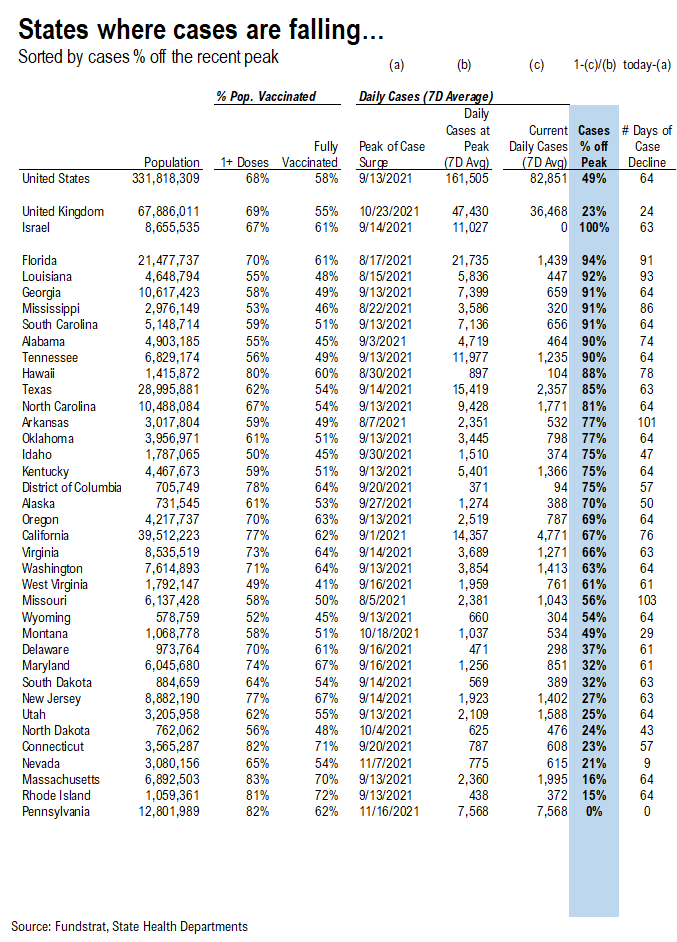
9 states are seeing a rise in cases while cases continue to decline in the remaining states…
*** We’ve split the “Parabolic Case Tracker” into 2 tables: one where cases are falling, and the other where cases are rising
In these tables, we’ve included the vaccine penetration, case peak information, and the current case trend for 50 US states + DC. The table for states where cases are declining is sorted by case % off of their recent peak, while the table for states where cases are rising is sorted by the current daily cases to pre-surge daily cases multiple.
- The states with higher ranks are the states that have seen a more significant decline / rise in daily cases
- We also calculated the number of days during the recent case surge
- The US as a whole, UK, and Israel are also shown at the top as a reference
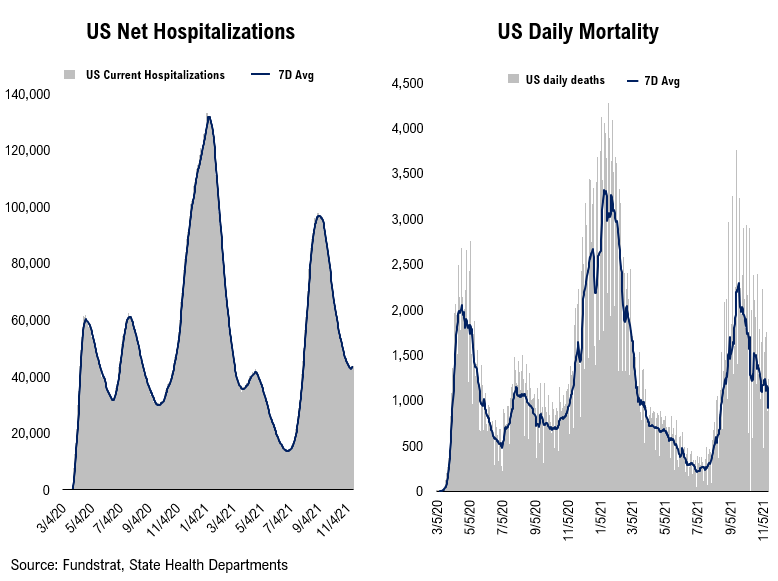
Hospitalizations, deaths, and positivity rates are rolling over amidst case rollover…
Below we show the aggregate number of patients hospitalized due to COVID, daily mortality associated with COVID, and the daily positivity rate for COVID.
– Net hospitalizations peaked below the Wave 3 peak and are currently rolling over
– Daily death peaked slightly above the Wave 2 peak and are currently rolling over
– As per the decline in daily cases, the positivity rate is currently rolling over

POINT 2: VACCINE: vaccination pace accelerates as boosters become more widely available…
Current Trends — Vaccinations:
– avg 1.5 million this past week vs 1.3 million last week
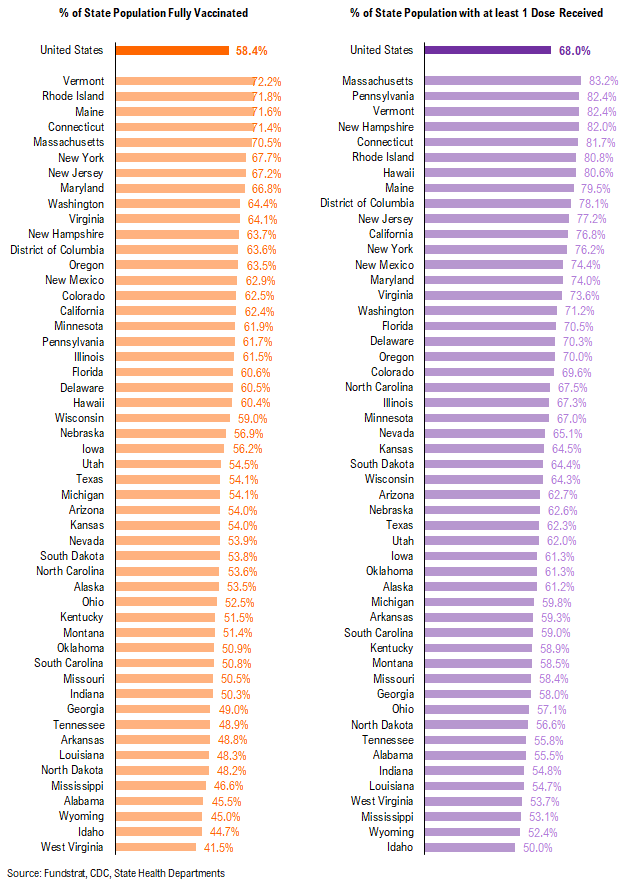
– overall, 58.4% fully vaccinated, 68.0% 1-dose+ received
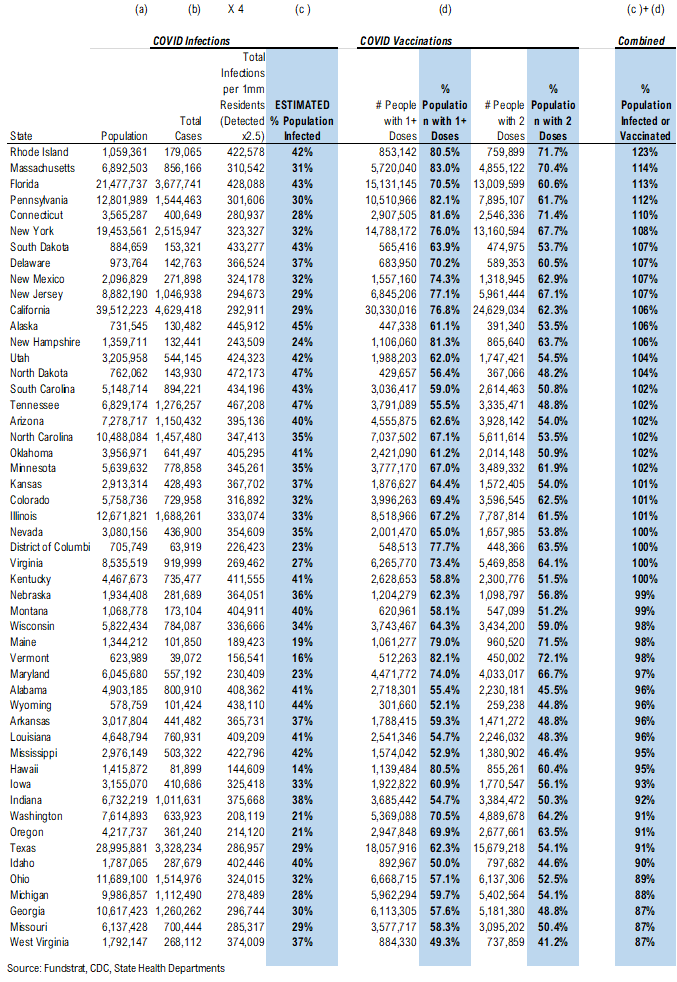
Vaccination frontier update –> all states now near or above 80% combined penetration (vaccines + infections)
*** We’ve updated the total detected infections multiplier from 4.0x to 2.5x. The CDC changed the estimate multiplier because testing has become much better and more prevalent.
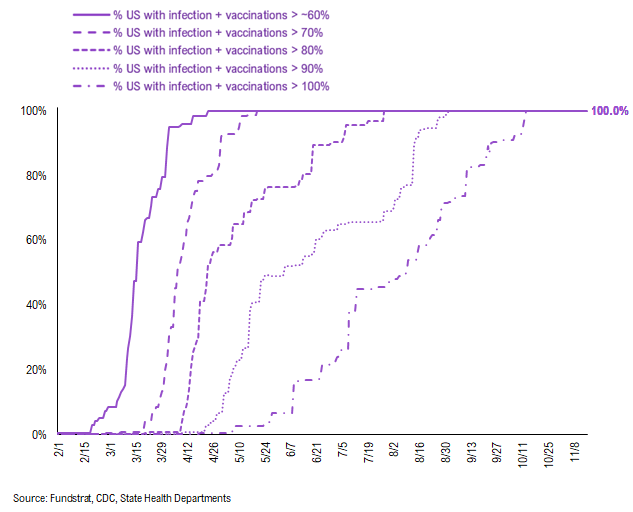
Below we sorted the states by the combined penetration (vaccinations + infections). The assumption is that a state with higher combined penetration is likely to be closer to herd immunity, and therefore, less likely to see a parabolic surge in daily cases and deaths. Please note that this “combined penetration” metric can be over 100%, as infected people could also be vaccinated (actually recommended by CDC).
– Currently, all states are near or above 90% combined penetration
– Given the new multiplier. only RI, FL, MA, CT, NM, NY, NJ, IL, CA, PA, DE, SD, KY, UT, OK, ND, NH, AZ, SC, TN, AK, NC, CO, KS, MN, VA, DC, and NV are now above 100% combined penetration (vaccines + infections). Again, this metric can be over 100%, as infected people could also be vaccinated. But 100% combined penetration does not mean that the entire population within each state is either infected or vaccinated
Below is a diffusion chart that shows the % of US states (based on state population) that have reached the combined penetration > 60%/70%/80%/90%/100%. As you can see, all states have reached combined infection & vaccination > 100% (Reminder: this metric can be over 100%, as infected people could also be vaccinated. But 100% combined penetration does not mean that the entire population within the state is either infected or vaccinated).
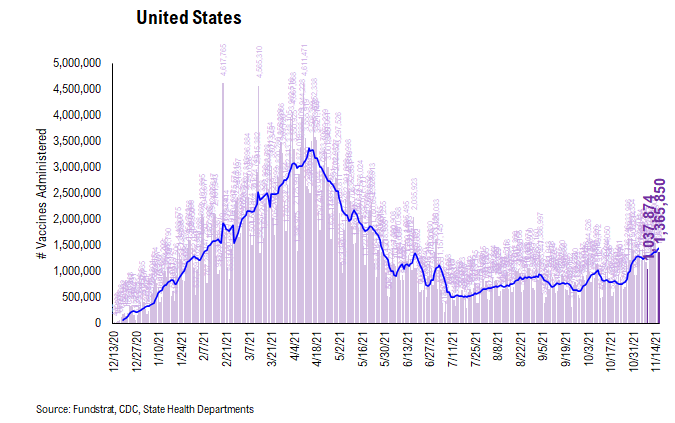
There were a total of 1,365,850 doses administered reported on Tuesday, up 32% vs. 7D ago. We are seeing the vaccination pace accelerate as booster shots are becoming more widely available. Also, the same catalysts remain in place:
- Proof of vaccination required by many US cities and venues
- Booster shots
- Full FDA approval of Pfizer COVID vaccines (hopefully it could help overcome vaccine hesitancy)
- Biden’s vaccination plan
The daily number of vaccines administered remains the most important metric to track this progress and we will be closely watching the relevant data.
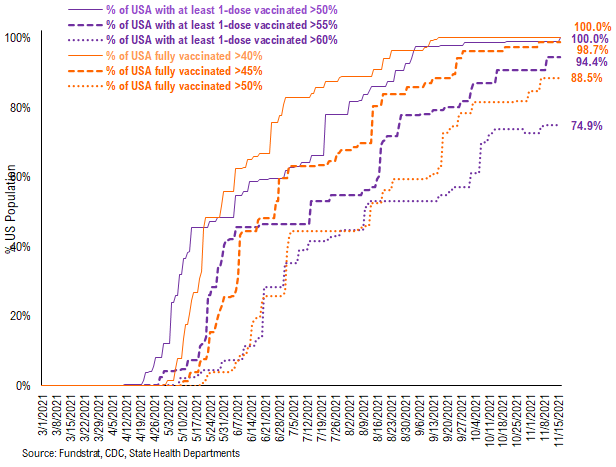
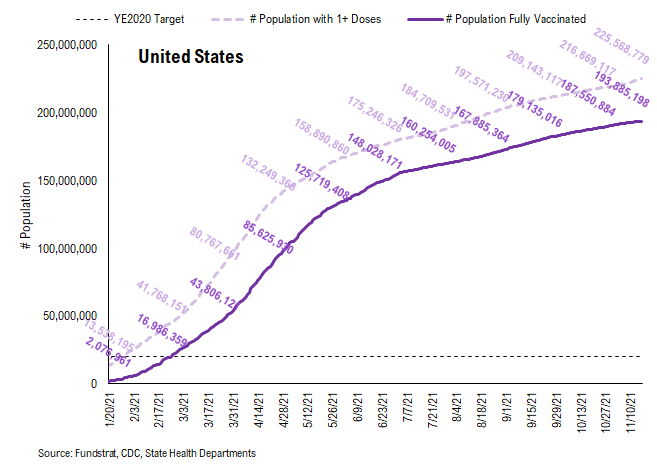
74.9% of the US has seen 1-dose penetration > 60%…
To better illustrate the actual footprint of the US vaccination effort, we have a time series showing the percent of the US with at least 45%/45%/50% of its residents fully vaccinated, displayed as the orange lines on the chart. Currently, 100% of US states have seen 40% of their residents fully vaccinated. However, when looking at the percentage of the US with at least 45% of its residents fully vaccinated, this figure is 98.7%. And only 88.5% of US (by state population) have seen 50% of its residents fully vaccinated.
We have done similarly for residents with at least 1-dose of the vaccination, denoted by the purple lines on the chart. While 100% of US states have seen 1 dose penetration > 50%, 94.4% of them have seen 1 dose penetration > 55% and 74.9% of them have seen 1 dose penetration > 60%.
This is the state by state data below, showing information for individuals with one dose and two doses.
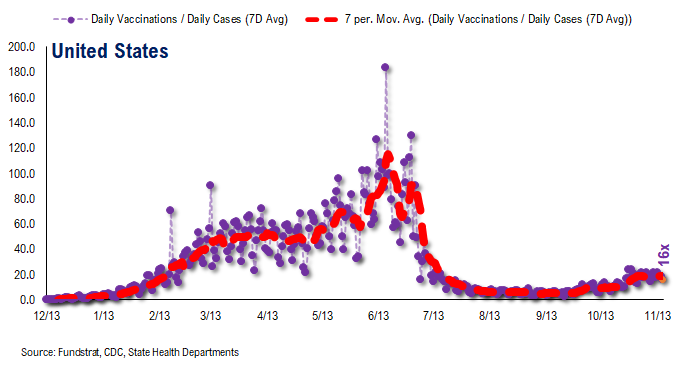
The ratio of vaccinations/ daily confirmed cases has been falling significantly (red line is 7D moving avg). Both the surge in daily cases and decrease in daily vaccines administered contributed to this.
– the 7D moving average is about ~16 for the past few days
– this means 16 vaccines dosed for every 1 confirmed case
In total, 420 million vaccine doses have been administered across the country. Specifically, 226 million Americans (68% of US population) have received at least 1 dose of the vaccine. And 194 million Americans (59% of US population) are fully vaccinated.
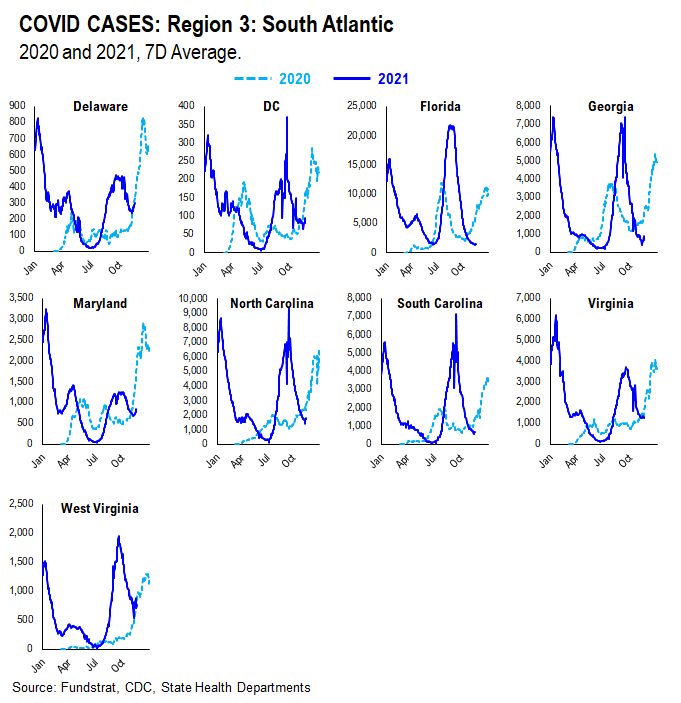
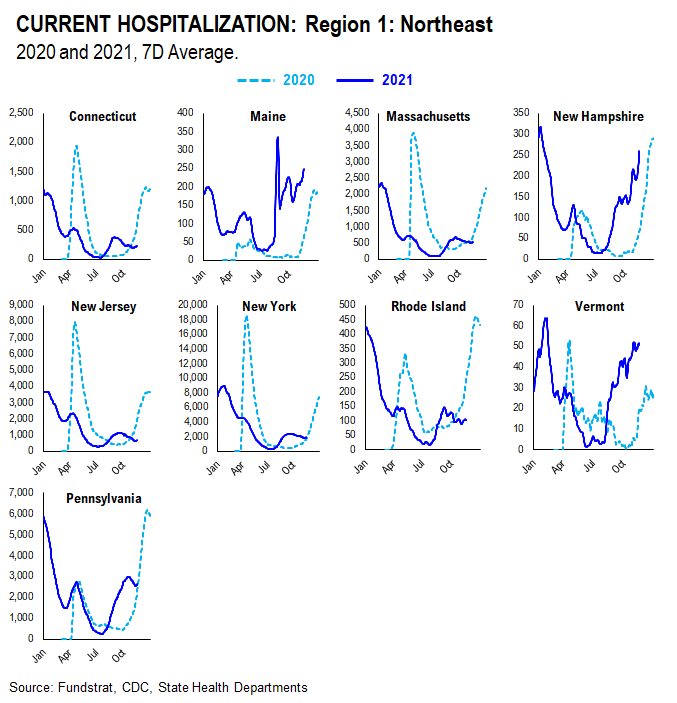
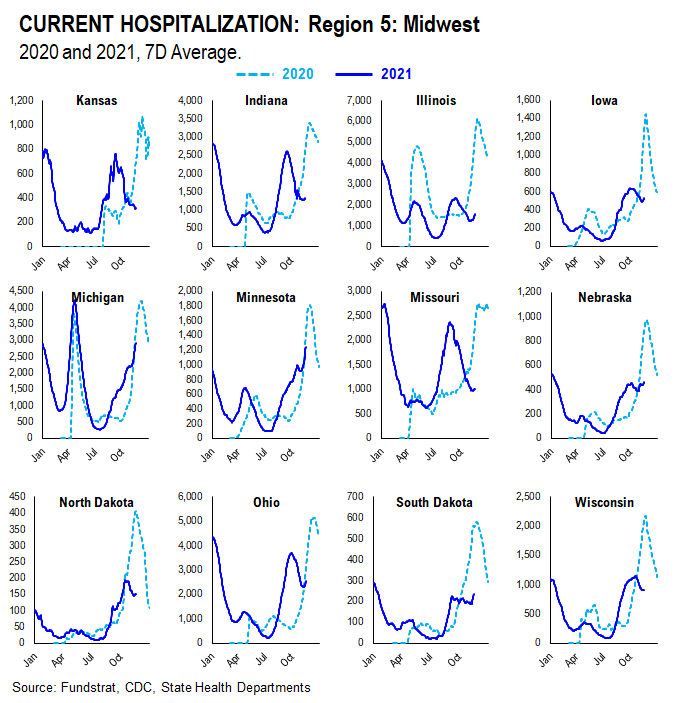
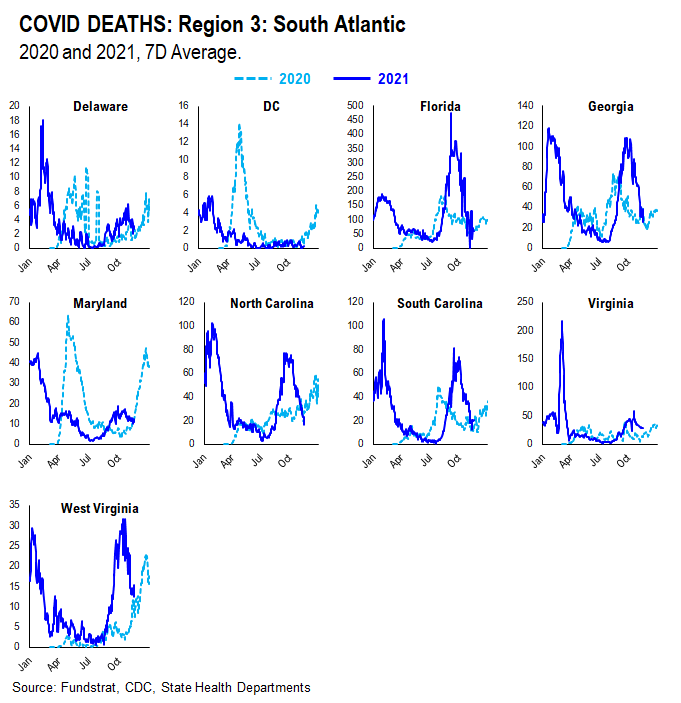
POINT 3: Tracking the seasonality of COVID-19
In July, we noted that many states experienced similar case surges in 2021 to the ones they experienced in 2020. As such, along with the introduction of the more transmissible Delta variant, seasonality also appears to play an important role in the recent surge in daily cases, hospitalization, and deaths. Therefore, we think there might be a strong argument that COVID-19 is poised to become a seasonal virus.
The possible explanations for the seasonality we observed are:
– Outdoor Temperature: increasing indoor activities in the South vs increasing outdoor activities in the northeast during the Summer
– “Air Conditioning” Season: similar to “outdoor temperature”, more “AC” usage might facilitate the spread of the virus indoors
If this holds true, seasonal analysis suggests that the Delta spike could roll over by following a similar pattern to 2020.
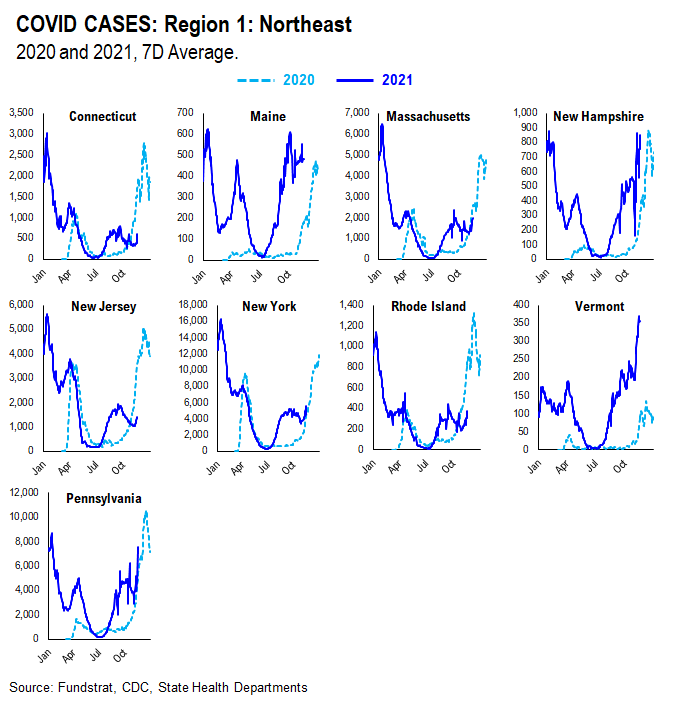
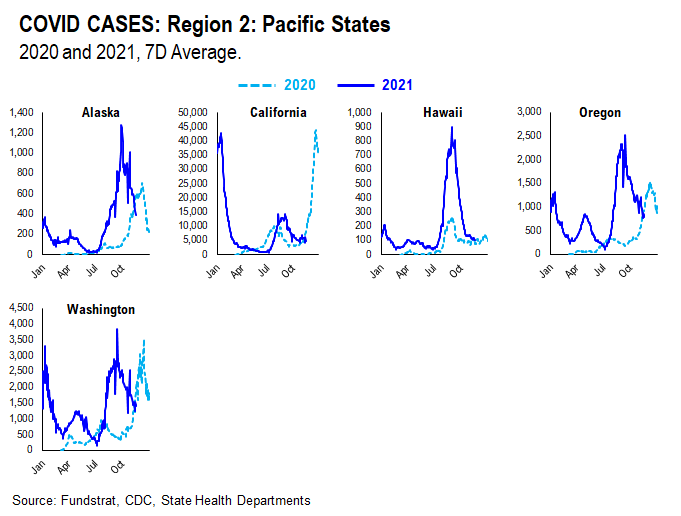
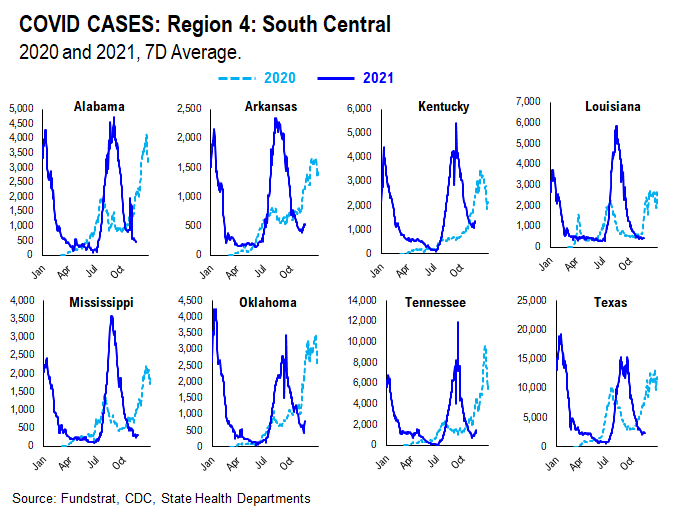
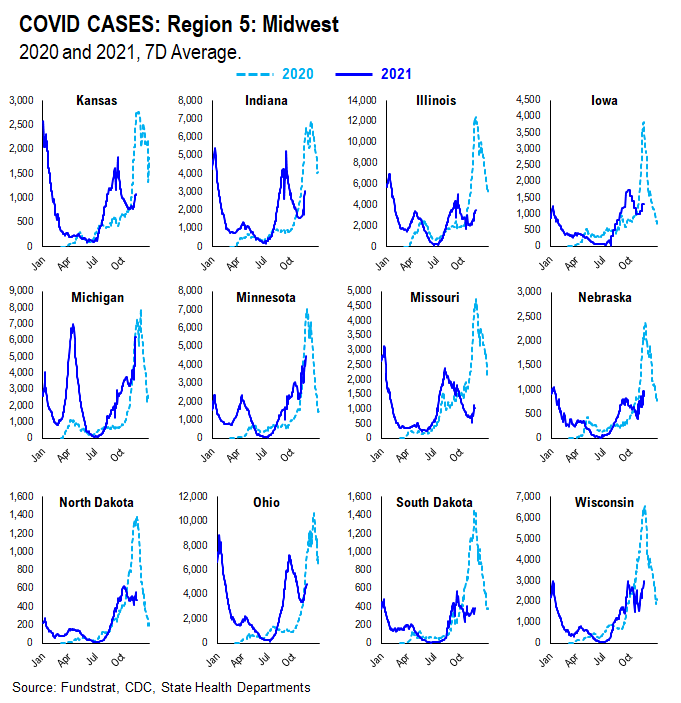
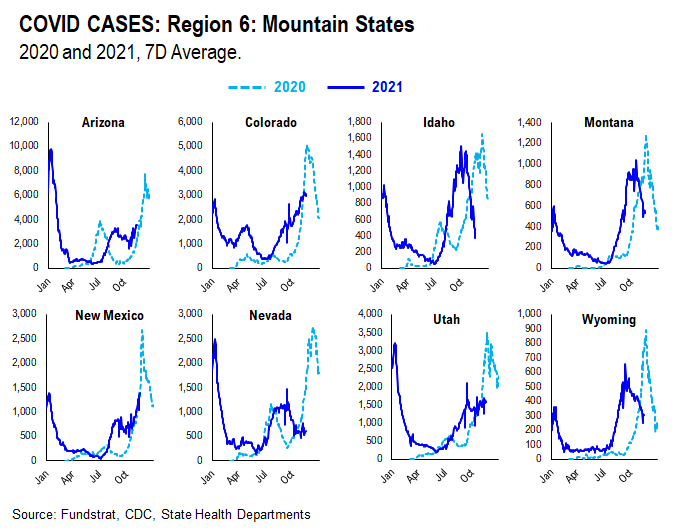
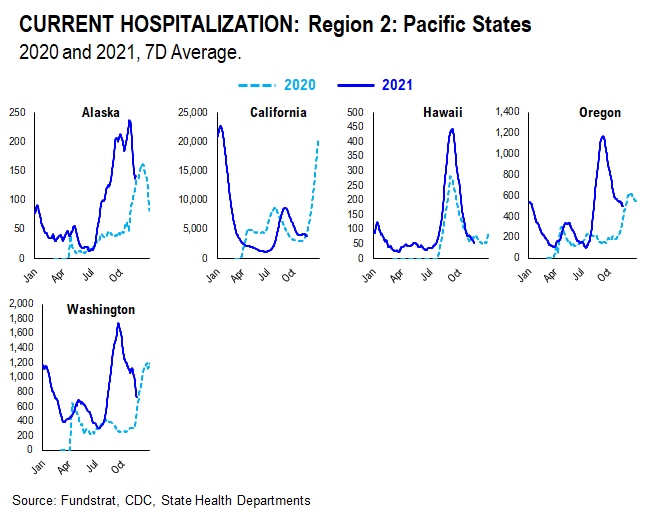
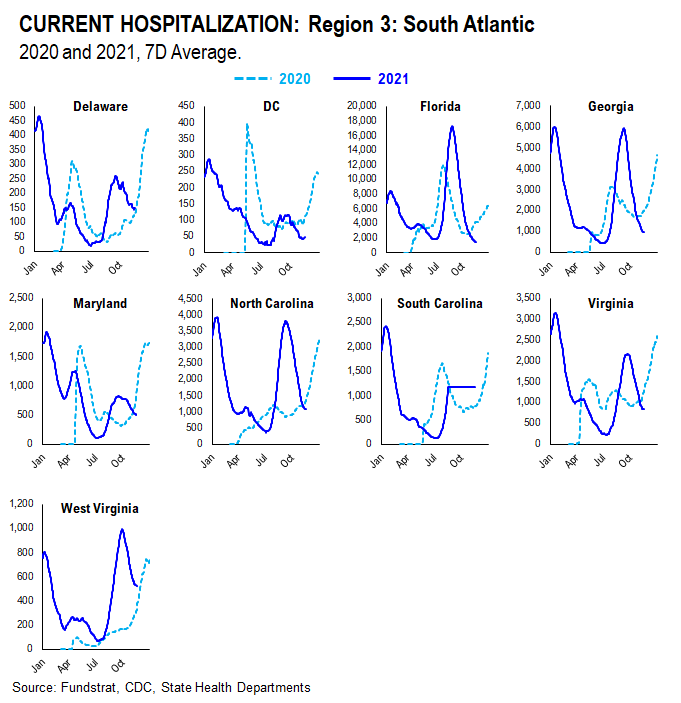
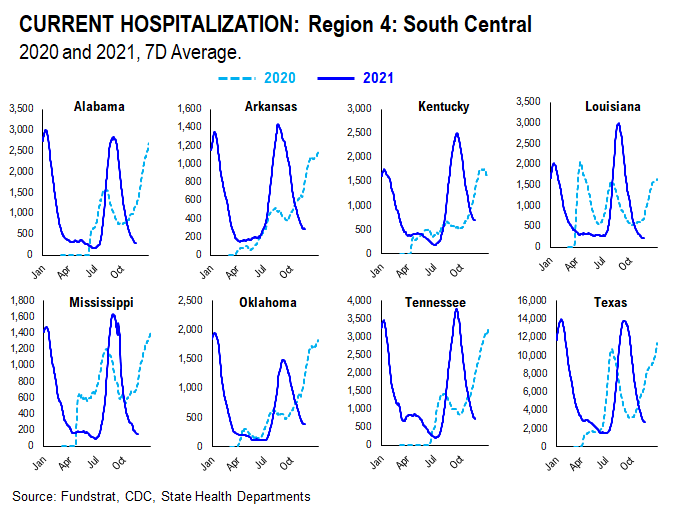
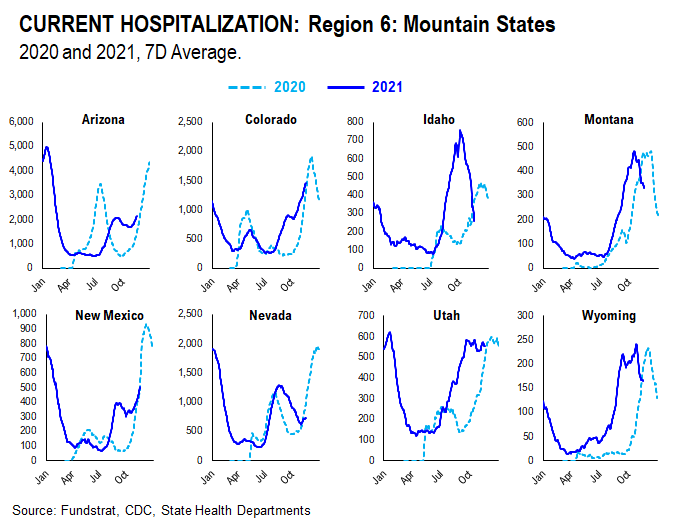
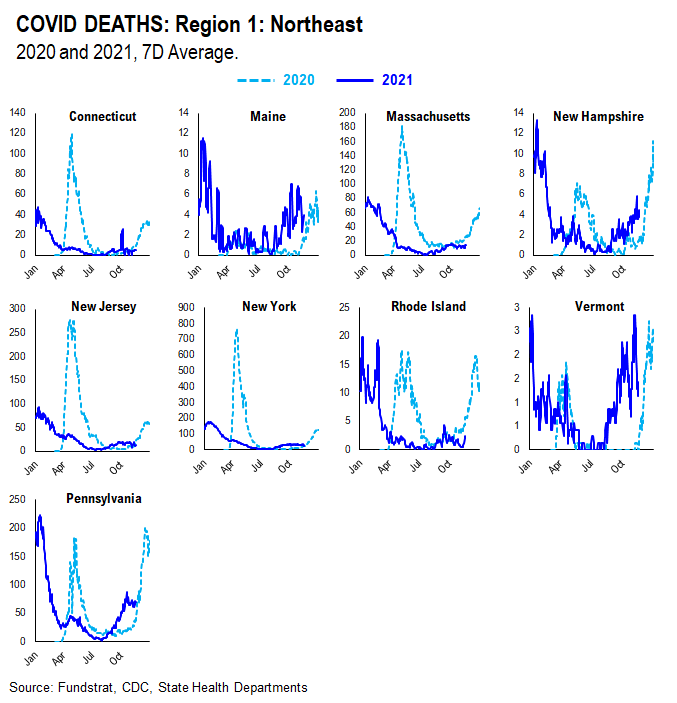
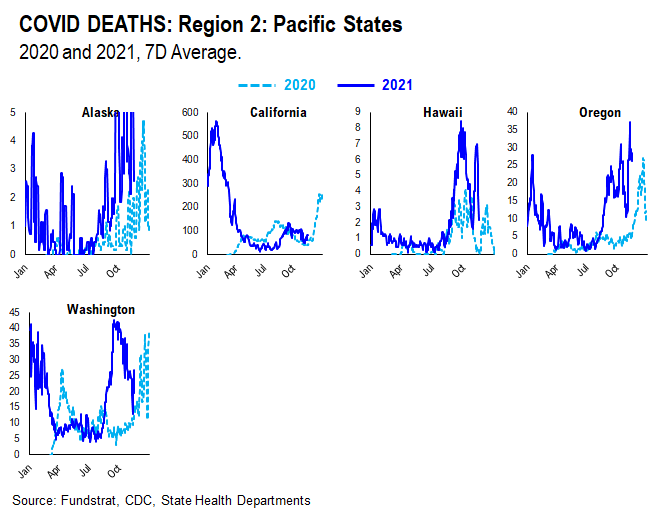
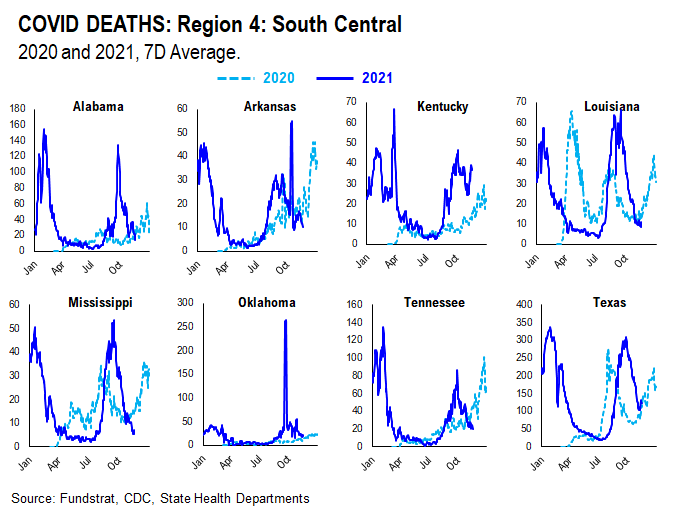
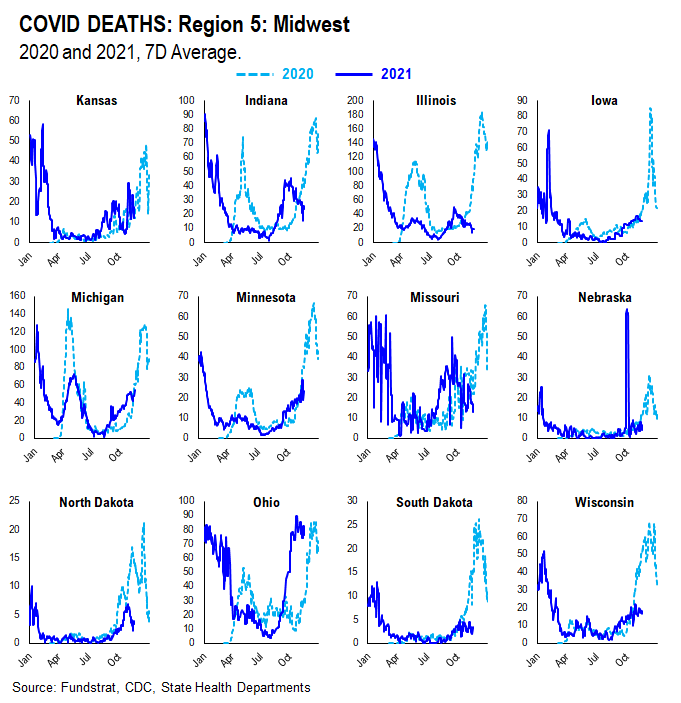
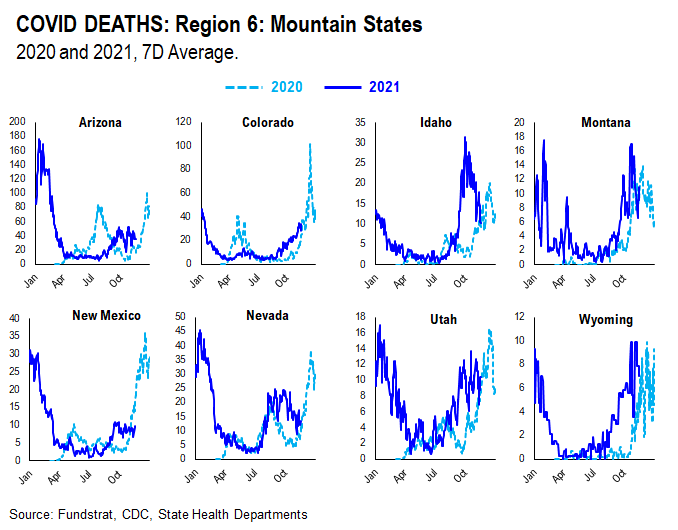
We created this section within our COVID update which tracks and compare the case, hospitalization, and death trends in both 2020 and 2021 at the state level. We grouped states geographically as they tend to trend similarly.
CASES
It seems as if the main factor contributing to current case trends right now is outdoor temperature. During the Summer, outdoor activities are generally increased in the northern states as the weather becomes nicer. In southern states, on the other hand, it becomes too hot and indoor activities are increased. As such, northern state cases didn’t spike much during Summer 2020 while southern state cases did. Currently, northern state cases are showing a slight spike, especially when compared to Summer 2020. This could be attributed to the introduction of the more transmissible Delta variant and the lifting of restrictions combined with pent up demand for indoor activities.
HOSPITALIZATION
Current hospitalizations appear to be similar or less than Summer 2020 rates in most states. This is likely due to increased vaccination rates and the vaccine’s ability to reduce the severity of the virus.
DEATHS
Current death rates appear to be scattered compared to 2020 rates. This is likely due to varying vaccination rates in each state. States with higher vaccination rates seem to have lower death rates given the vaccine’s ability to reduce the severity of the virus; states with lower vaccination rates seem to have higher death rates.
More from the author
Articles Read 1/2
🎁 Unlock 1 extra article by joining our Community!
Stay up to date with the latest articles. You’ll even get special recommendations weekly.
Already have an account? Sign In a16371-968a8b-04683f-436c93-b799ef
Already have an account? Sign In a16371-968a8b-04683f-436c93-b799ef

