

The fact UK Delta surge lasted 45 days remains important "break point" but we expect investors to remain wary

Click HERE to access the FSInsight COVID-19 Daily Chartbook.
We are shifting to a 4-day a week publication schedule:
- Monday
- Tuesday
- Wednesday
- SKIP THURSDAY
- Friday
STRATEGY: Investors likely remain wary, but key remains UK delta surge last 45 days
Fed likely dovish due to Delta risks…
The FOMC is meeting this week and the over-arching macro factor, in our view, remains COVID-19 risks and more specifically, the Delta variant. As we have highlighted in past reports, the Delta variant is now the dominant variant throughout developed markets. And strangely, the Delta variants seems to have eliminated other variants in these regions — it is nearly 100% of cases in the UK.
And any “hot readings” of incoming economic data and inflationary signals are tempered by the macro risks posed by the Delta variant, and future mutations of COVID-19. Therefore, we think the probabilities favor the Fed erring on the side of accommodation/dovishness. This is obviously not a radical observation. But nevertheless, highlights that the delta variant is creating and underlying support for risk assets.
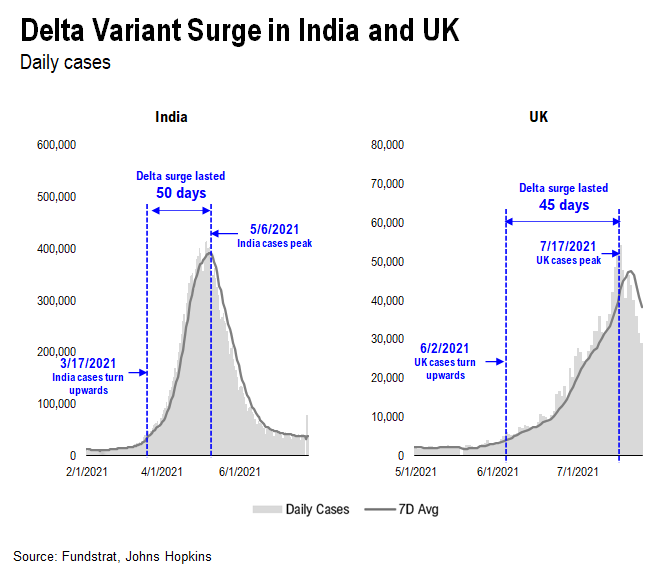
…India delta surge lasted about 50 days, UK surge lasted 45 days
We think one of the most important developments in the past few weeks is the fact that the UK saw Delta COVID-19 surge peak after 45 days — this while the UK did not impose any new restrictive measures.
– while this may not be the US experience (could US surge last longer)?
– the fact that Delta ran its course after 45 days is key
– UK vaccine penetration is similar to the US
Interestingly, the Delta surge in India also lasted about 50 days. This is what is interesting:
– Delta is highly contagious with R0 of >9
– Viral load is 1,000X other variants
– Higher R0 might also mean Delta runs its course sooner (exhausting host bodies)
As a point of perspective, this suggests to me that Delta will perhaps run its course faster than many expect.
In fact, Dr. Scott Gottlieb has made several comments regarding the possibility that Delta might run its course sooner than we expect. As noted below, he thinks we could be 2-3 weeks away from a peak.
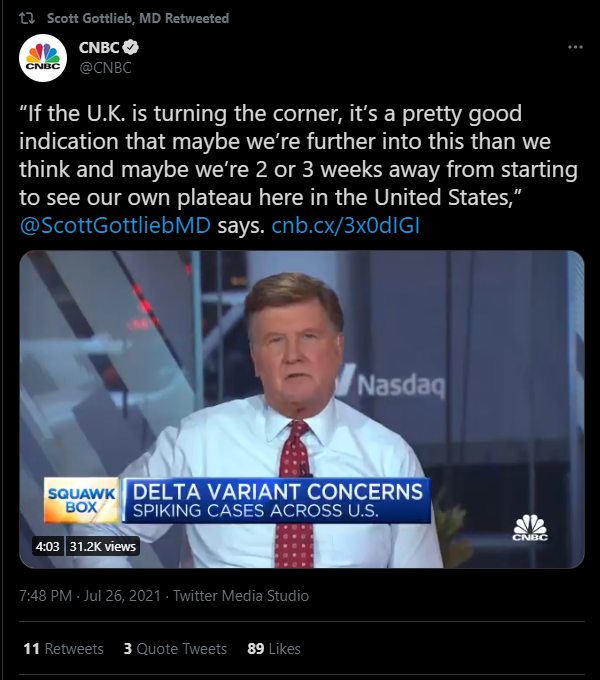
“If the U.K. is turning the corner, it’s a pretty good indication that maybe we’re further into this than we think and maybe we’re 2 or 3 weeks away from starting to see our own plateau here in the United States,” @ScottGottliebMD says. https://t.co/t1SToXji9kpic.twitter.com/RIT11cpbob
— CNBC (@CNBC) July 26, 2021
US cases still surging and likely to exceed 100,000 before peaking
US COVID-19 cases are still surging and as we noted in June 2021, we thought that US cases would likely surge towards >100,000 following the surge seen in the UK.
– US cases might surge for next 12 days, or so
– peaking at >100,000
But similar to UK, this means the Delta variant will run its course in the US

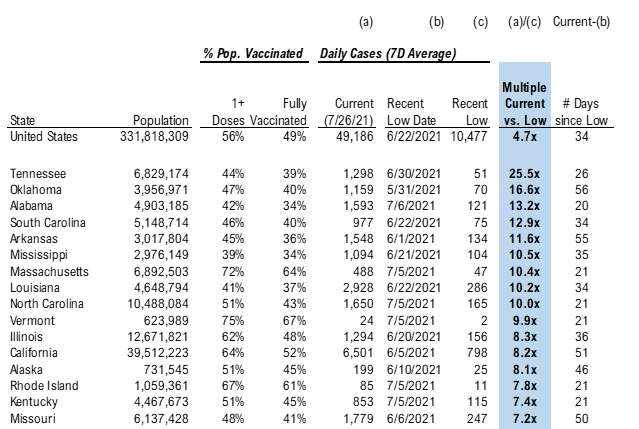
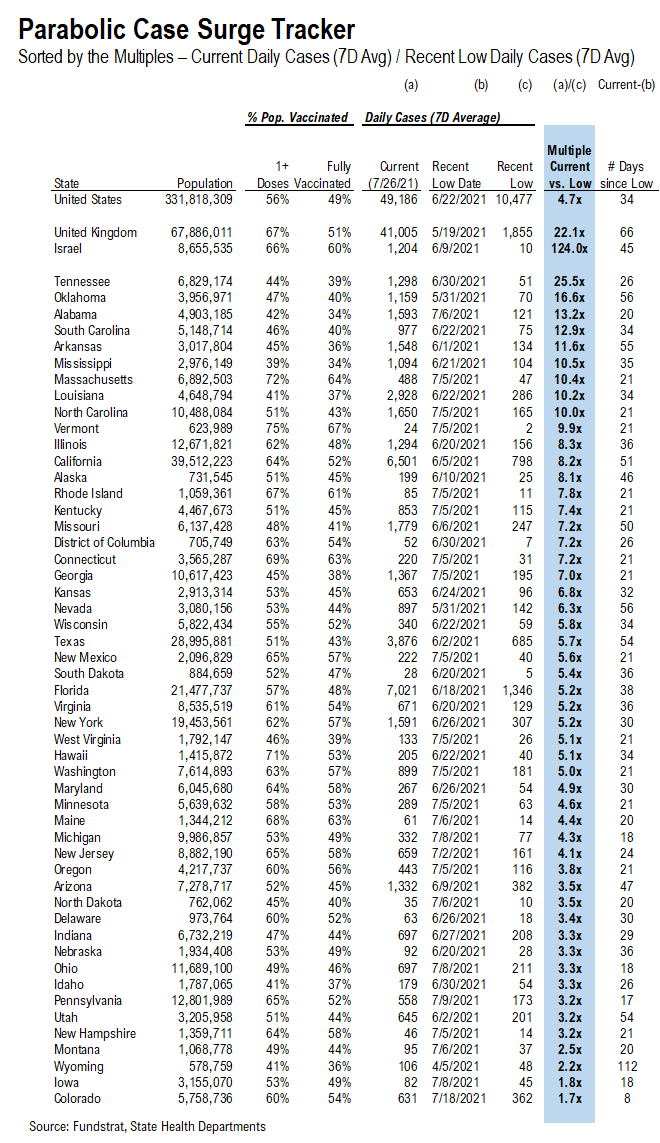
Already many US states have seen a surge in cases versus the low.
– biggest jump is Tennessee 26X
– OK and AL close behind
– OK surge has lasted 56 days, matched by AR at 55 days
The takeaway is that each US state has its own cycle of case surges. And as the complete table later in this note shows, most states are several weeks into this surge. So we don’t have to think this will last for infinity.
– the risk is that a new mutation takes place in the US among the “unvaccinated” and
– and this extends the surge
Source: Fundstrat
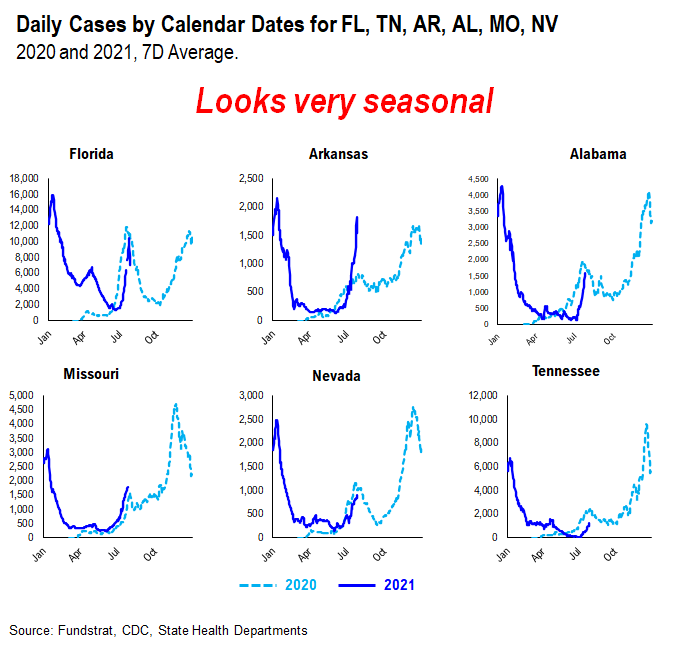
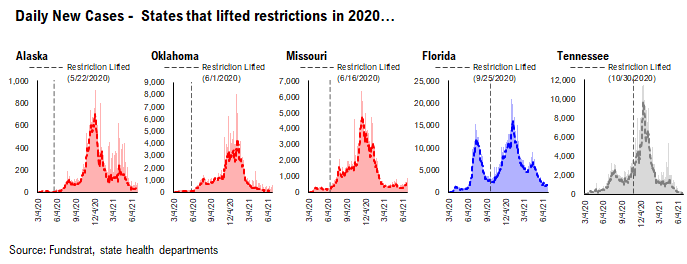
…remarkable seasonality to states with biggest surges — suggesting peak in next week or so
Below are 6 states with meaningful surges. And we compare the 2021 cases versus the same day in 2020.
– the states FL, AR, AL, MO, NV, TN
– see the striking seasonality?
– in every case but AR, the 2021 surge is not worse than 2020
– If 2020 is a template, these surges will soon end
Thus, we think the odds are high that we could see some states see cases rollover even sooner. Like this week.
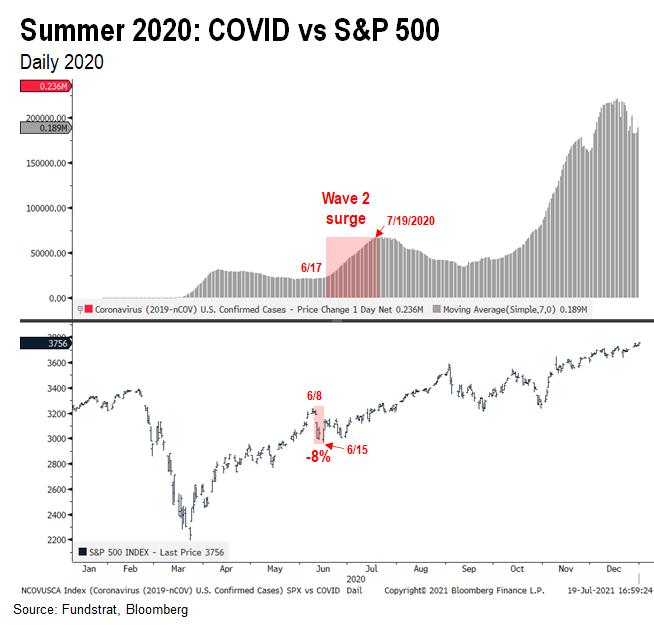
STRATEGY: In Wave 2 during 2020, S&P 500 bottomed well ahead of the Wave 2 peak
Just to repeat a point we have made in the past. The S&P 500 has bottomed before the COVID-19 wave peaks. Given we are looking at “summer seasonality” the 2020 Wave 2 peak:
– Wave 2 peaked 7/19/2021
– S&P 500 bottomed on 6/15
– 34 days before Wave 2 peaked
– there was a minor “higher low” about 2 weeks later
BOTTOM LINE: Risk-on seems appropriate, especially if Fed remains dovish (our expectation)
But you get the picture. The S&P 500 bottoms well ahead of the COVID-19 peaks.
– in 2021, we think the UK cases is the key template
– the rollover over of UK cases is strongly arguing for risk-on
– US seasonality is suggesting many states will see a peak in the current surge soon
– FOMC is also likely to err on the dovish side
So, we think this marks a reversal for Epicenter stocks. They have been crushed for 45 days due to the Delta surge.
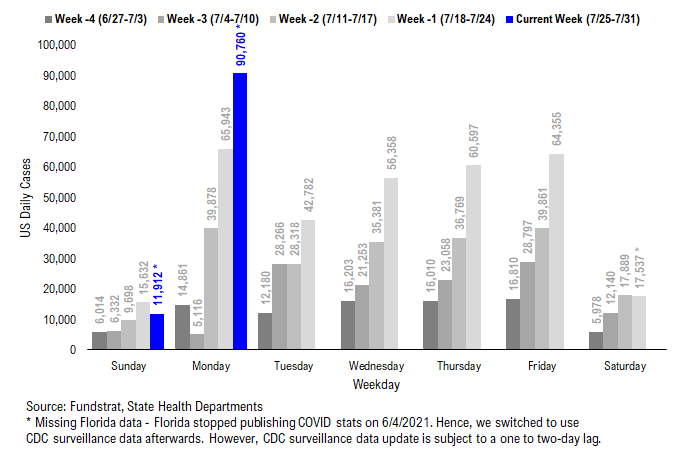
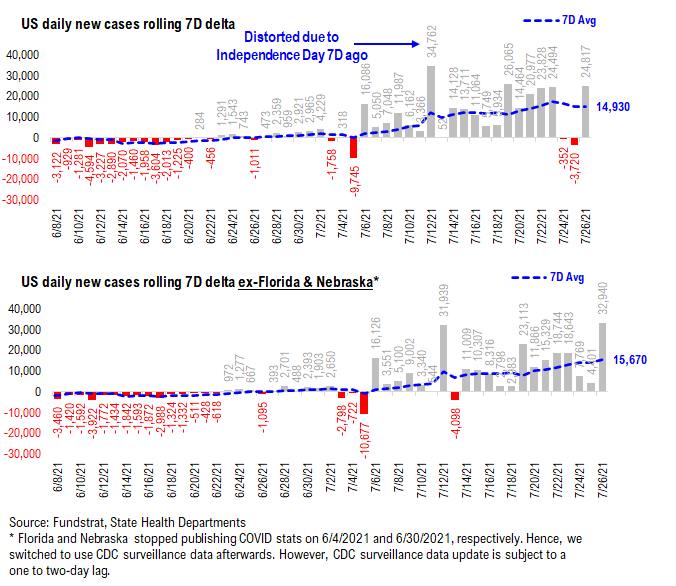
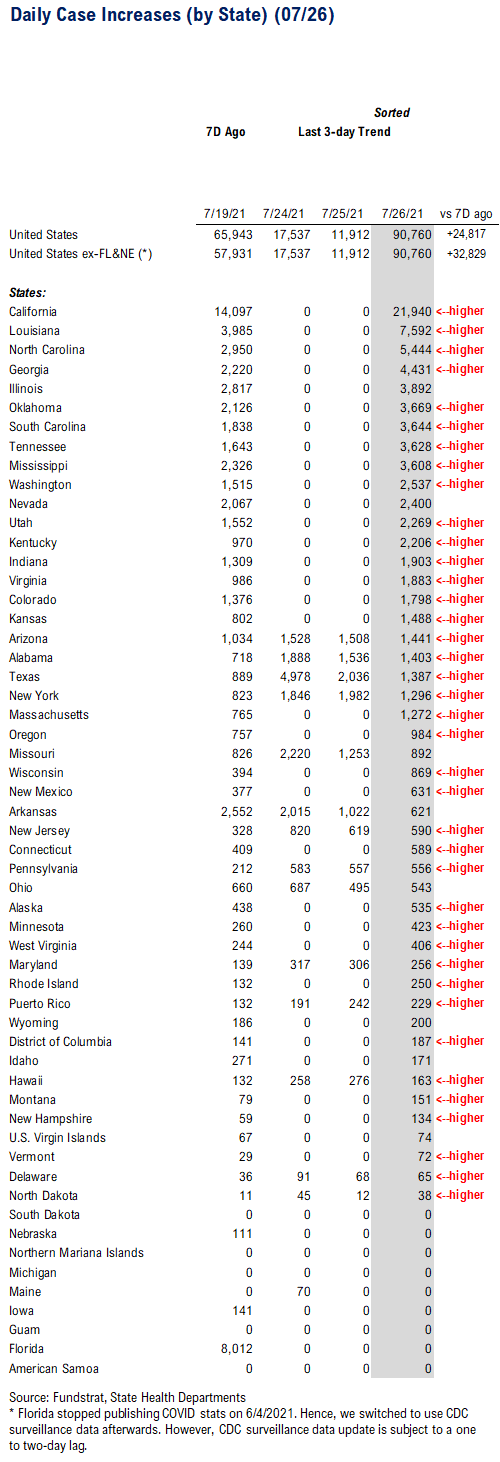
POINT 1: Daily COVID-19 cases 90,760, up +4,290 (ex-FL&NE) vs 7D ago… 7D delta (the speed of case rise) has been slowly rising over the past week…
_____________________________
Current Trends — COVID-19 cases:
– Daily cases 90,760 vs 65,943 7D ago, up +24,817
– Daily cases ex-FL&NE 90,760 vs 57,931 7D ago, up +32,829
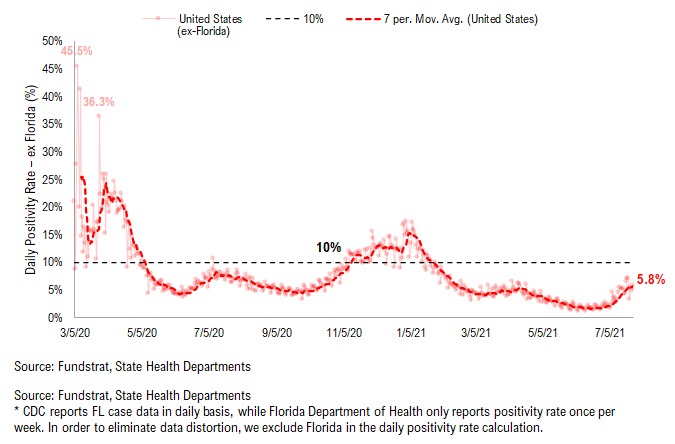
– 7D positivity rate 5.8% vs 4.9% 7D ago
– Hospitalized patients 33,540, up +38% vs 7D ago
– Daily deaths 273, up +7.3% vs 7D ago
_____________________________
*** Florida and Nebraska stopped publishing daily COVID stats updates on 6/4 and 6/30, respectively. We switched to use CDC surveillance data as the substitute. However, since CDC surveillance data is subject to a one-to-two day lag, we added a “US ex-FL&NE” in our daily cases and 7D delta sections in order to demonstrate a more comparable COVID development.
The latest COVID daily cases came in at 90,760, up +32,829 (ex-FL&NE). Monday’s spike in daily cases is primarily due to the fact that over 2/3 of US states no longer report COVID stats over the weekend. And hence, daily cases on Monday reflect the total new cases over the past three days. That said, the 90,000 new cases remind us that COVID, or more specifically the Delta variant, is still spreading across the country. Considering the delayed data of Florida, the case figure should be about 100,000. The 7D delta in daily cases has been gradually rising over the past week and now is at ~15,000. As we noted, if US follows the same pattern as UK and India, US could be peaking in next two to three weeks. Hence, based on current speed of case rise, US cases (7D average) could reach 150,000 before starting to roll over.
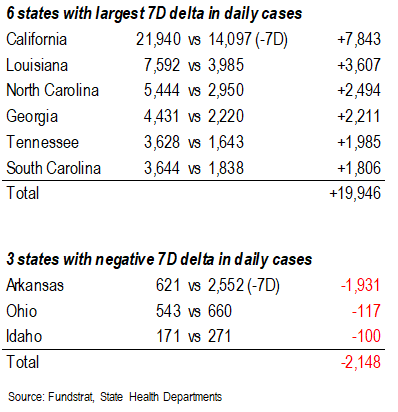
At state level, TN, OK, AL, SC, AR, MS, MA, LA, and NC are the states with the largest increase in daily cases compared to their recent lows (as shown in the “parabolic” tracker below), and all 8 states except MA and NC have less than 50% of their populations vaccinated with at least one dose, and 40% of their population fully vaccinated. This is consistent with what media have been reported regarding the majority of new cases being amongst unvaccinated individuals. Therefore, the COVID developments (both the case and vaccination trends) in these states along with the other low vaccinated states (such as GA, ID, WY, ND, IN) are worth watching.
7D delta in daily cases has been slowly rising, now at ~16,000…
The 7D delta in daily cases has been slowly rising over the past week. A rising 7D delta means the speed of the case rise is increasing. But given the “slow“ speed, the rise is not parabolic yet (at least so far). However, the future is uncertain, so cases could rise rapidly. We will be closely watching this metric.
Low vaccinated states seem to have a larger increase in daily cases compared to their recent low…
Below, we added a new section called “Parabolic Case Surge Tracker” to monitor the possible parabolic surge in daily case figures. In the table, we included both the vaccine penetration and the recent case trend for 50 US states + DC. The table is sorted by the multiple of their current daily cases divided by their recent low in daily cases.
– The states with higher ranks are the states that have seen a more significant rise in daily cases
– We also calculated the number of days between now and the recent low date; a state with a high multiple but low number of days since its low means the state is facing a relatively rapid surge in daily cases
– The US as a whole, UK, and Israel are also shown at the top as a reference
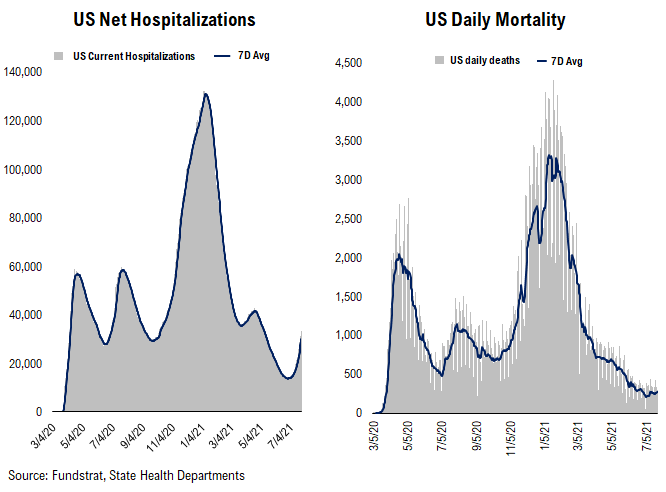
Current hospitalization and positivity rates are rising… Daily deaths remain flat…
Below we show the aggregate number of patients hospitalized due to COVID, daily mortality associated with COVID, and the daily positivity rate for COVID. As you can see, hospitalization and daily deaths are relatively low compared to the prior waves. However, with the recent increase in daily cases, current hospitalization is clearly turning upwards. Regarding positivity rate, it recently exceeded 5%, which is higher than the positivity rate we observed during the “mini” wave this April and significantly higher than the recent low of <2%. Daily deaths seem to be still flat, but it could reverse if case figures continue to rise.
POINT 2: VACCINE: vaccination pace has been slightly rising over the past few days…
_____________________________
Current Trends — Vaccinations:
– avg 0.6 million this past week vs 0.5 million last week
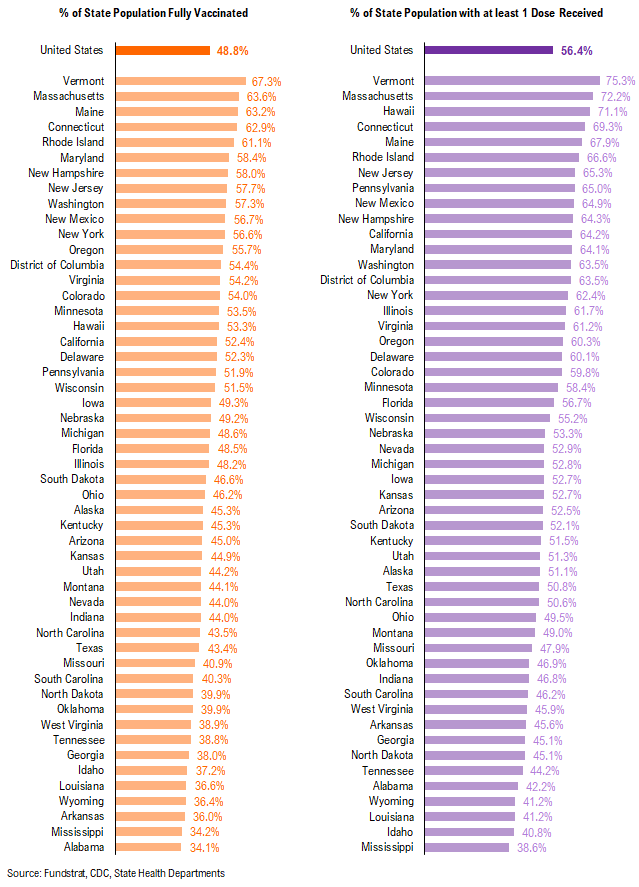
– overall, 48.8% fully vaccinated, 56.4% 1-dose+ received
_____________________________
Vaccination frontier update –> all states now near or above 80% combined penetration (vaccines + infections)
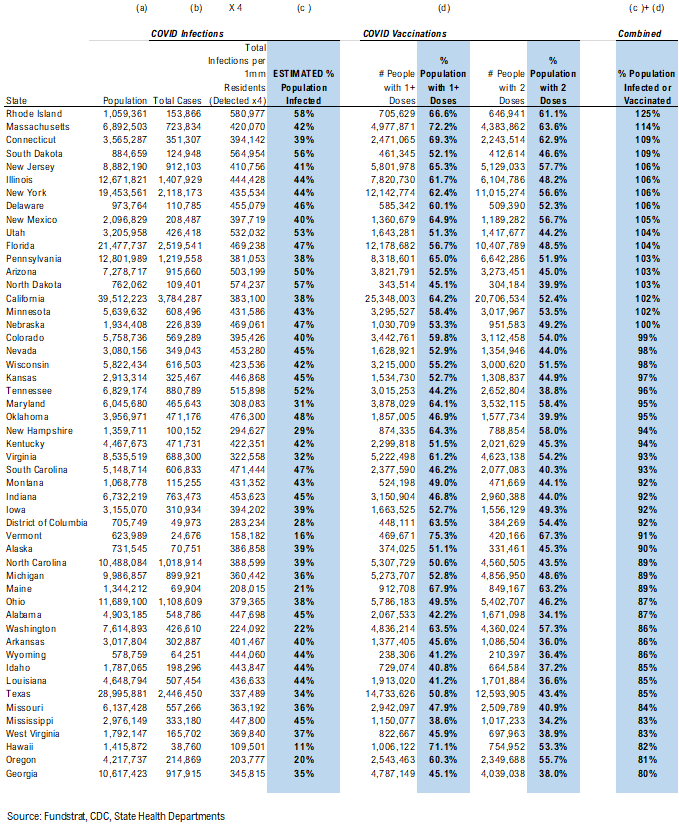
Below we sorted the states by the combined penetration (vaccinations + infections). The assumption is that a state with higher combined penetration is likely to be closer to herd immunity, and therefore, less likely to see a parabolic surge in daily cases and deaths. Please note that this “combined penetration” metric can be over 100%, as infected people could also be vaccinated (actually recommended by CDC).
– Currently, all states are near or above 80% combined penetration
– RI, MA, SD, CT, NJ, IL, NY, DE, NM, UT, PA, ND, AZ, MN, CA, FL, NE are now above 100% combined penetration (vaccines + infections). Again, this metric can be over 100%, as infected people could also be vaccinated. But 100% combined penetration does not mean that the entire population within each state is either infected or vaccinated.
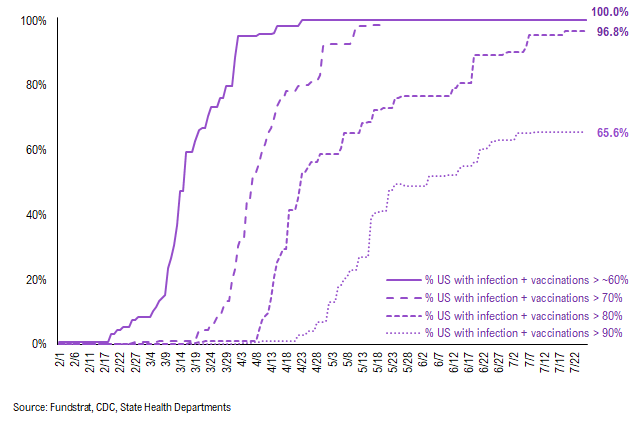
Below is a diffusion chart that shows the % of US states (based on state population) that have reached the combined penetration >60%/70%/80%/90%. As you can see, all states have reached 60% and 70% combined vaccination + infection. 96.8% of US states (based on state population) have seen combined infection & vaccination >80% and 65.6% of US states have seen combined infection & vaccination >90%.
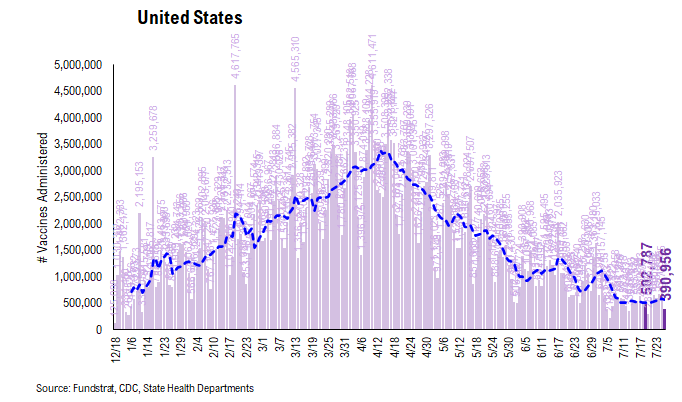
There were a total of 390,956 doses administered reported on Monday. Over the past two weeks, the vaccination pace has been mostly flat, but appears to be slightly rising recently. Perhaps people are becoming more inclined to get vaccinated over growing delta variant concerns. But this is actually a good sign. Admittedly, nearly 2/3 of the US population eligible (age 12+) to receive COVID vaccines have already received at least one dose. For some people among the remaining 1/3, vaccine hesitancy concerns might not easily be reversed. But in order to prevent another parabolic surge in daily cases, hospitalizations, and fatalities, getting more people fully vaccinated remains the key.
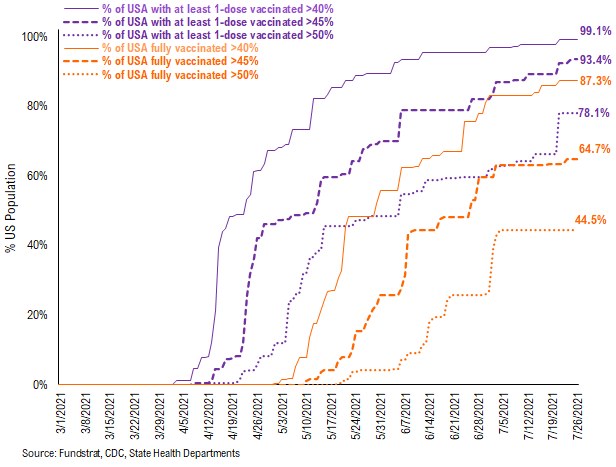
99.1% of the US has seen 1-dose penetration >40%…
To better illustrate the actual footprint of the US vaccination effort, we have a time series showing the percent of the US with at least 45%/45%/50% of its residents fully vaccinated, displayed as the orange line on the chart. Currently, 87.3% of US states have seen 40% of their residents fully vaccinated. However, when looking at the percentage of the US with at least 45% of its residents fully vaccinated, this figure is 64.7%. And only 44.5% of US (by state population) have seen 50% of its residents fully vaccinated.
– While 99.1% of US states have seen vaccine penetration >40%, 93.4% of them have seen 1 dose penetration >45% and 78.1% of them have seen 1 dose penetration > 50%.
– 87.3% of the US has at least 40% of its residents fully vaccinated, However, only 64.7% of US has fully vaccinated >45% and 44.5% of US has fully vaccinated >50%.
This is the state by state data below, showing information for individuals with one dose and two doses.
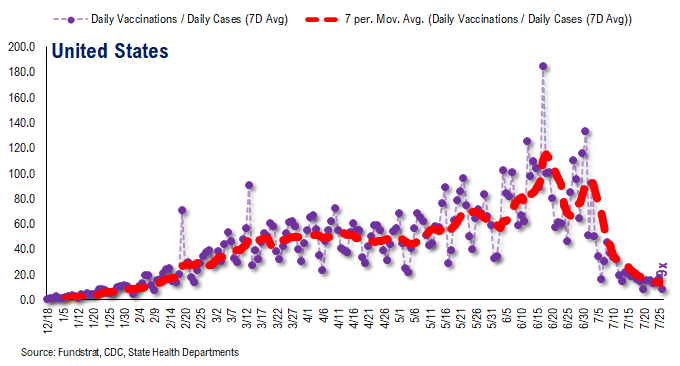
The ratio of vaccinations/ daily confirmed cases has been falling significantly (red line is 7D moving avg). Both the surge in daily cases and decrease in daily vaccines administered contributed to this.
– the 7D moving average is about ~15 for the past few days
– this means 15 vaccines dosed for every 1 confirmed case
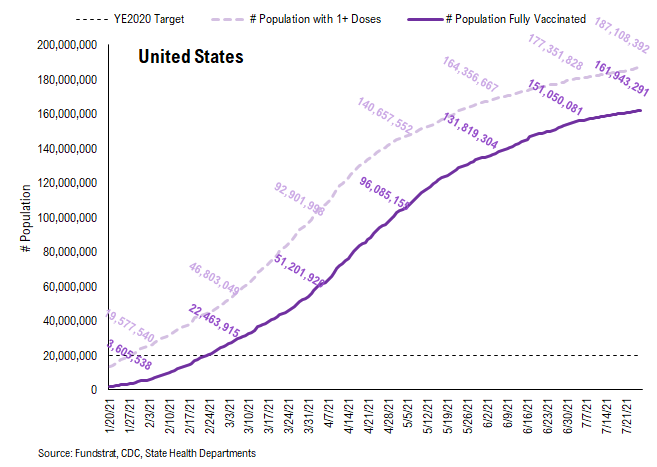
In total, 340 million vaccine doses have been administered across the country. Specifically, 187 million Americans (56% of US population) have received at least 1 dose of the vaccine. And 162 million Americans (49% of US population) are fully vaccinated.
POINT 3: Tracking restrictions lifting and subsequent effects in individual states
Point #3 focuses primarily on tracking the lifting of restrictions, as states have eased the majority of mandates. Keep in mind, easing/lifting restrictions are contingent upon state of emergency ordinances being renewed.
– States in groups 1 and 2 represent states that let their emergency ordinances expire, or that never had one in the first place
– Note: IL and HI are not listed. This is because restrictions lifting is determined at the county / island level, and no statewide policy will be established to lift restrictions until a full reopening
So there is a spectrum of approaches. Our team is listing 3 tiers of states and these are shown below.
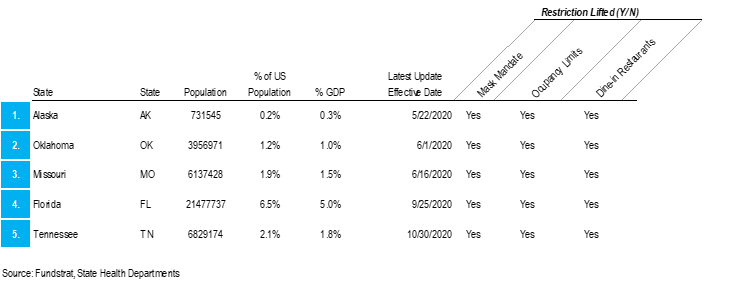
– states that eased all restrictions in 2020: AK, OK, MO, FL, TN
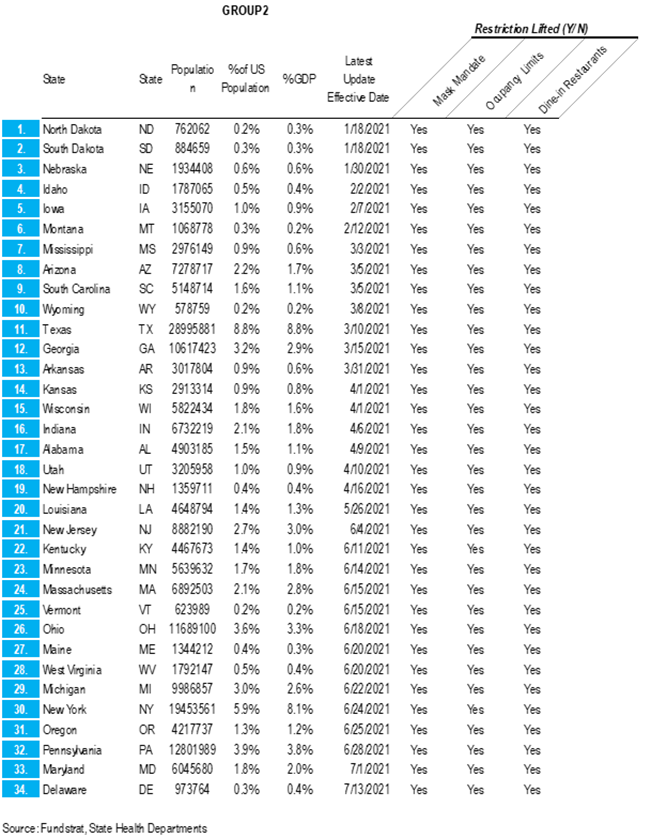
– states that have eased all restrictions in 2021 to now: ND, SD, NE, ID, IA, MT, MS, AZ, SC, WY, TX, GA, AR, KS, WI, IN, AL, UT, NH, LA, NJ, KY, MN, MA, VT, OH, WV, ME, MI, NY, OR, PA, MD, DE
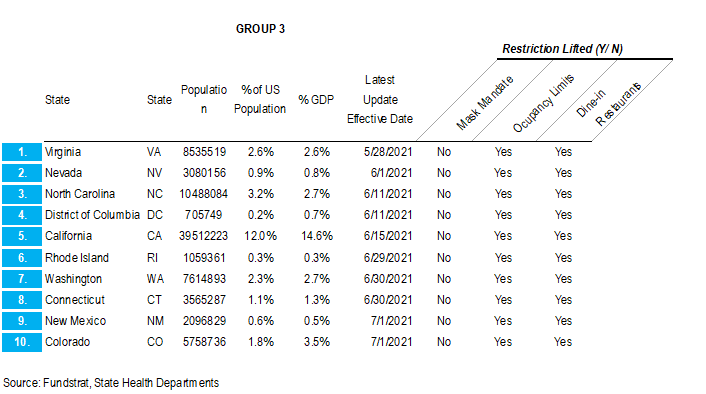
– states that are still easing restrictions in 2021: WA, NC, CA, NM, CO, NV, CT, VA, RI, DC
GROUP 1: States that lifted restrictions in 2020…
The daily case trends in these states are impressive and it is difficult to say that lifting restrictions has actually caused a new wave of cases because the case trends in these states look like other states.
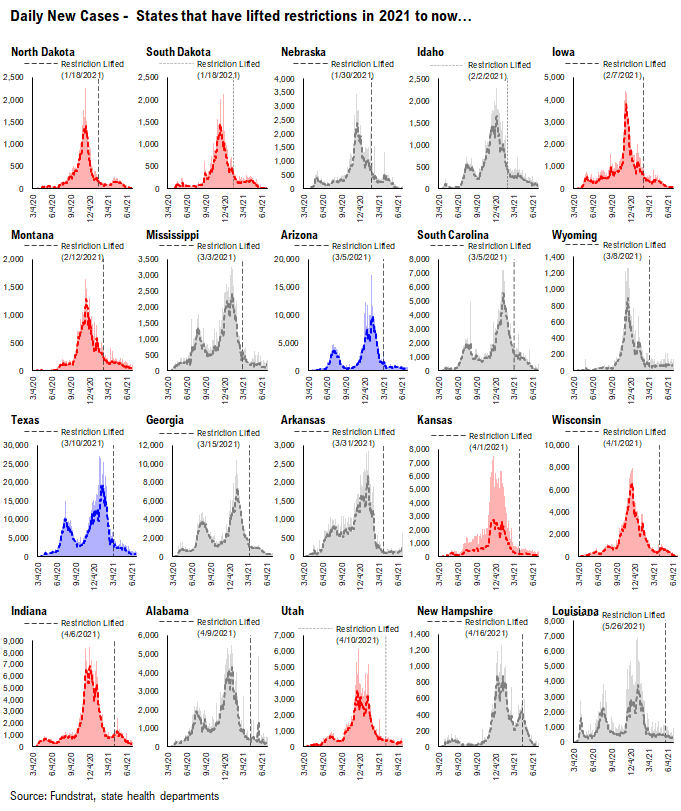
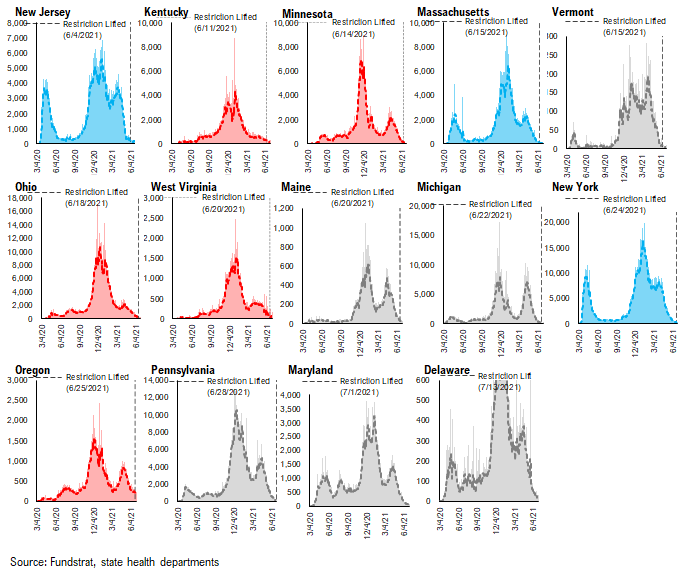
GROUP 2: States that have lifted restrictions in 2021 to now…
Similar to the list of states above, the daily case trends in these states are impressive and it seems that lifting restrictions hasn’t caused an increase in cases.
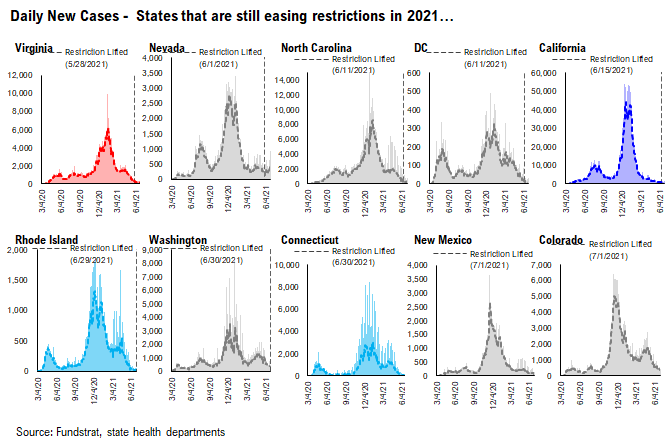
GROUP 3: States that are still easing restrictions in 2021…
These states have begun to lift restrictions, but have yet to ease all restrictions. The date of each state’s most recent restrictions lifting is indicated on each chart. The case trends in these states have been mostly positive.
– Easing restrictions appears to have contributed to an increase in cases in several of these states, most drastically in OR, ME, WA, and MN
More from the author
Articles Read 1/2
🎁 Unlock 1 extra article by joining our Community!
Stay up to date with the latest articles. You’ll even get special recommendations weekly.
Already have an account? Sign In a2614b-d11954-bb3788-f0277a-8168ed
Already have an account? Sign In a2614b-d11954-bb3788-f0277a-8168ed

