

S&P 500 waterfall decline of 16% (5 mos) seen only 18 times since 1940 = signs closer to end of selloff

Fed policy is already “biting hard” after 3 hikes—on the margin, 3 more reasons inflation pressures might be peaking
Stocks continued their waterfall decline this past week, amplified by concerns of systemic risk as the crypto market took a gut punch. Many now believe a “hard landing” is baked in the cake — as Lawrence Summers, former Treasury Secretary told clients recently — whenever CPI is >4% and unemployment is <4%, there has never been anything but a hard landing.
- Is it any wonder there is only despair?
In meeting after meeting, we see a great sense of despair, skepticism, cynicism, and anger towards equities. And many believe there is just no place to hide.
So please don’t label us as stubborn if we view the risk/reward for equities as having improved in the past week. Before rolling your eyes and saying we are oblivious, there are 4 reasons we see this:
- a wave of layoffs is starting in tech world, which has been hardest hit by the higher cost of money
- housing market, on the fringe, is showing signs of weakening due to higher rates and will accelerate if layoffs hit
- core inflation, measured by core PCE, is running below 4% for each of the last 3 months = less pressure on Fed
- stock correlation has surged to 60%, according to RenMac, which historically points to strong gains next 3M
In all, this all supports the notion Fed policy is already biting hard (see our previous notes) and this could lead to Fed actually ending its policy of “tight” sooner.
Tech start-ups are most vulnerable to higher cost of money, and layoffs already started
This article in Techcrunch is one of many stories emerging about companies making layoffs. Start-ups are by natures, unprofitable endeavors at the earliest stages and essentially negative ROIC biz until they reach critical mass. Thus, low cost of money is particularly key for start-ups, which mainly focus on technology and consumer products. Thus, the surge in rates is raising cost of money and therefore slowing capital flow for start-ups.
- this is a quick feedback loop
- and startups are already cutting costs, doing layoffs and even outright shutting down

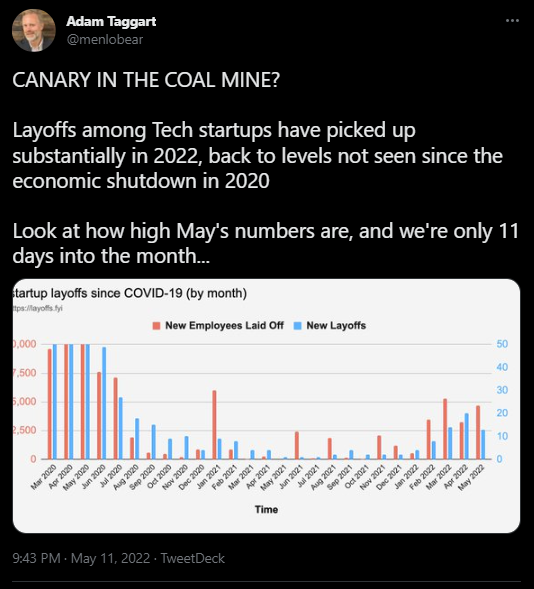
…tech layoffs are happening at a pace not seen since 2020 pandemic shutdowns
In fact, according to layoffs.fyi, the pace of layoffs is mirroring that seen during the pandemic shutdowns:
- latest layoffs are running at 5,000 per week recently
- in pandemic, layoffs were running at 10,000 per week
- this is a pretty bloody wave of layoffs
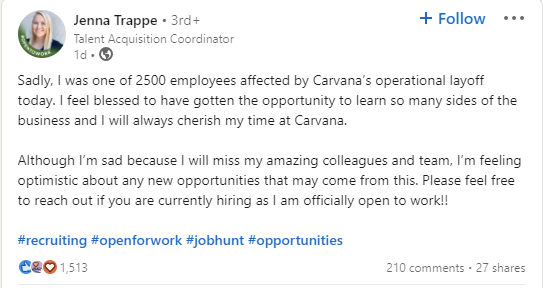
Just search on linkedin.com and you will see many posts such as this. Displaced and skilled workers getting heartbreaking notices.
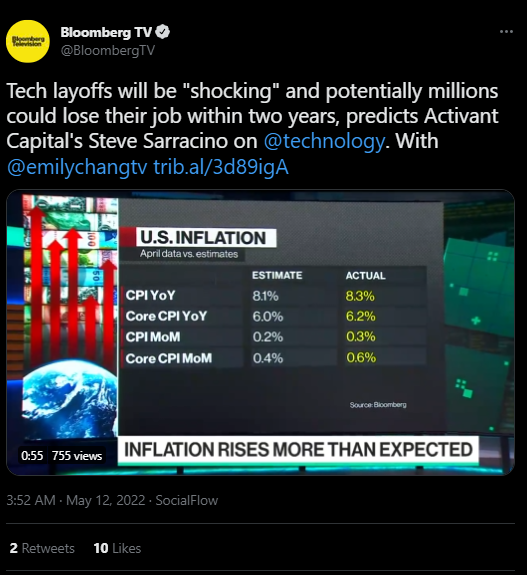
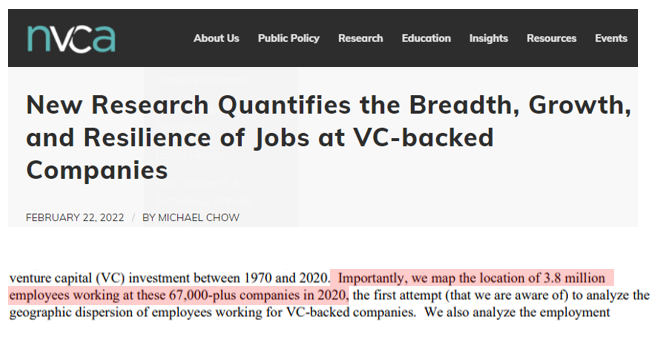
And many predict these losses could amount to millions of jobs. As we noted in several of our recent notes, according to NVAC (North American Venture Capital Association, I think), there are ~4 million Americans employed by venture-backed startups.
this is a similar claim made by Activant Capital’s Steve Sarracino
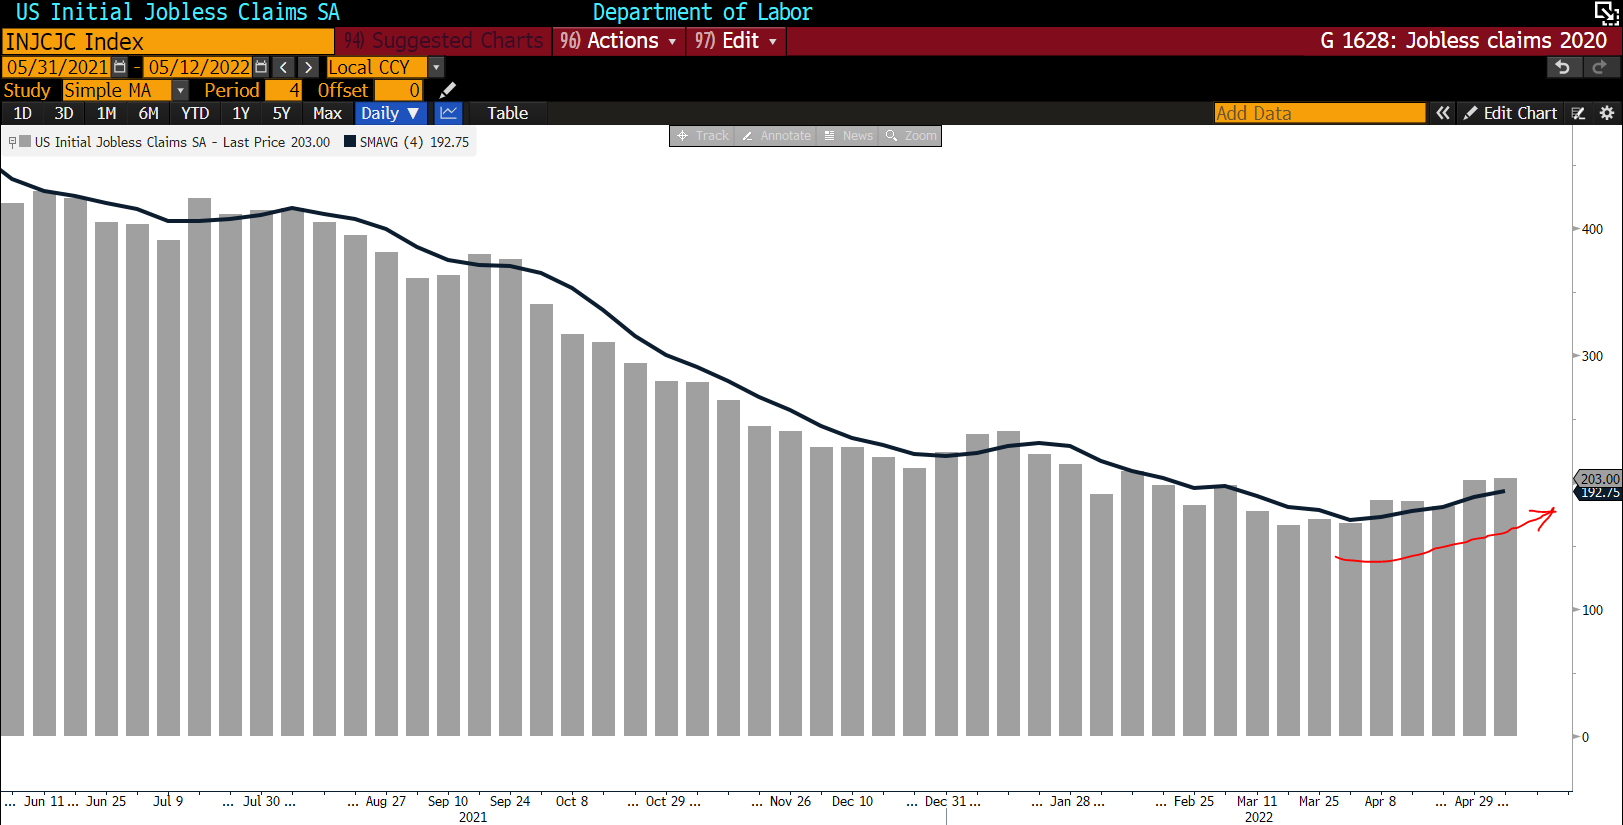
And jobless claims are curling upwards. It is only modest currently and it does not seem to be capturing the surge in tech layoffs yet:
- claims bottomed at 166,000 March 18th
- currently at 203,000 in the latest week
- this is a 37,000 rise in jobless claims
High-frequency data is showing cracks in housing demand = higher rates are biting
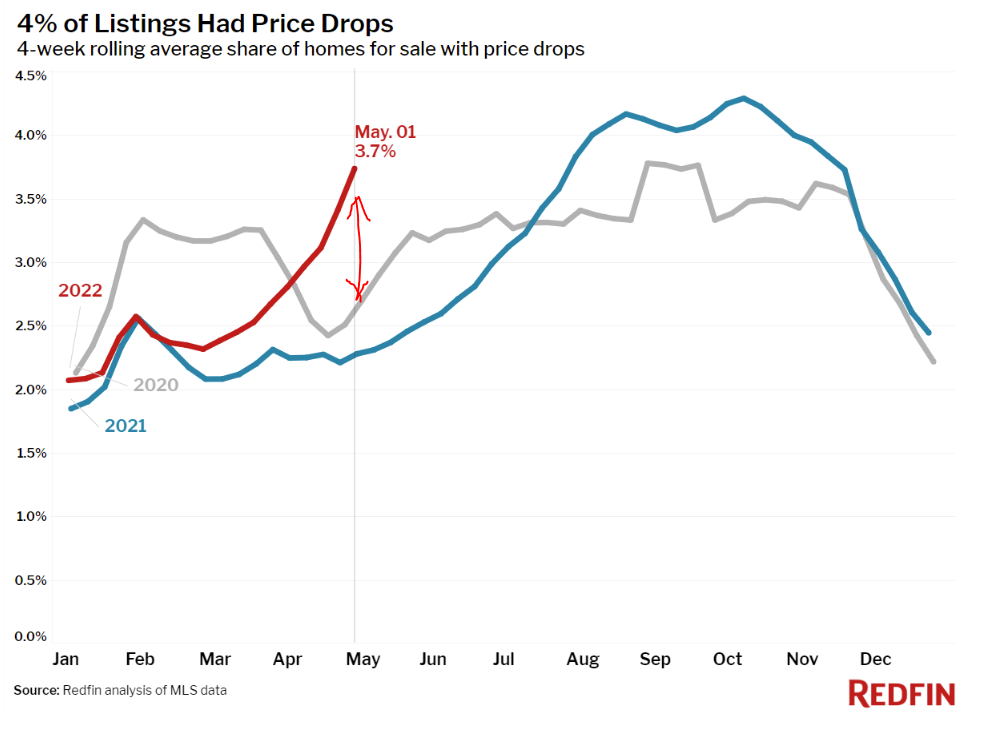
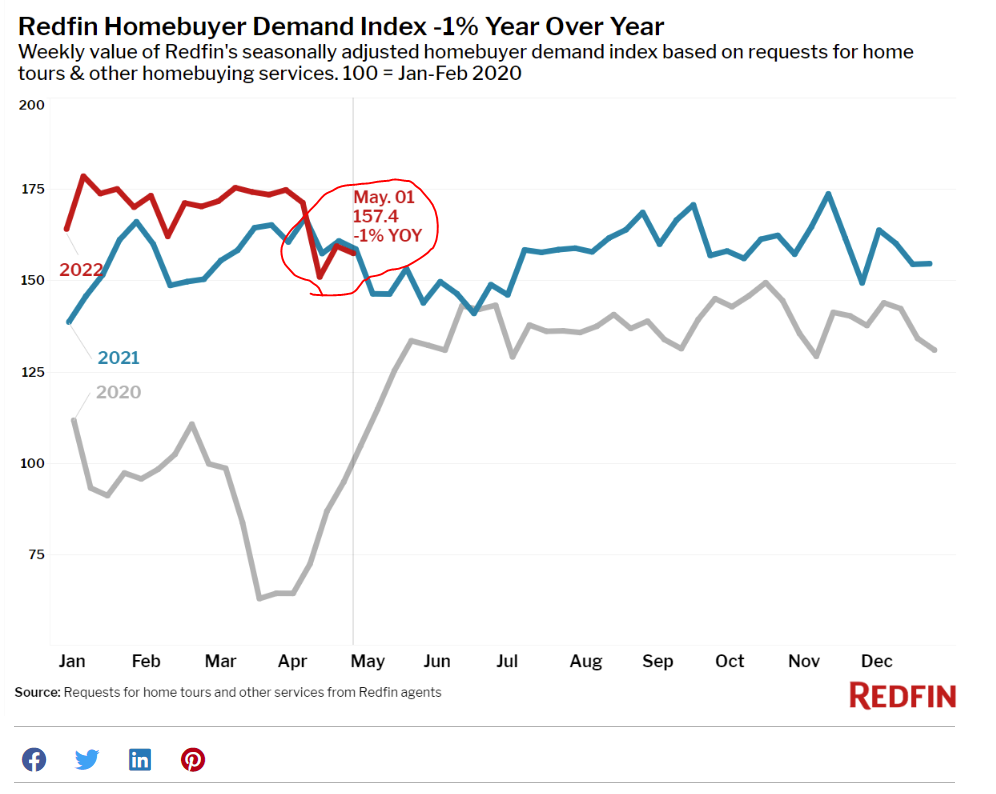
Another important area that is showing signs of weakness, at the margin, is housing. High-frequency data by real estate firm Redfin.com is showing home buying activity is cooling.
- but like inflation, it is cooling from a high level
- share of homes selling below asking jumped to 15% in May from 9% a year ago
- this is the highest jump since Redfin began tracking this in 2015
- higher mortgage rates and higher prices are impacting affordability
- weakness from job layoffs is not yet showing up
- but the Redfin report also has a few other incremental nuggets
We stick with our view that a lot of bad news is baked in, which means upside surprises have higher reactions
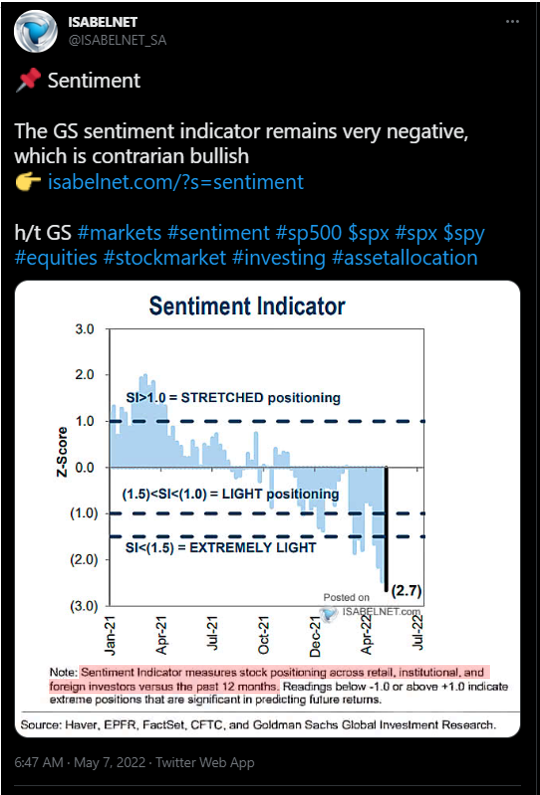
In other words, the above commentary supports our view that a lot of bad news is baked in. Take a look at the latest positioning data from Goldman Sachs (shared by @Isabelnet) which looks at the positioning of retail, institutional and foreign investors:
- positioning is -2.7 standard deviations below average currently
- -1.5 is considered extremely light
This is affirming what we just noted. Positioning is light and thus, incrementally positive data points can see an asymmetric reaction.
…JPMorgan’s analysis of equity risk premia supports this as well
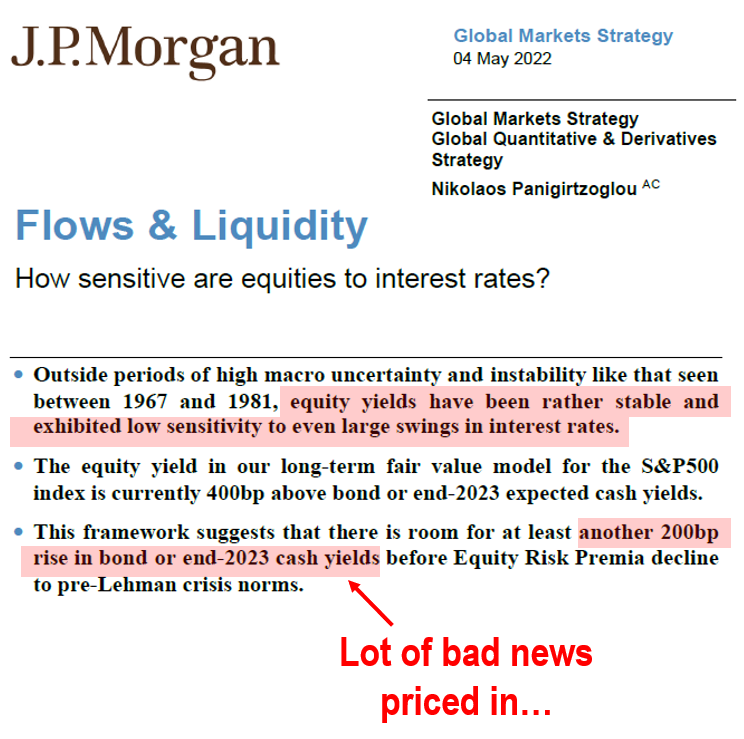
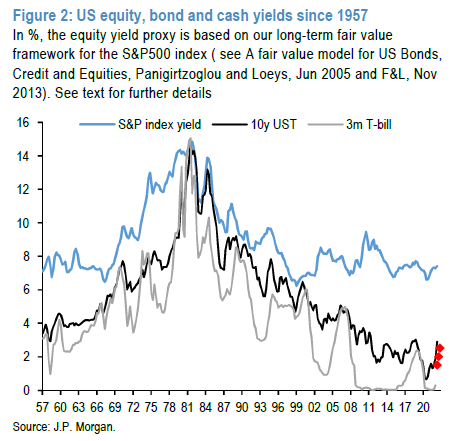
This is also supported by the latest JPMorgan Flows and Liquidity report. As the authors note:
- equity risk premia historically is quite stable since 1967, even with large swings in rates
- this is consistent with our analysis last week showing S&P 500 P/E was 18X when 10-yr rates were 5%
- JPMorgan suggests 10-yr rates could rise another 200bp (to 5%)
- and equity risk premia would only be equal to the pre-Lehman levels
In other words, their work supports that a lot of bad news is priced in. They also suggest that higher rates should not be compressing P/E (proxy for equity risk premia).
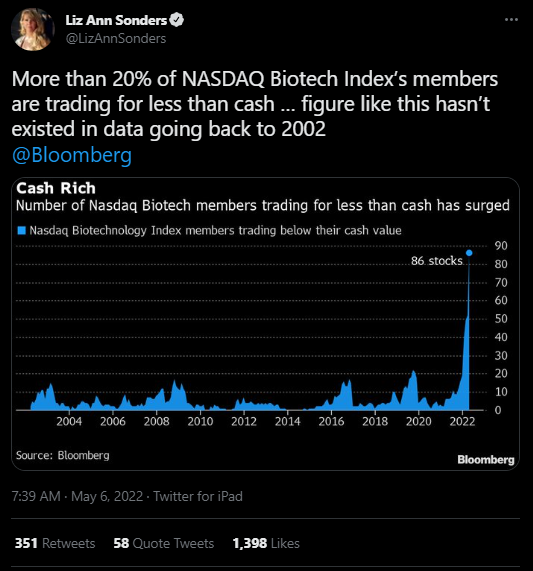
And similarly, valuations are surprisingly low for Biotech stocks (proxy for high beta). As Liz Ann Sonders notes:
- 20% of NASDAQ Biotech stocks are trading for less than cash
- wow
Tech wreck is going to lead to layoffs in venture-backed startups… which today employ ~4 million people
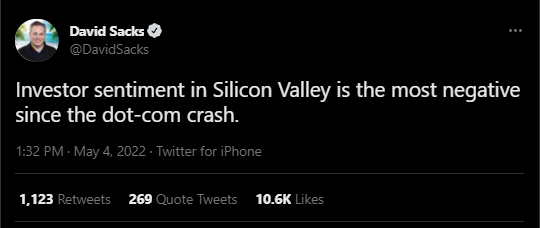
In our meetings last week in Atlanta, one client made an insightful point (thanks MM). He noted that the crushing decline of FAANG, will have massive second order impacts in Silicon Valley. After all, Facebook is the umbrella supporting social media. Netflix for streaming. Etc.
- As David Sacks notes below, he sees investor sentiment in Silicon Valley the worst since dot-com.
This could lead to sizable layoffs. According to North American Venture Capital Association (NVCA), venture-backed start ups employ ~4 million people in 67,000 companies.
- thus, if there is a downturn in Silicon Valley
- it is not just the fund LPs getting hit
- it is the employees working for these startups
And it is not just Silicon Valley. As the Business Insider article below notes, there is a way of layoffs sweeping across the US. This is something to watch.
- Fed has commented that this is the “tightest labor market” in history
- and while their metric of 2 openings for every available jobseeker supports this
- this is key to watch
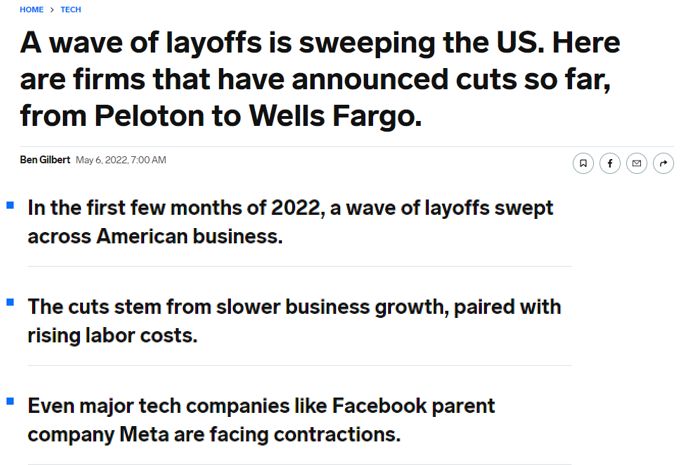
Figure: Themes in 2022 – “BEEF”
Per FSInsight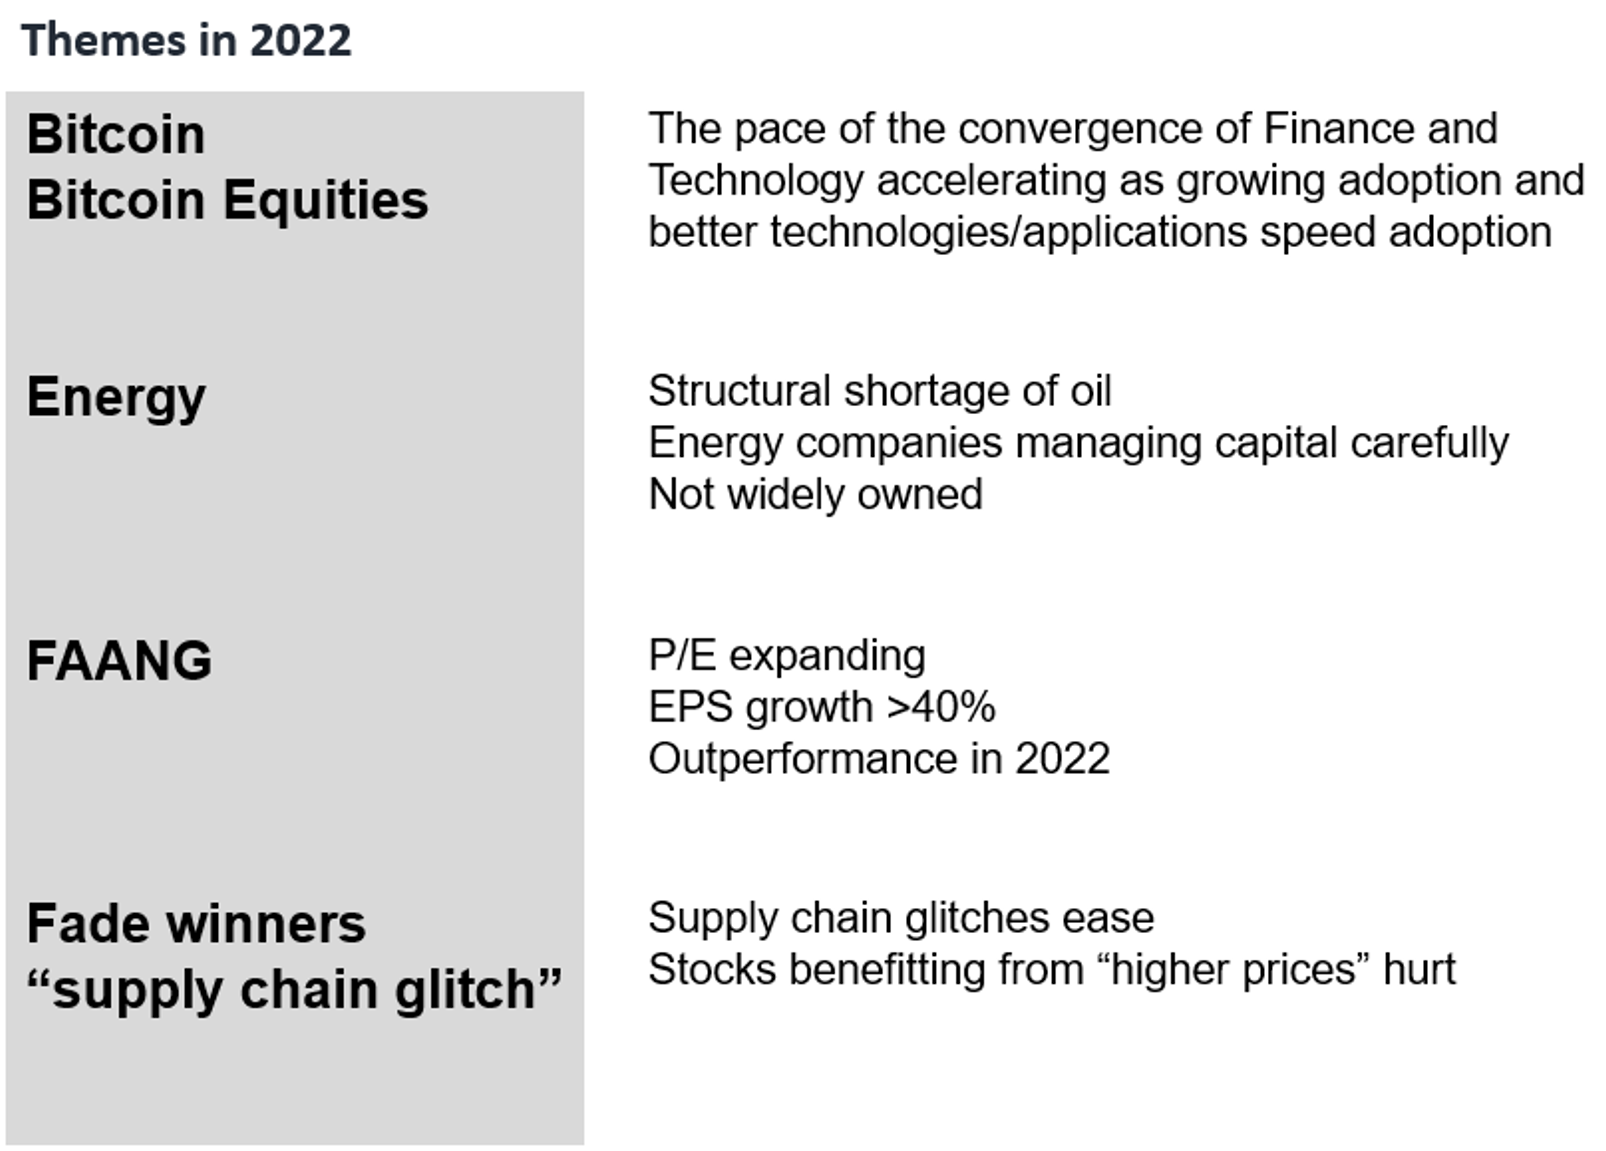
Figure: FSInsight Portfolio Strategy Summary – Relative to S&P 500
** Performance is calculated since strategy introduction, 1/10/2019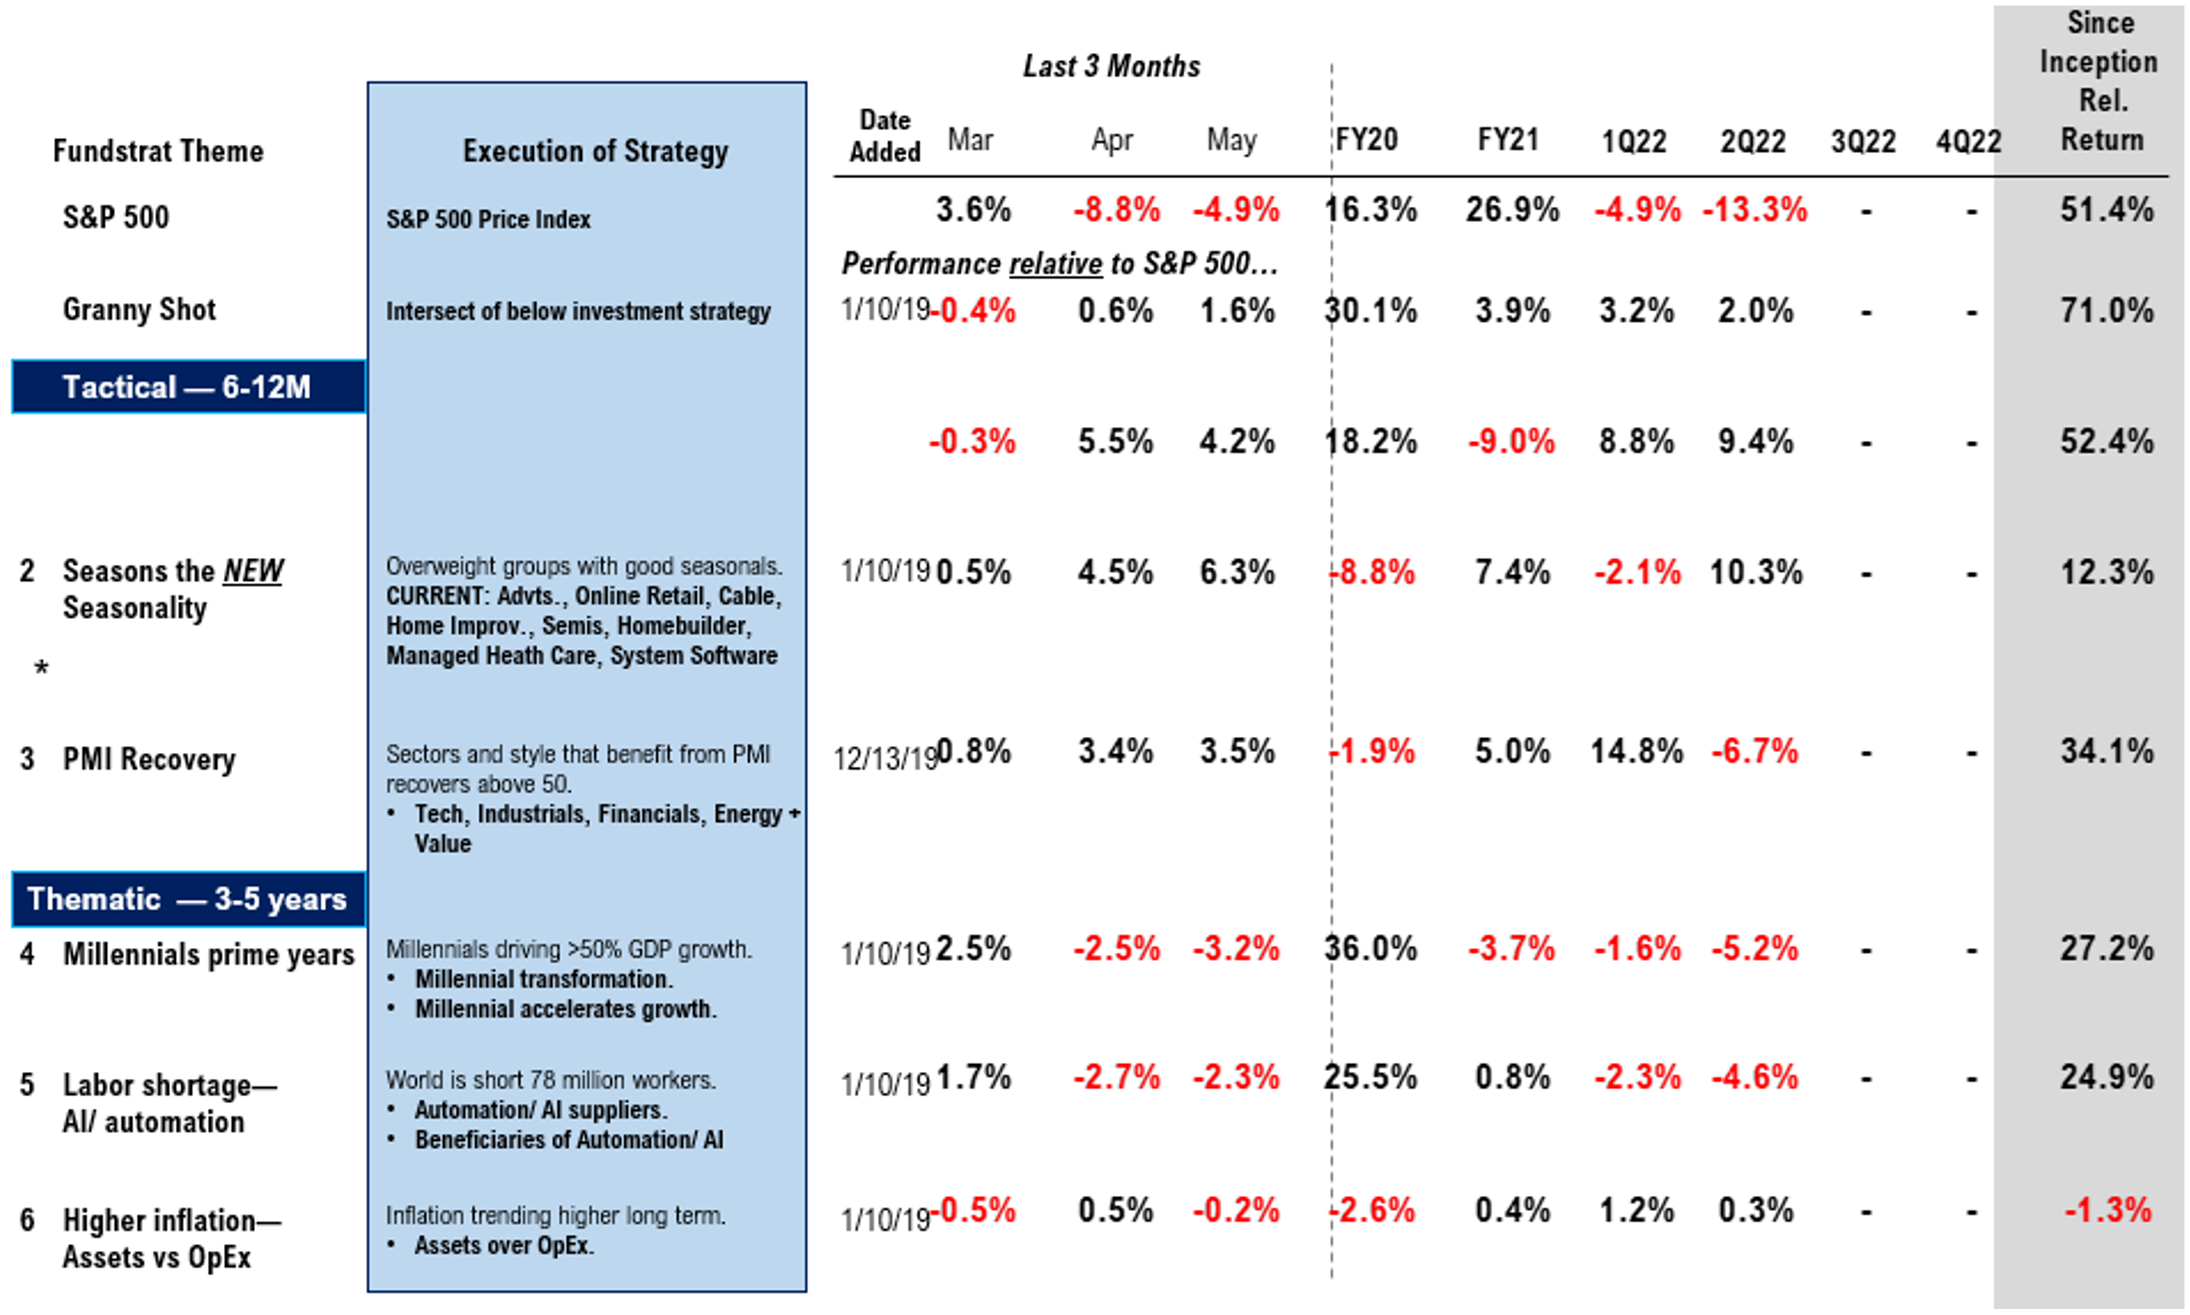
* Portfolio strategy introduced in December ’19 rebalance, replacing 2019 portfolio recommendation – “FANG in odd years”

