

Quad witching almost over. FOMC post-mortem, consensus probably right on "level of inflation" but not on "timing" --> Energy still our favorite sector

Click HERE to access the FSInsight COVID-19 Daily Chartbook.
We are shifting to a 4-day a week publication schedule:
- Monday
- Tuesday
- Wednesday
- SKIP THURSDAY
- Friday
STRATEGY: Quad witching almost over. FOMC post-mortem, consensus probably right on “level of inflation” but not on “timing” –> Energy still our favorite sector
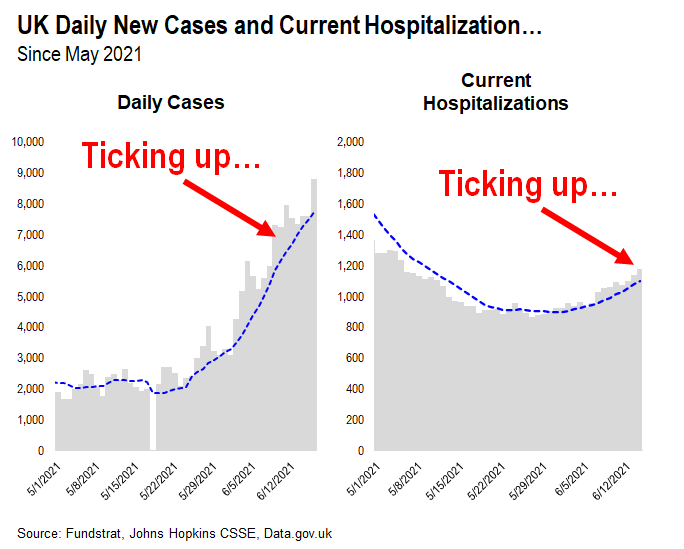
While USA cases continue to recede, UK cases and hospitalizations are rising…
I am not trying to sound any alarm bells, but the case trends in the UK are not plateauing. Since the daily cases ticked up a month ago, the daily cases are still surging in the UK:
– daily cases are now 8,000 per day
– was 2,000 per day in late May
– hospitalizations are starting to rise
– this is due to the Delta variant
As we wrote about, the UK has a different composition of vaccines, and this might explain the surge. But we need to keep an eye on that. By contrast, USA cases continue to collapse and are on the track to fall sub-10,000 and maybe sub-5,000 next week.
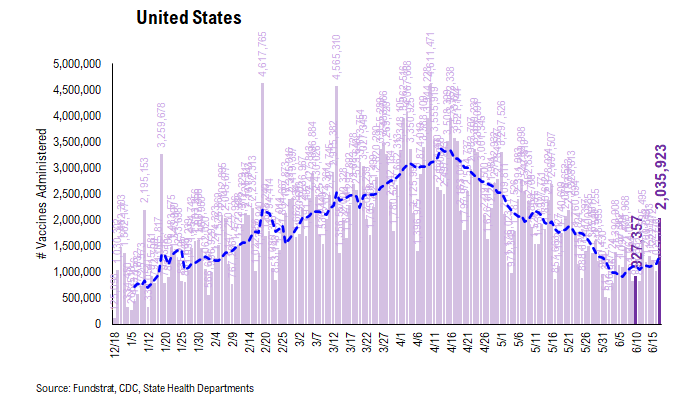
In the meantime, US vaccination trends seem to be curling upwards. In fact, there were a total of 2,035,923 doses administered newly reported by CDC on Thursday. Although this large increase is partially due to the under-reporting on Wednesday (see the table of daily vaccination by state below), the overall trend of vaccination evidenced by the 7D average (blue dash line) is indeed creeping up. This is a good thing. Take a look below. The number of vaccinations daily is slightly higher than it was a week ago. This is good news.
STRATEGY: Please ignore the markets this week, but the interest rates are “undershooting” the consensus
This week is a bit of a “throwaway” week given the combination of the FOMC post-mortem and the “quad witching” this Friday (6/18/2021). And while the market movements have been extreme, in our view, there has been no change to the positive economic and market fundamentals supporting stocks. In other words, we are treating this entire week as noise.
The Fed is acknowledging reflationary conditions, but the Fed’s central view of transitory inflation seems to be more convincing to markets. Here is a rundown of our current stance on fundamentals and markets:
– US economy reaching escape velocity as the US economy essentially now fully re-open
– Substantial pent-up consumer demand will lead to a surge in spending, some of which is “revenge spend”
– US corporates likely to see capital spending ramp up given strong recovery in earnings
– Stocks poised to surge to new highs in the coming weeks
– reflationary pressures exist
– but transitory factors like supply chain disruptions, hoarding, shortages of semis (etc.) and extended unemployment benefits give a distorted view of inflation
This is why we are positive on stocks and see upside in the coming weeks. As for sector positioning, we want to be:
– Overweight Epicenter stocks
– but we see downside to interest rates, and hence, we have a Neutral rating on Financials.
– FAANG is the beneficiary of a downside risk to interest rates, hence, our upgrade last week to Overweight
More importantly, it is a good sign that Technology is strengthening. Technology and Communications Services is nearly 40% of the S&P 500, so their strengthening bodes well for equities to surge to new highs.
…inflation is arguably destiny, but I think consensus has “timing” wrong
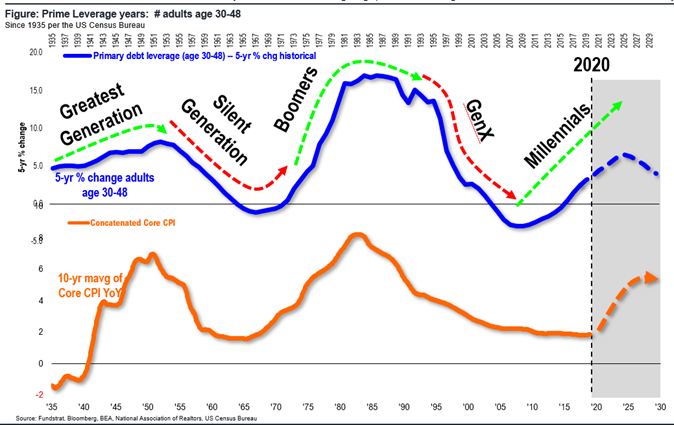
I agree 100%, even 1,000X, with the central view that reflationary conditions are in place. And thus, inflation is set to rise over the next 5 years. In fact, I think it is almost destiny driven by the surge in Millennials and their associated consumption and wealth effects. Take a look at this population series starting in 1935:
– the growth rate of adults age 30-48 has cycles, associated with variations associated with generations
– Millennials are causing the number of adults age 30-48 to surge in the next 10 years (see below)
– this mirrors the demographic Boomer surge of 1969-1985
– Core CPI seems to follow this demographic surge
Thus, our takeaway is that inflationary conditions are set to rise in the next 5-10 years. BUT. Big BUT. This does not have to happen in 2021. That is where our view differs from consensus.
– Recall, one can either forecast “level” or “time”
– the market is trying to call inflation risk both on “level” AND “time”
– thus, we are counter-trading the market’s forecast on “time”
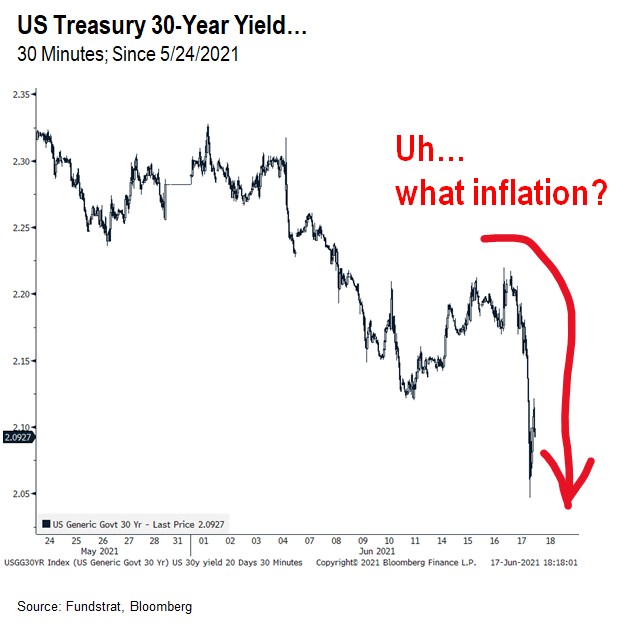
…the 30-year bond yields fall sharply this week, further evidence that consensus view on inflation “timing” is off
While many might view us as naive, take a look at the 30-year bond yields.
– whoa
– they utterly crashed
– if inflationary pressures were “secular” we would expect 30-yr yields to rise
– instead, they are falling
So, this is a further argument in favor of our “timing” view — inflation is set to rise, but why now? We think the Fed’s view that inflationary evidence now is transitory –> hoarding, bottlenecks, participation rates low due unemployment benefits –> these are arguably transitory.
– Fed 1, market 0
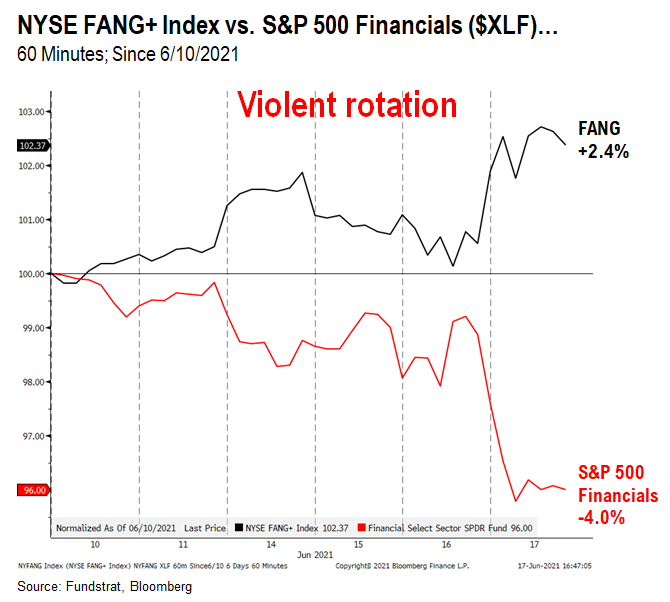
…Thus, Violent rotation into FAANG out of Financials makes more sense
This week saw a violent rotation out of Financials into FAANG as shown below:
– FAANG has outperformed Financials by 640bp in just the past 6 trading days
– whoa, that is nearly a 2-std deviation move in 6 days
This is violent. And the Quad witching plus FOMC over-reaction are contributing to this.
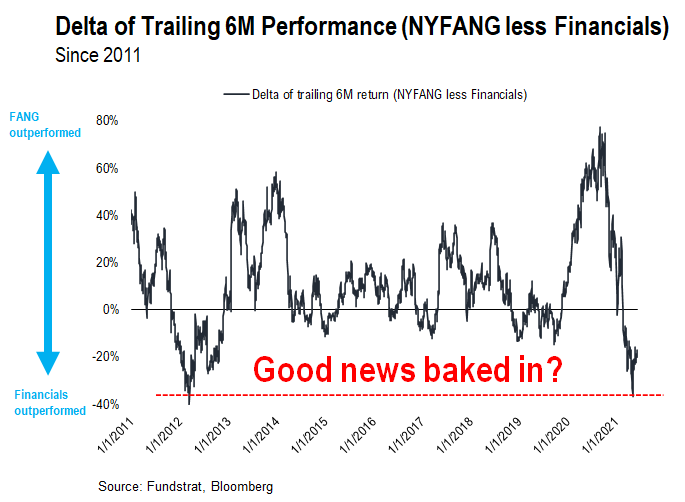
…But 640bp is a mere fraction of the 4,000bp of outperformance of Financials in the last 6 months
But as we highlighted multiple times, Financials outperformed FAANG by 4,000bp in the past 6 months, the largest degree of outperformance in a decade. And the last time we saw this magnitude of outperformance, this trade reverted:
– the key question is whether this is another turning point
– I am still favorable to Epicenter stocks, but we see risk in Financials
– for next 6 months, we see FAANG outperforming Financials
– thus, our double-upgrade of FAANG last week
STRATEGY: Bull market getting stronger –> DO NOT GET BEARISH!!!!
I need to reiterate:
– This week is noise
– Again, to repeat, this week is noise
Quad witching means sloppy markets. FOMC means sloppy markets.
I would not take any cues from this week.
…Foundation for bull market getting stronger
But we think the foundation for this bull market is strengthening. Strengthening to an extent that makes us even more constructive on the outlook for stocks into the end of June:
– inflationary risks are decreasing = good
– FAANG/Technology is strengthening = good, given 40% of market weight
– interest rates are easing = higher P/E = good
– 2H2021 capex likely to surge = good
So, you can see, the foundations for equities remain very strong. My personal conviction about higher markets increased this week. Granted, the market was choppy, but this is expected. It is a “quad witching” week and we warned everyone about this. We did this in March. And again in June. And like clockwork, it has been sloppy.
…”revenge Capex” of corporates drives Capex upside in 2H2021
There has been a huge wealth effect in the US owing to the recovery of financial markets.
– the “revenge” spend of households –> household wealth effects
– corporate “revenge” capex coming –> corporate wealth effect
Look at some of the charts from Thomas Callum of TopDown Charts. Below shows S&P 500 profit growth and the lead time to capex growth:
– EPS growth leads Capex by 12 months
– profit explosion of 2020/2021 = capex surge 2H2021
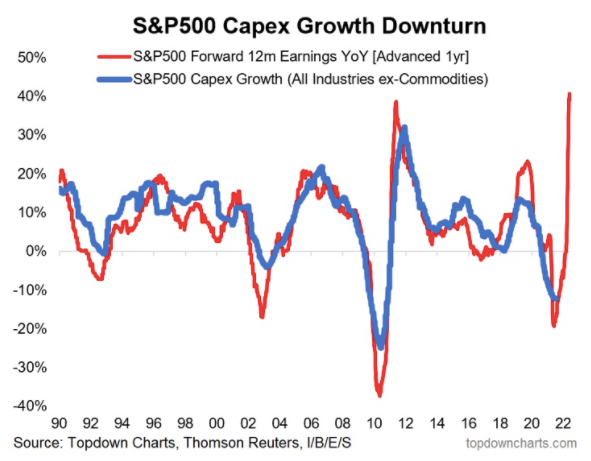
Source: https://www.seeitmarket.com/is-sp-500-corporate-capex-ready-to-surge/
Similarly, look at bank lending easing (inverted and advanced 1.5 years):
– bank lending easing leads capex by 1.5 years
– bank lending eased bigtime
– capex surge in 2H2021
So, capex set to surge in 2H2021 and beyond.
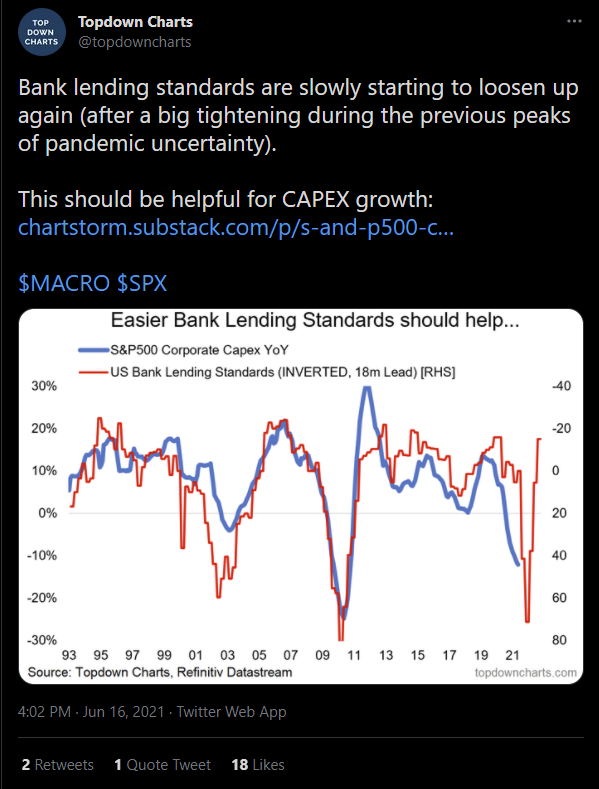
Source: https://twitter.com/topdowncharts/status/1405254487745327108
ENERGY: The sell-off this week is a gift… Energy remains our favorite sector by a country mile
Given the upside to economic resilience, stemming from the “revenge” spend of both households and corporates, we find this supportive of the upside for Energy stocks. And while Energy suffered from profit taking this week, I would hardly view any sector moves as a signal this week.
David Tepper, founder of Appaloosa, and one of the most respected macro investors is also bullish on Energy. He made his comments at Robin Hood Investors Conference, the charitable event that took place this week. But his comments are particularly striking:
– per Tepper, oil stocks are the cheapest by every measure
– wow
– “people hate them”
And I concur. These are hardly crowded trades. Technology is a crowded trade. Financials are a crowded trade. Discretionary is a crowded trade.
– Energy is a loathed sector that also happens to be the best performing sector YTD
– nothing has changed, particularly by FOMC, that has changed the tightening supply/demand dynamics of that sector
So, we would be buying XLE0.48% and OIH0.33% aggressively here. Those are the proxy ETFs for the Energy sector.

Source: https://www.bloomberg.com/news/articles/2021-06-16/david-tepper-says-he-s-bullish-much-loathed-oil-stocks
ADDENDUM: We are attaching the stock lists for our 3 portfolios:
We get several requests to give the updated list for our stock portfolios. We are including the links here:
– Granny Shots –> core stocks, based on 6 thematic/tactical portfolios
– Trifecta epicenter –> based on the convergence of Quant (tireless Ken), Rauscher (Global strategy), Technicals
– Violence in USA –> companies that are involved in some aspect of home or personal security. We are not “recommending” these stocks, but rather, bringing these stocks to your attention.
Granny Shots:
Full stock list here –> Click here
Trifecta Epicenter (*):
Full stock list here –> Click here
Power Epicenter Trifecta 35 (*):
Full stock list here –> Click here
Violence in USA:
Full stock list here –> Click here
(*) Please note that the stocks rated OW on this list meet the requirements of our investment theme as of the publication date. We do not monitor this list day by day. A stock taken off this list means it no longer meets our investment criteria, but not necessarily that it is neutral rated or should be sold. Please consult your financial advisor to discuss your risk tolerance and other factors that characterize your unique investment profile.
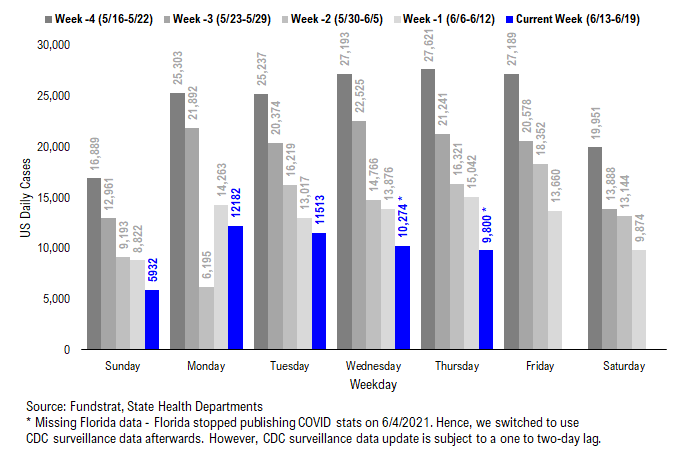
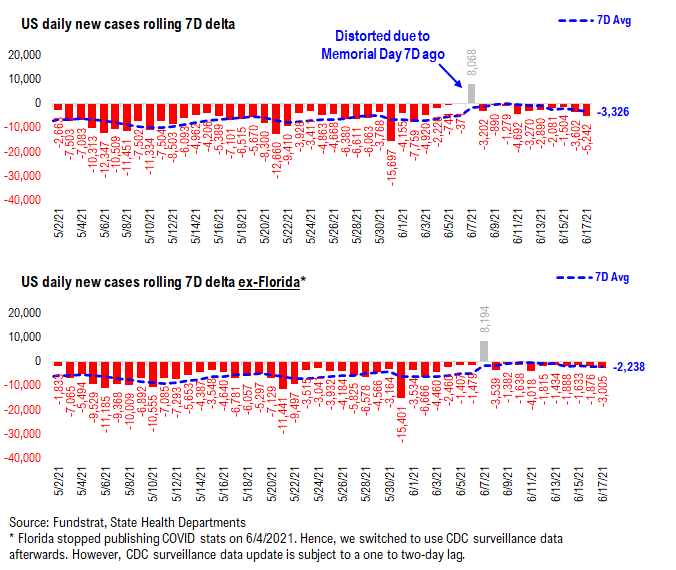
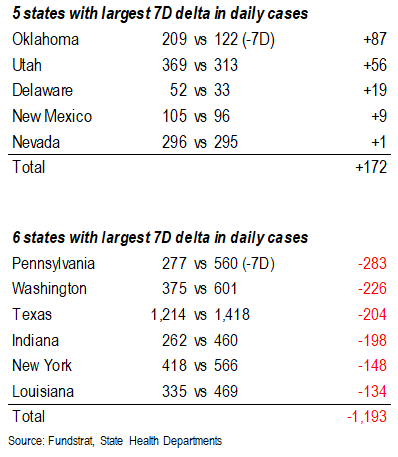
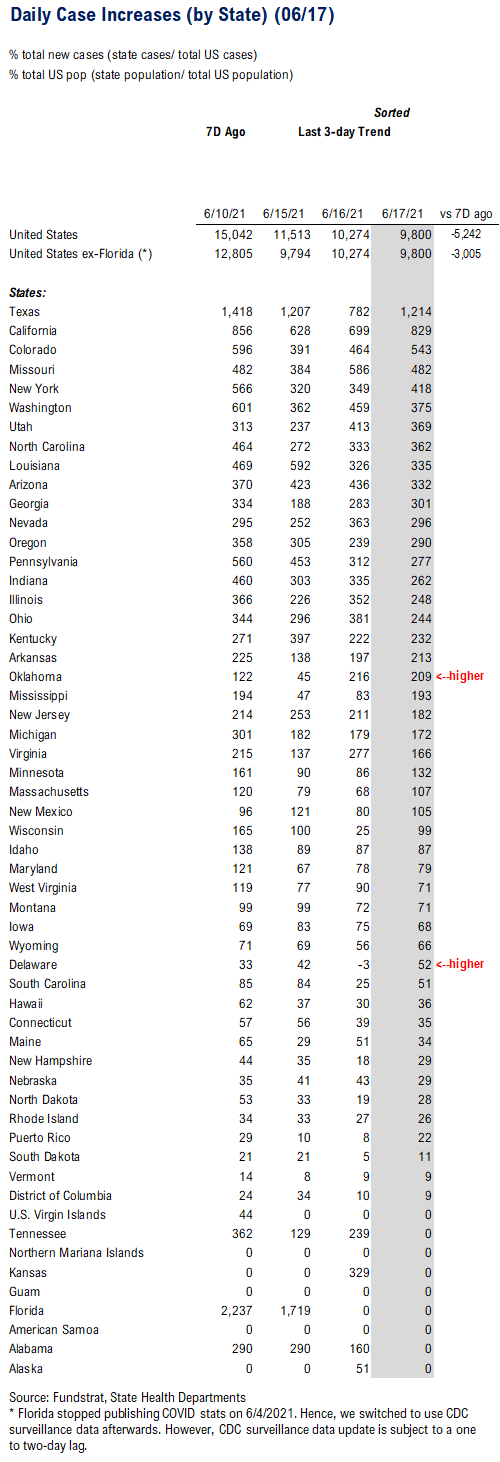
POINT 1: Daily COVID-19 cases 9,800, -3,005 (ex-FL) vs 7D ago…7D delta accelerating to the downside…
_____________________________
Current Trends — COVID-19 cases:
– Daily cases 9,800 vs 15,042 7D ago, down -5,242
– Daily cases ex-FL 9,800 vs 12,805 7D ago, down -3,005
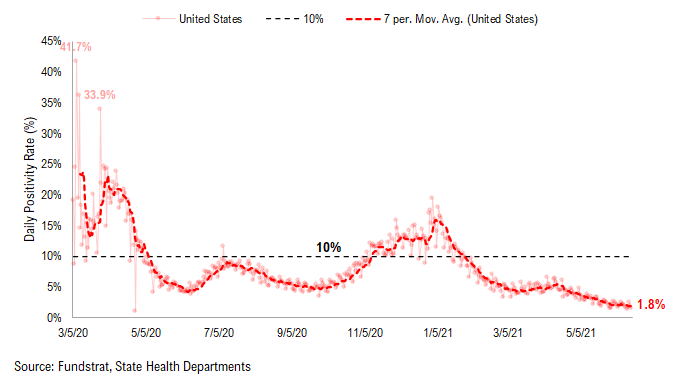
– 7D positivity rate 1.8% vs 2.1% 7D ago
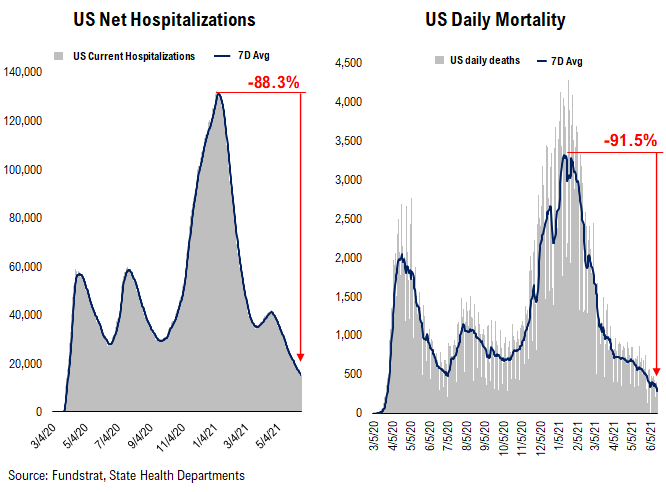
– Hospitalized patients 14,610 down -12% vs 7D ago
– Daily deaths 283, down 23% vs 7D ago
_____________________________
– As we noted previously, Florida stopped publishing daily COVID stats update on 6/4 and we switched to use CDC surveillance data as the substitute. However, as CDC surveillance data is subject to a one to two-day lag, we added a “US ex-FL” in our daily cases and 7D delta sections in order to demonstrate a more comparable COVID development.
– The latest COVID-19 daily cases came in at 9,800, down -3,005 (ex-FL) vs 7D ago. The 7D delta in daily cases has been accelerating to the downside over the past 3 days. This is good news. The persistent decline in daily cases and no post-holiday surge proved the importance of vaccine penetration. With continued efforts for higher penetration of vaccines, we believe the steady decline in daily cases is likely to persist, and daily cases could drop sub-10,000 for most of the individual days in the next week.
7D delta in daily cases has remained negative since the spike due to data distortion…
As you can see from the chart below, the 7D delta in daily cases has been accelerating to the downside over the past 3days. The decline in daily cases seems to slow down but this is primarily due to the lower daily cases now vs. a few months ago. More importantly, the daily cases remain on a downtrend, and we haven not seen a post-holiday case surge yet. As the data suggests, we expect the daily cases to drop sub-10,000 for most of the individual days in the next week.
Current hospitalization, daily deaths and positivity rate are at all time low…
Below we show the aggregate patients who are currently hospitalized due to COVID. After a mini-surge in March, the number of patients currently hospitalized rolls over again. Positivity rate is also following the similar pattern. Currently, all three metrics – current hospitalization, daily deaths and positivity rate – are at their all time lows since the start of the pandemic.
POINT 2: VACCINE: Vaccination pace has sped up… Average daily vaccination rose to 1.3 million doses (vs. 1.1 million doses 7D ago)…
_____________________________
Current Trends — Vaccinations:
– avg 1.3 million this past week vs 1.0 million last week
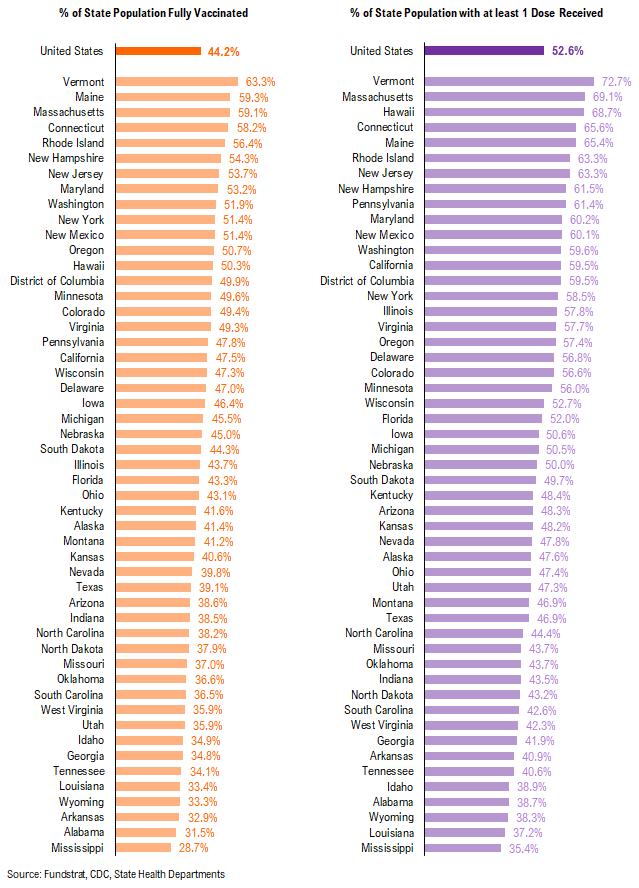
– overall, 43.6% fully vaccinated, 52.2% 1-dose+ received
_____________________________
Vaccination frontier update –> all states now near or above 70% combined penetration (vaccines + infections)
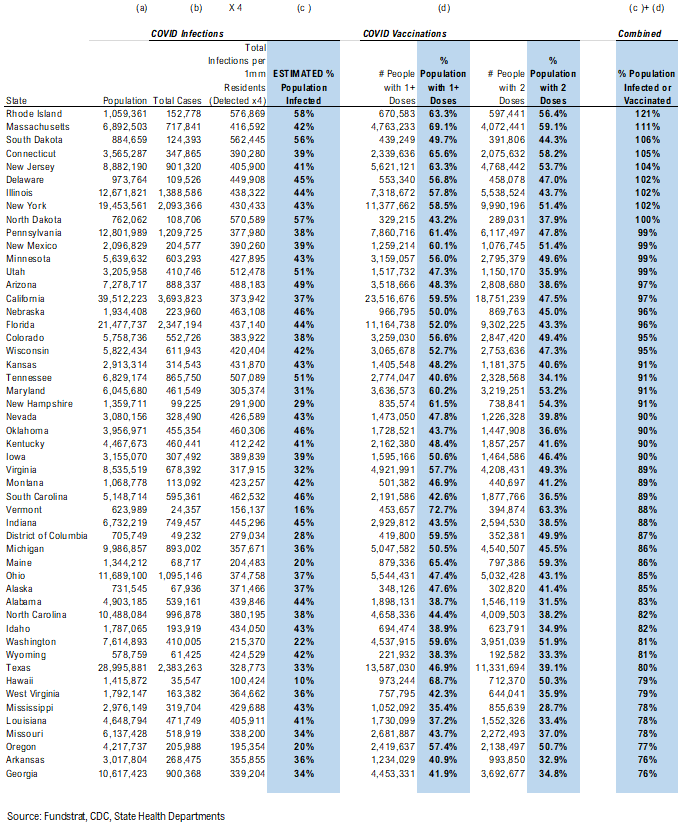
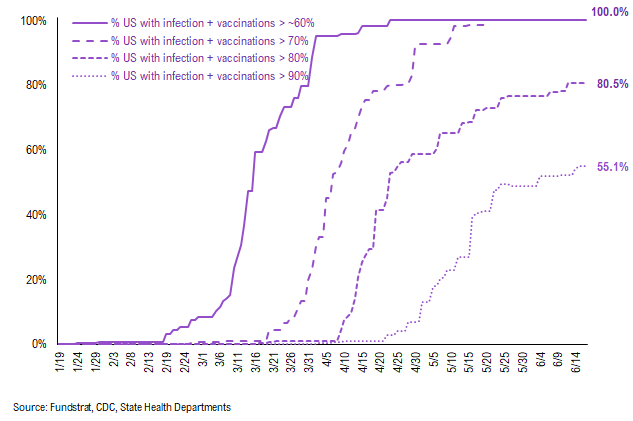
Below we sorted the states by the combined penetration (vaccinations + infections). As we commented in the past, the key figure is the combined value >60%, which is presumably near herd immunity. We have overlaid our case progress with that of Israel several times to demonstrate what should happen to cases once immunity reaches a certain critical level in the population. That is, the combined value of infections + vaccinations as % population > 60%. The persistent and rapid decline in cases suggest that the US is following a similar path to Israel (see our prior notes) while nations with less penetration continue to struggle more.
– Currently, all states are near or above 70% combined penetration
– RI, SD, MA, ND, CT, NJ, DE, NY, IL, UT, MN, NM, NE, AZ, PA are now above 90% combined penetration (vaccines + infections)
– So gradually, the US is getting to that threshold of presumable herd immunity. So long as a vaccine resistant variant doesn’t spread widely, the continued retreat of cases should continue.
Below is a diffusion chart that shows the % of US states (based on state population) that have reached the combined penetration >60%/70%/80%/90%. As you can see, all states have reached 60% and 70% combined vaccination + infection. 80.5% of US states (based on state population) have seen combined infection & vaccination >80% and 55.1% of US states have seen combined infection & vaccination >90%.
There were a total of 2,035,923 doses administered on Thursday, up significantly from 7D ago. The huge increase in the number of doses administered was partially due to the under-reporting on Wednesday.

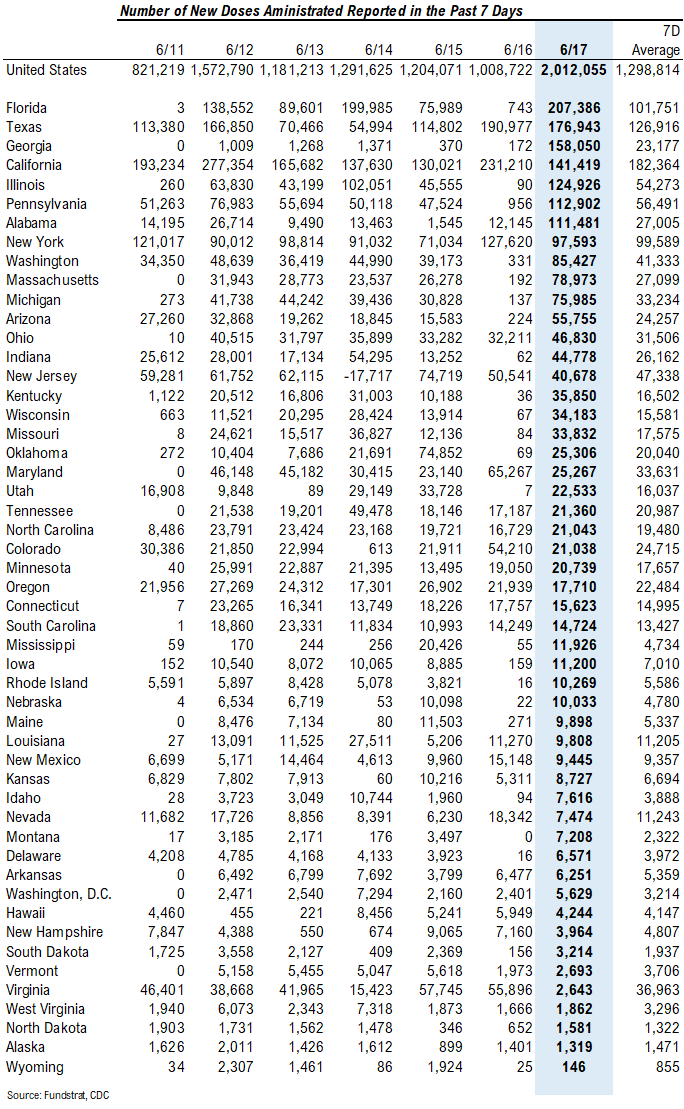
As you can see in the table below, many states reported an unusual low number of doses administered on Wednesday:
– Florida: 207,386 (Thu) vs. 743 (Wed)
– Georgia: 158,050 (Thu) vs. 172 (Wed), 370 (Tue)
– Illinois: 124,926 (Thu) vs. 90 (Wed)
– Pennsylvania: 112,902 (Thu) vs. 956 (Wed)
…
…
That said, the overall trend of vaccination evidenced by the 7D average (blue dash line) is indeed creeping up. The 7D average daily number of doses administered has been up 16.5% from 1.13 million to 1.32 million per day. This increase in vaccination speed coincides with the recent efforts by the Biden administration to get more people vaccinated by the fourth of July. With continued efforts for higher penetration of vaccines, it could prevent the renewed outbreak and ensure the economy reopens safely.

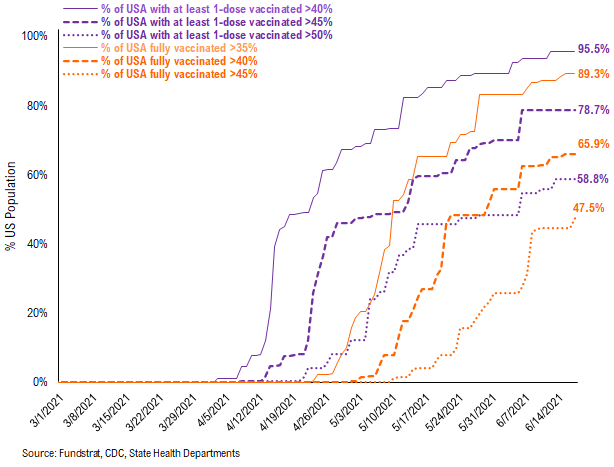
95.5% of the US has seen 1-dose penetration >40%…
To better illustrate the actual footprint of the US vaccination effort, we have a time series showing the percent of the US with at least 35%/40%/45% of its residents fully vaccinated, displayed as the orange line on the chart. Currently, 89.3% of US states have seen 35% of their residents fully vaccinated. However, when looking at the percentage of the US with at least 40% of its residents fully vaccinated, this figure is 65.9%. And only 47.5% of US (by state population) have seen 45% of its residents fully vaccinated.
– While 95.5% of US states have seen vaccine penetration >40%, 78.7% of them have seen 1 dose penetration >45% and 58.8% of them have seen 1 dose penetration > 50%.
– 89.3% of the US has at least 35% of its residents fully vaccinated, However, only 65.9% of US has fully vaccinated >40% and 47.5% of US has fully vaccinated >45%.
This is the state by state data below, showing information for individuals with one dose and two doses.
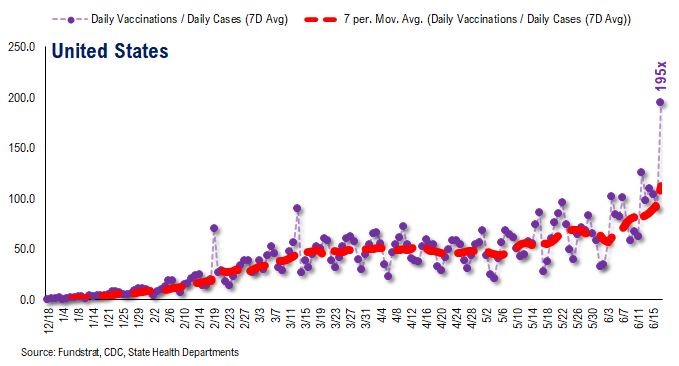
The ratio of vaccinations/ daily confirmed cases is generally trending higher (red line is 7D moving avg), but this is largely due to the decline in daily cases.
– the 7D moving average is about ~100 for the past few days
– this means 70 vaccines dosed for every 1 confirmed case
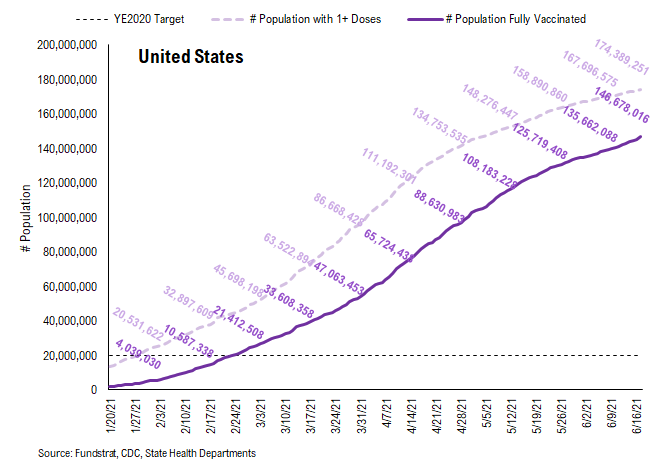
In total, over 300 million vaccine doses have been administered across the country. Specifically, 174 million Americans (53% of US population) have received at least 1 dose of the vaccine. And 147 million Americans (44% of US population) are fully vaccinated.
POINT 3: Tracking restrictions lifting and subsequent effects in individual states
Point #3 focuses primarily on tracking the lifting of restrictions, as states have eased the majority of mandates. Keep in mind, easing/lifting restrictions are contingent upon state of emergency ordinances being renewed.
– States in groups 1 and 2 represent states that let their emergency ordinances expire, or that never had one in the first place
– Note: IL and HI are not listed. This is because restrictions lifting is determined at the county / island level, and no statewide policy will be established to lift restrictions until a full reopening
So there is a spectrum of approaches. Our team is listing 3 tiers of states and these are shown below.
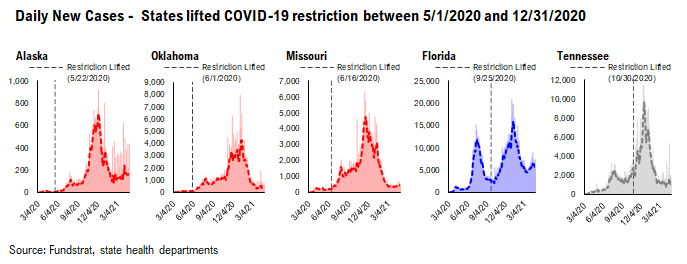
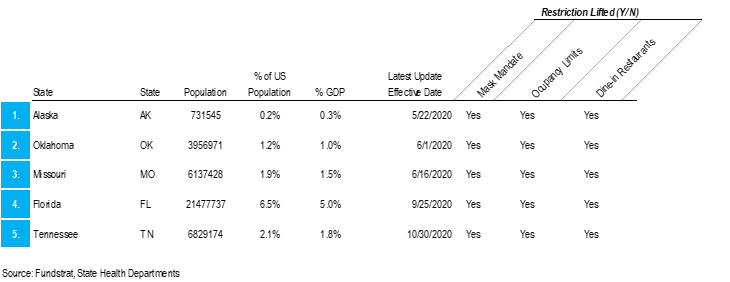
– states that eased all restrictions in 2020: AK, OK, MO, FL, TN
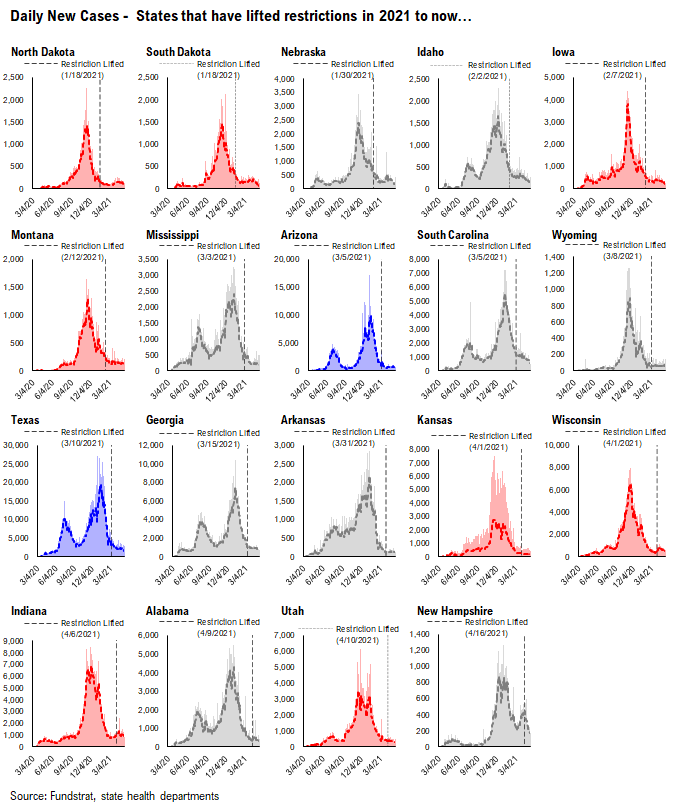
– states that have eased all restrictions in 2021 to now: ND, SD, NE, ID, IA, MT, MS, AZ, SC, WY, TX, GA, AR, KS, WI, IN, AL, UT, NH
– states that are still easing restrictions in 2021: OR, ME, WV, WA, MN, MA, NC, KY, LA, CA, DE, PA, NM, OH, CO, NJ, VT, MD, NV, NY, CT, VA, MI, RI, DC
GROUP 1: States that lifted restrictions in 2020…
The daily case trends in these states are impressive and it is difficult to say that lifting restrictions has actually caused a new wave of cases because the case trends in these states look like other states.
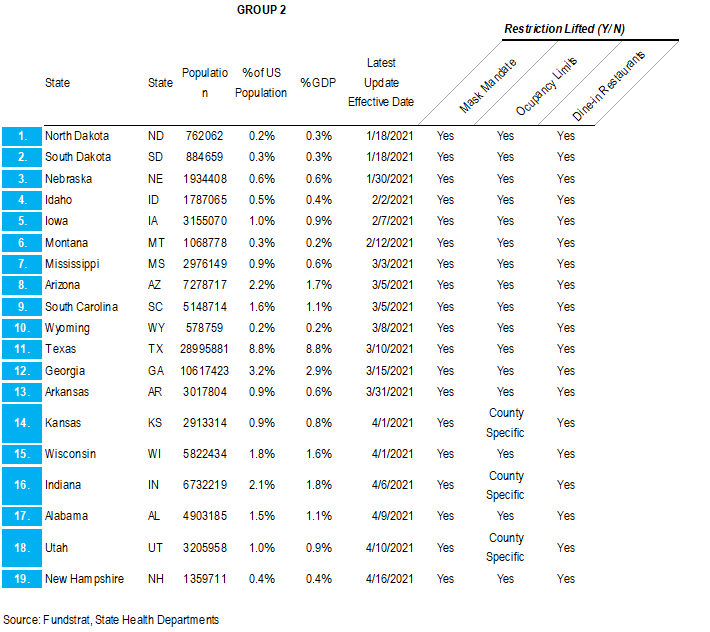
GROUP 2: States that have lifted restrictions in 2021 to now…
Similar to the list of states above, the daily case trends in these states are impressive and it seems that lifting restrictions hasn’t caused an increase in cases.
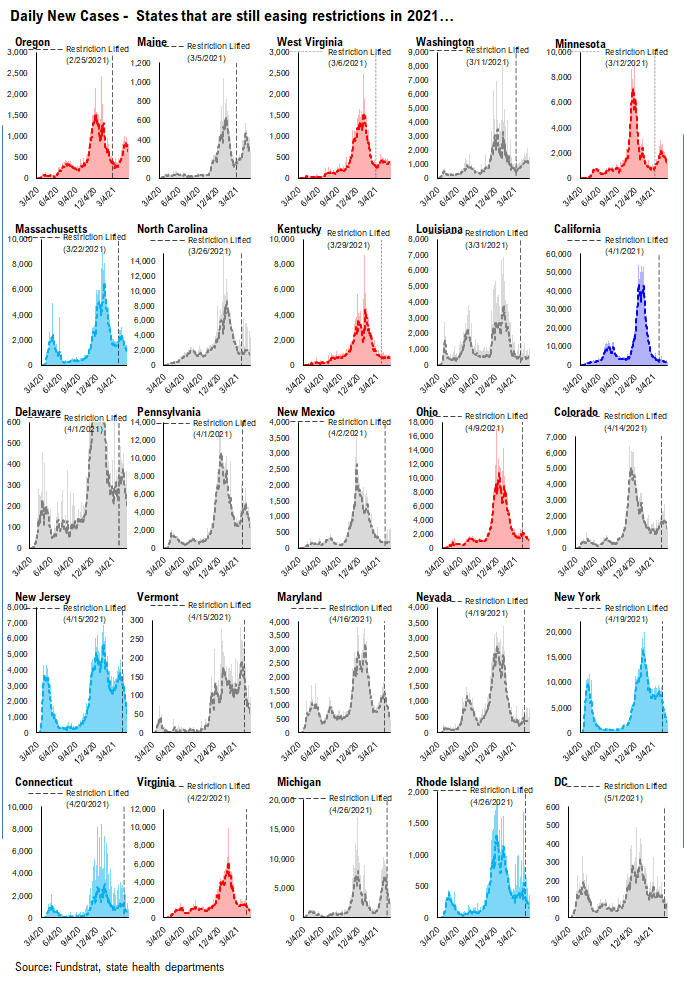
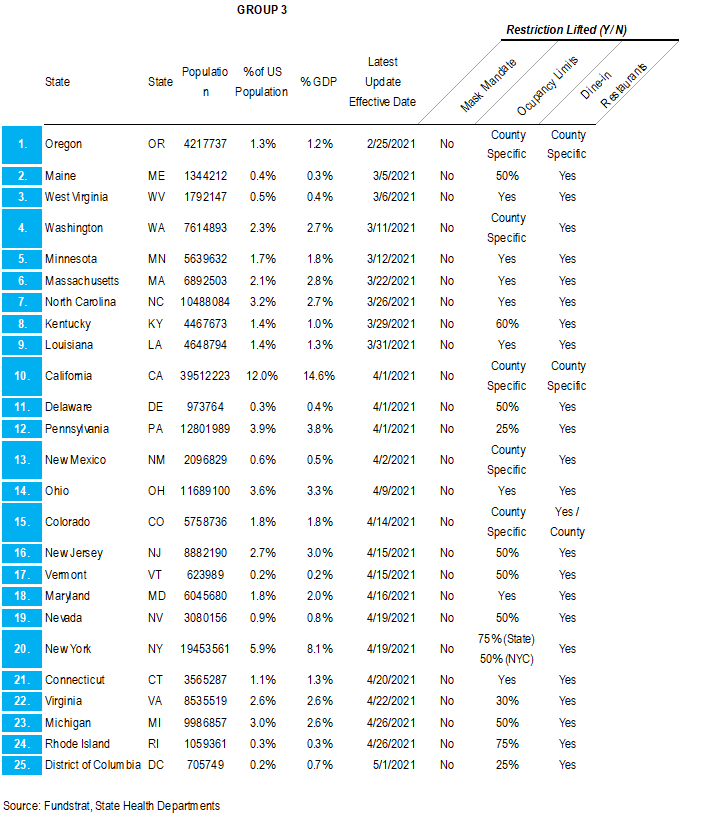
GROUP 3: States that are still easing restrictions in 2021…
These states have begun to lift restrictions, but have yet to ease all restrictions. The date of each state’s most recent restrictions lifting is indicated on each chart. The case trends in these states have been mostly positive.
– Easing restrictions appears to have contributed to an increase in cases in several of these states, most drastically in OR, ME, WA, and MN
More from the author
Articles Read 1/2
🎁 Unlock 1 extra article by joining our Community!
Stay up to date with the latest articles. You’ll even get special recommendations weekly.
Already have an account? Sign In 7459eb-afdd28-aaf51a-44c6a3-e85b85
Already have an account? Sign In 7459eb-afdd28-aaf51a-44c6a3-e85b85

