

Lots of noise last week, but little signal. We continue to see US expansion as mostly early cycle.

Click HERE to access the FSInsight COVID-19 Daily Chartbook.
We are shifting to a 4-day a week publication schedule:
- Monday
- Tuesday
- Wednesday
- SKIP THURSDAY
- Friday
STRATEGY: Lots of noise last week, but little signal
Yesterday was Father’s Day in the US (and some other places), and this is a holiday to celebrate our own father’s and also to recognize those who are a father to someone — either their own child or someone else in their life. I spent yesterday making some ribs (sorry, not smoked, since the cooking time is so short) and generally enjoying the wonderful weather.
As for markets, to call last week choppy is somewhat of an understatement, but it was tumultuous given the combination of volatility inducing factors:
– FOMC meeting, and one where Fed has recognized the reduction of pandemic tail risks
– Quad witching (expiry of stock options, stock futures, index options, index futures) and the second largest in history
Markets were therefore roiled both in the rates (fixed income) and equity world (quad witching)
NOISE –> FOMC hawkish surprise, but interest rates fell –> Noise –> Was market was too hawkish?
As many of our clients know, we recently have discussed how we see downside risk to interest rates, relative to consensus view. This is not because we are deflation-ists and not because we are negative on the global recovery.
– rather, we believe that many contemporaneous “hot” inflation readings were making investors too “hawkish”
– in fact, the FOMC meeting was more “hawkish” than expected
Per JPMorgan US Fixed Income research team, led by Alex Roever, the Fed even began talking about Fed tapering. Tapering, or reducing either asset purchases and even moving towards raising rates, should cause interest rates to rise.
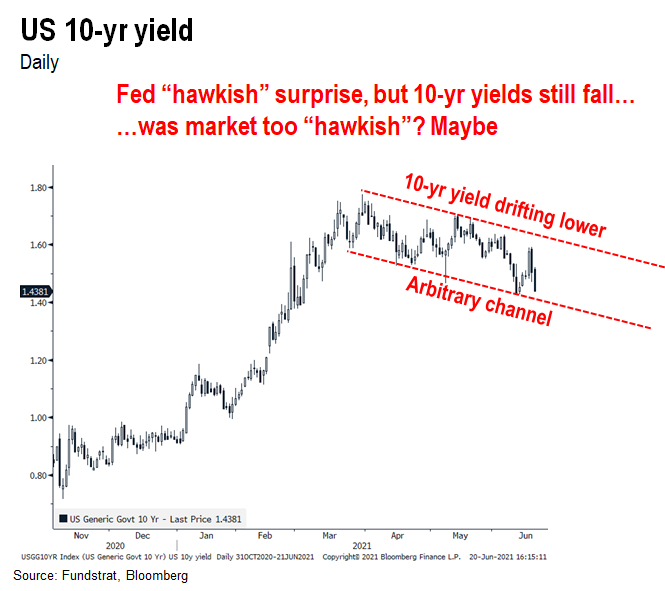
…but instead a surge in rates, we saw 10-year yields fall sharply
But despite this “hawkish” surprise, we saw interest rates decline. In fact, the 10-yr yield has been falling downwards within this channel. And this downward move in rates has puzzled us for some time.
– the downtrend is evident
– post-FOMC rates have continued to drift lower
We do not think this is a sign that interest rates in the out years (2-3 years forward) are lower, but this downward move in rates could be due to several factors:
– technical reaction as bond investors were too short
– re-calibration, as the bond market has been too hawkish compared to Fed
In our view, either explanation works. That is, Fed was incrementally hawkish, so rates should have risen. But instead, we got lower long-term rates and a flatter yield curve.
STRATEGY: FOMC actions + lower yields = supportive of equities
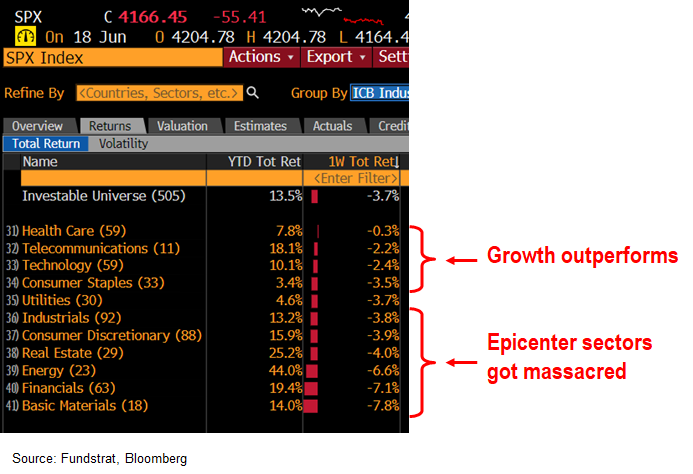
The S&P 500 fell 2% last week, although the index decline masked a much more savage sector rotation. Growth stocks outperformed (still fell) and Epicenter got clobbered.
– Healthcare was strongest last week –> flat
– Financials and Basic Materials worst –> “hoarding” falling off + rates lower
I know investors are tempted to declare the Epicenter trade over, because of the combination of bond market reversals plus the sector laggardship. However, we think this is largely noise.
…The US economy is still arguably “early cycle” in the expansion
Foremost, we think the US economy remains early cycle. This is obviously a very “soft” observation, given there is really no real way to stage the economic expansion real-time. We can only judge this in the rear view mirror. But there are two simple guideposts:
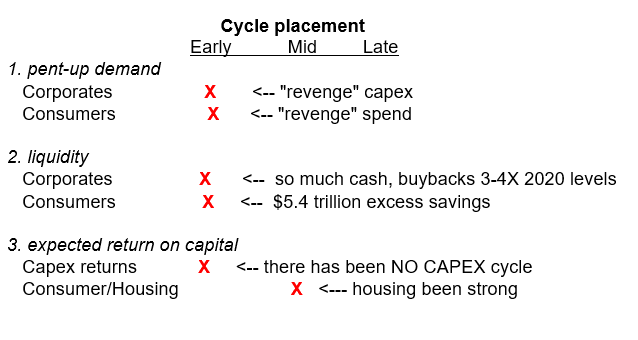
So looking at the above, by many measures, the US expansion seems early cycle to us. That is, there is substantial pent-up demand and liquidity and the expected return of capital is high.
– that latter point, expected return is key.
– cycles generally end when the expected return on capital is zero or negative
– think dot com bubble or housing market peak
Thus, we continue to see the US expansion as early cycle and this is a time to be overweight Epicenter stocks.
…incoming economic data will tell us whether “revenge” capex and “revenge” spend remains strong
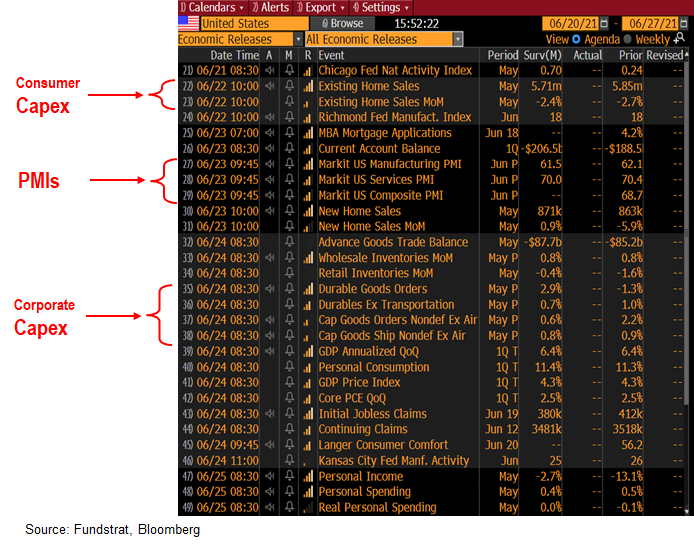
This coming week should appease those anxious about the business cycle. There is plenty of incoming data to give us a sense for the strength of the recovery.
– Existing home sales
– Markit PMIs (not ISMs)
– Durable goods and capital goods orders –> revenge capex
And let’s not forget stock buybacks will be ramping up in 2021 as well. This is “revenge” spending, to an extent, as companies were constrained in 2020 from executing on stock buybacks.
BOTTOM LINE: Equity markets might suffer near-term from Quad witching impacts, but we see strong after mid-week
Bottom line, we remain constructive. We think this period of chop, which we warned about last week, should end by mid-week. And in the meantime, after all the panic has abated, we see stocks drifting higher. Visibility on the recovery is strengthening.
– and it seems early to worry about 2023 “dot plots”
– the FOMC raising rates in 2023 is 18 months away
– do we really need to be selling stocks today?
ADDENDUM: We are attaching the stock lists for our 3 portfolios:
We get several requests to give the updated list for our stock portfolios. We are including the links here:
– Granny Shots –> core stocks, based on 6 thematic/tactical portfolios
– Trifecta epicenter –> based on the convergence of Quant (tireless Ken), Rauscher (Global strategy), Technicals
– Violence in USA –> companies that are involved in some aspect of home or personal security. We are not “recommending” these stocks, but rather, bringing these stocks to your attention.
Granny Shots:
Full stock list here –> Click here
Trifecta Epicenter (*):
Full stock list here –> Click here
Power Epicenter Trifecta 35 (*):
Full stock list here –> Click here
Violence in USA:
Full stock list here –> Click here
(*) Please note that the stocks rated OW on this list meet the requirements of our investment theme as of the publication date. We do not monitor this list day by day. A stock taken off this list means it no longer meets our investment criteria, but not necessarily that it is neutral rated or should be sold. Please consult your financial advisor to discuss your risk tolerance and other factors that characterize your unique investment profile.
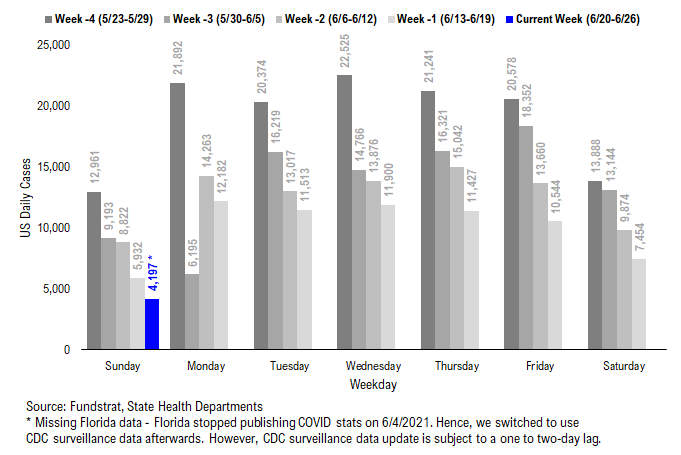
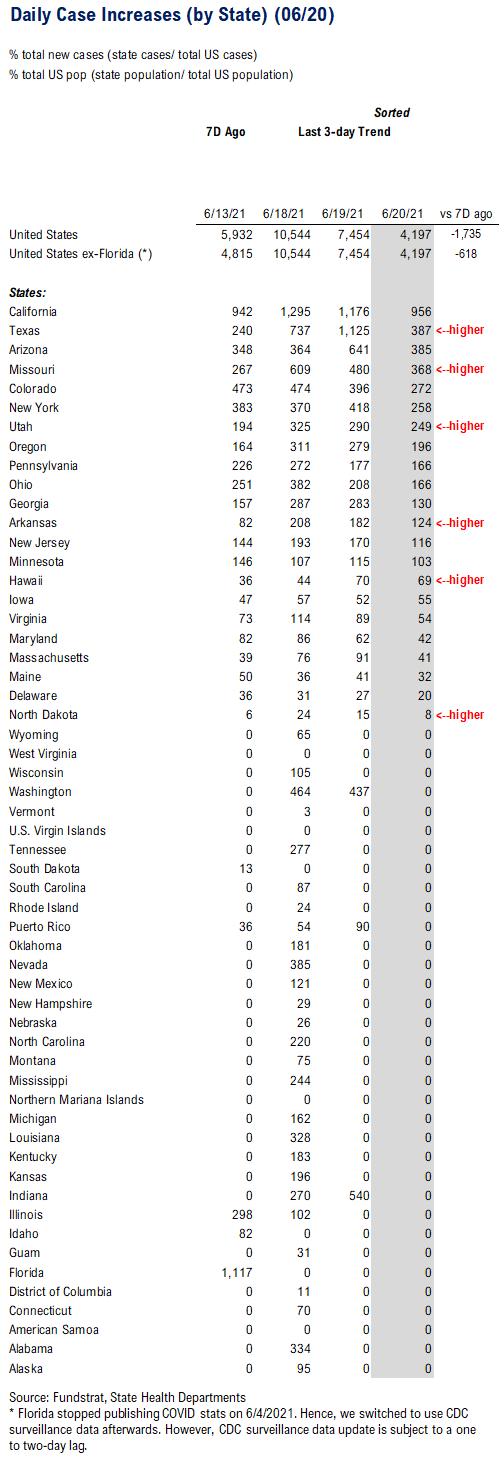
POINT 1: Daily COVID-19 cases 4,197, down -618 (ex-FL) vs 7D ago… Daily cases could drop to sub-10,000 for most of the individual days this week…
_____________________________
Current Trends — COVID-19 cases:
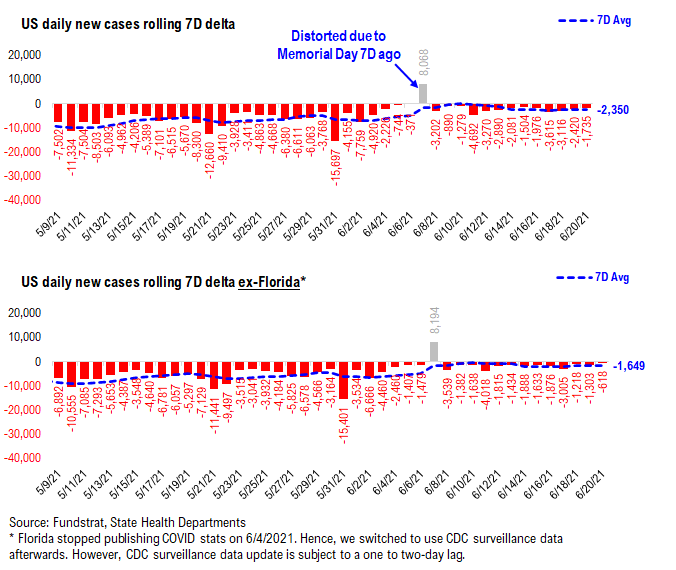
– Daily cases 4,197 vs 5,932 7D ago, down -1,735
– Daily cases ex-FL 4,197 vs 4,815 7D ago, down -618
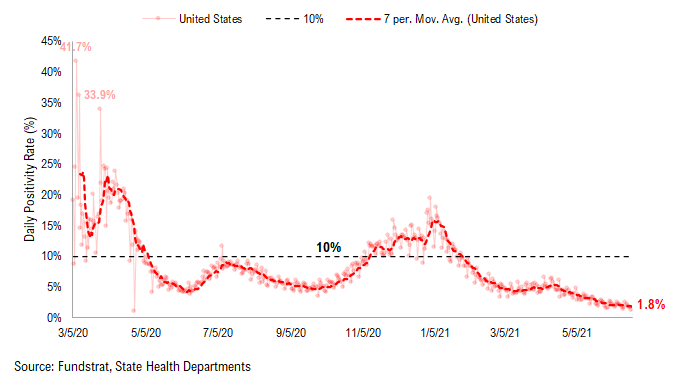
– 7D positivity rate 1.8% vs 2.0% 7D ago
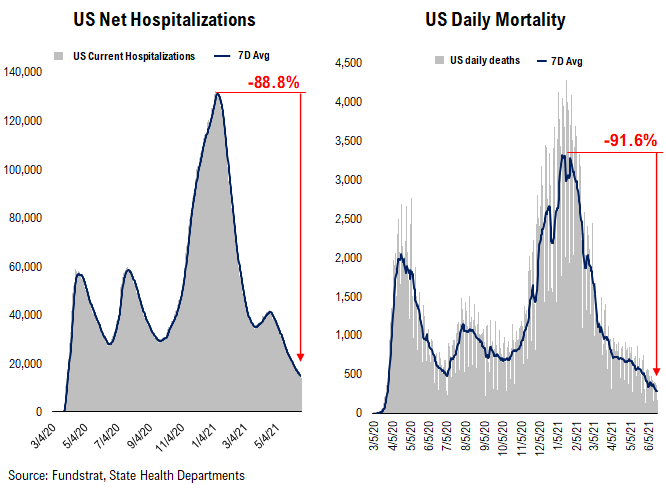
– Hospitalized patients 14,118 down -8.2% vs 7D ago
– Daily deaths 279, down 25% vs 7D ago
_____________________________
– As we noted previously, Florida stopped publishing daily COVID stats update on 6/4 and we switched to use CDC surveillance data as the substitute. However, as CDC surveillance data is subject to a one to two-day lag, we added a “US ex-FL” in our daily cases and 7D delta sections in order to demonstrate a more comparable COVID development.
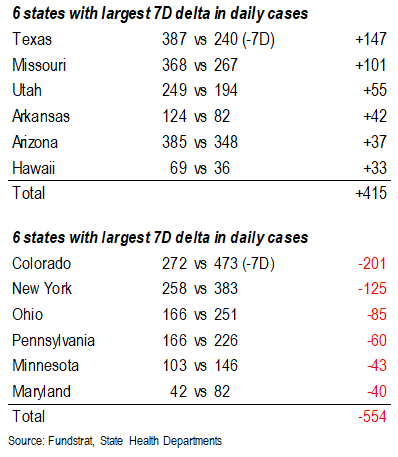
– On Sunday, 22 states reported 4,197 new cases, down -618 (ex-FL) vs 7D ago. The 7D delta in daily cases has been stabilized between -1,000 to -2,000 and we have not seen any signs of the post-holiday surge. With continued efforts for higher penetration of vaccines, we believe the steady decline in daily cases is likely to persist, and we could see the daily cases could drop to sub-10,000 for most of the individual days this week.
7D delta in daily cases has been stabilized over the past 10 days …
The 7D delta in daily cases has been stabilized. The decline in daily cases seems to slow down but this is primarily due to the lower daily cases now vs. a few months ago. More importantly, the daily cases remain on a downtrend, and we haven’t seen a post-holiday case surge yet. As the data suggests, we expect the daily cases to drop sub-10,000 for most of the individual days this week.
Current hospitalization, daily deaths and positivity rate are at all time low…
Below we show the aggregate patients who are currently hospitalized due to COVID. After a mini-surge in March, the number of patients currently hospitalized rolls over again. Positivity rate is also following the similar pattern. Currently, all three metrics – current hospitalization, daily deaths and positivity rate – are at their all time lows since the start of the pandemic.
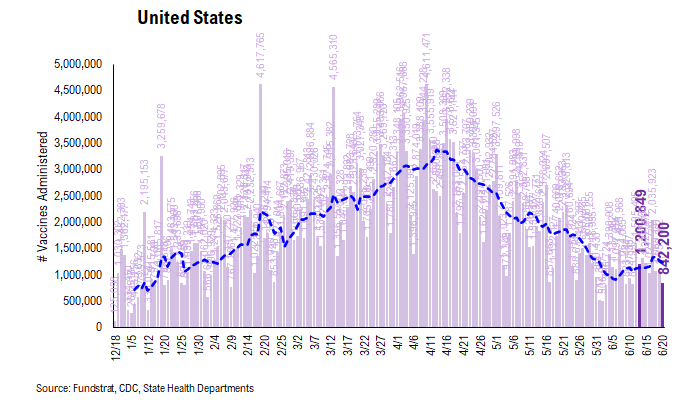
POINT 2: VACCINE: Vaccination pace has sped up… 7D average daily vaccination rose to 1.2 million doses (vs. 1.1 million doses 7D ago)…
_____________________________
Current Trends — Vaccinations:
– avg 1.2 million this past week vs 1.1 million last week
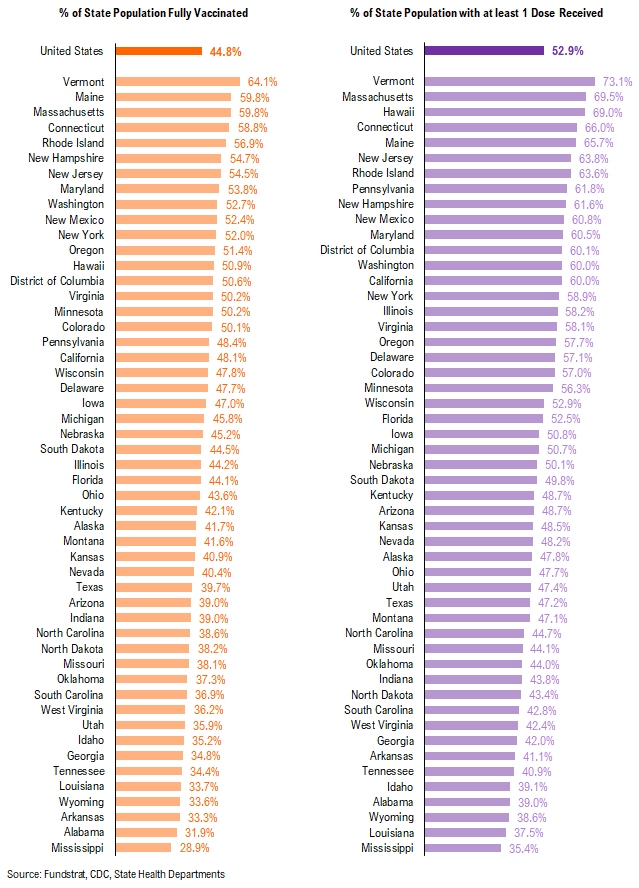
– overall, 44.8% fully vaccinated, 52.9% 1-dose+ received
_____________________________
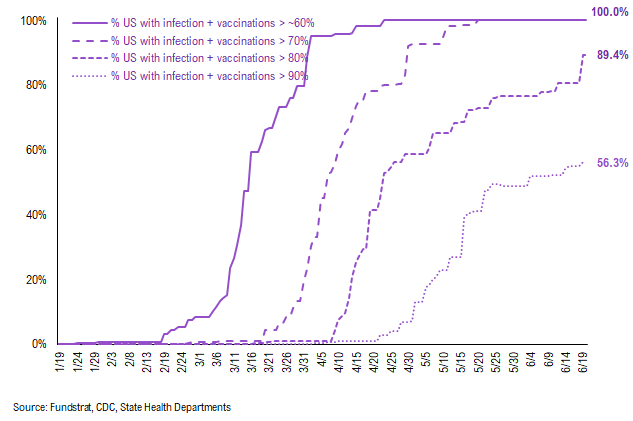
Vaccination frontier update –> all states now near or above 70% combined penetration (vaccines + infections)
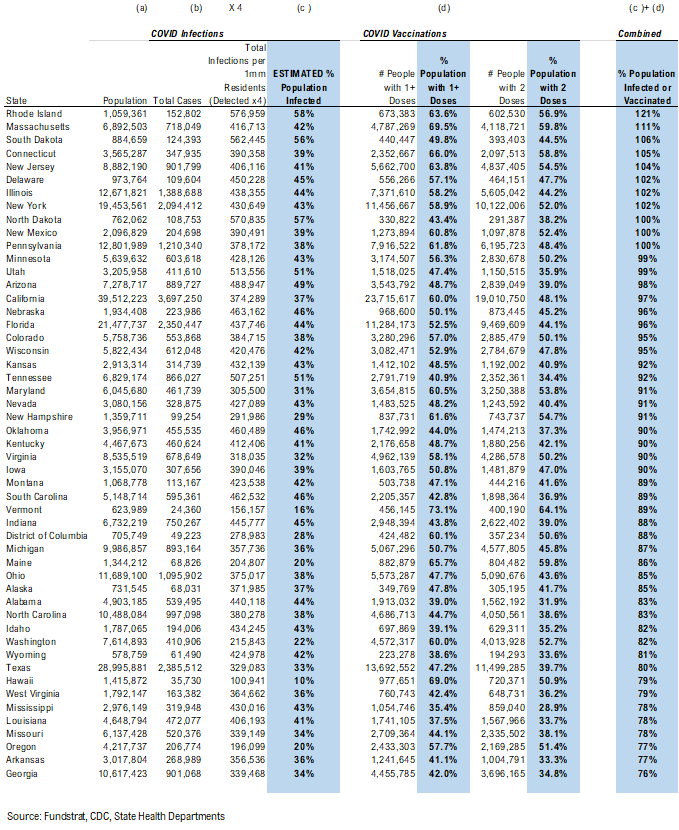
Below we sorted the states by the combined penetration (vaccinations + infections). As we commented in the past, the key figure is the combined value >60%, which is presumably near herd immunity. We have overlaid our case progress with that of Israel several times to demonstrate what should happen to cases once immunity reaches a certain critical level in the population. That is, the combined value of infections + vaccinations as % population > 60%. The persistent and rapid decline in cases suggest that the US is following a similar path to Israel (see our prior notes) while nations with less penetration continue to struggle more.
– Currently, all states are near or above 70% combined penetration
– RI, SD, MA, ND, CT, NJ, DE, NY, IL, UT, MN, NM, NE, AZ, PA are now above 90% combined penetration (vaccines + infections)
– So gradually, the US is getting to that threshold of presumable herd immunity. So long as a vaccine resistant variant doesn’t spread widely, the continued retreat of cases should continue.
Below is a diffusion chart that shows the % of US states (based on state population) that have reached the combined penetration >60%/70%/80%/90%. As you can see, all states have reached 60% and 70% combined vaccination + infection. 89.4% of US states (based on state population) have seen combined infection & vaccination >80% and 56.3% of US states have seen combined infection & vaccination >90%.
There were a total of 842,200 doses administered on Sunday, down from 7D ago. Several states reported unusual low number of doses administered over the weekend possibly due to the new federal holiday, Juneteenth. Hence, we expect some “true-up” in the number of doses administered in the next few days. The overall trend of vaccination remains upward which is the good news. With continued efforts for higher penetration of vaccines, it could prevent the renewed outbreak and ensure the economy reopens safely.
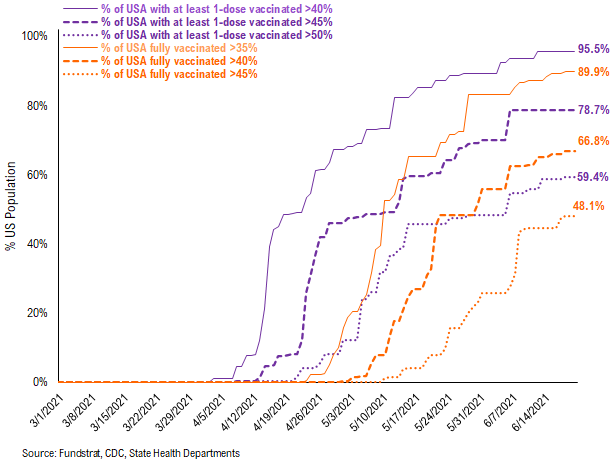
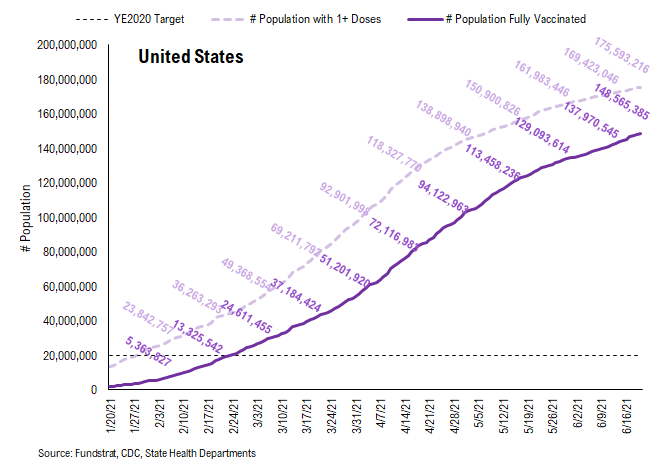
95.5% of the US has seen 1-dose penetration >40%…
To better illustrate the actual footprint of the US vaccination effort, we have a time series showing the percent of the US with at least 35%/40%/45% of its residents fully vaccinated, displayed as the orange line on the chart. Currently, 89.9% of US states have seen 35% of their residents fully vaccinated. However, when looking at the percentage of the US with at least 40% of its residents fully vaccinated, this figure is 66.8%. And only 48.1% of US (by state population) have seen 45% of its residents fully vaccinated.
– While 95.5% of US states have seen vaccine penetration >40%, 78.7% of them have seen 1 dose penetration >45% and 59.4% of them have seen 1 dose penetration > 50%.
– 89.9% of the US has at least 35% of its residents fully vaccinated, However, only 66.8% of US has fully vaccinated >40% and 48.1% of US has fully vaccinated >45%.
This is the state by state data below, showing information for individuals with one dose and two doses.
The ratio of vaccinations/ daily confirmed cases is generally trending higher (red line is 7D moving avg), but this is largely due to the decline in daily cases.
– the 7D moving average is about ~100 for the past few days
– this means 70 vaccines dosed for every 1 confirmed case
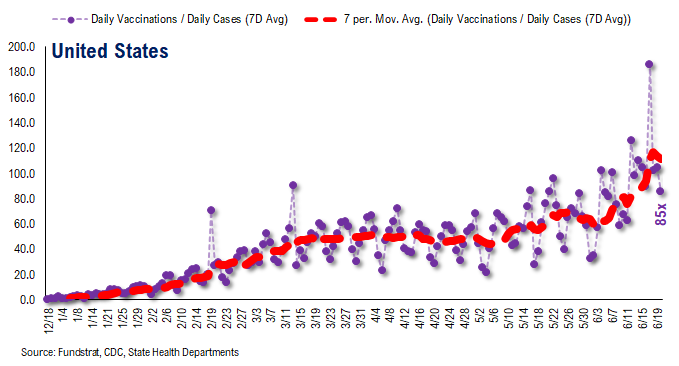
In total, 316 million vaccine doses have been administered across the country. Specifically, 176 million Americans (53% of US population) have received at least 1 dose of the vaccine. And 149 million Americans (45% of US population) are fully vaccinated.
POINT 3: Tracking restrictions lifting and subsequent effects in individual states
Point #3 focuses primarily on tracking the lifting of restrictions, as states have eased the majority of mandates. Keep in mind, easing/lifting restrictions are contingent upon state of emergency ordinances being renewed.
– States in groups 1 and 2 represent states that let their emergency ordinances expire, or that never had one in the first place
– Note: IL and HI are not listed. This is because restrictions lifting is determined at the county / island level, and no statewide policy will be established to lift restrictions until a full reopening
So there is a spectrum of approaches. Our team is listing 3 tiers of states and these are shown below.
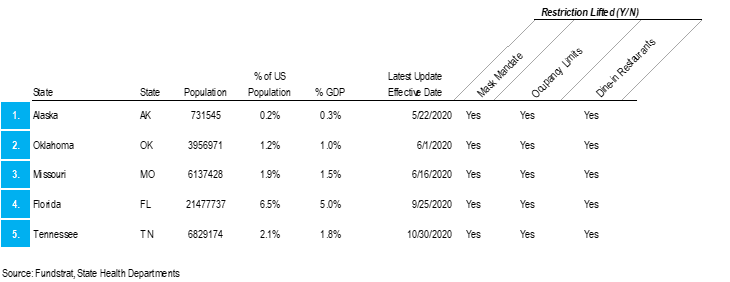
– states that eased all restrictions in 2020: AK, OK, MO, FL, TN
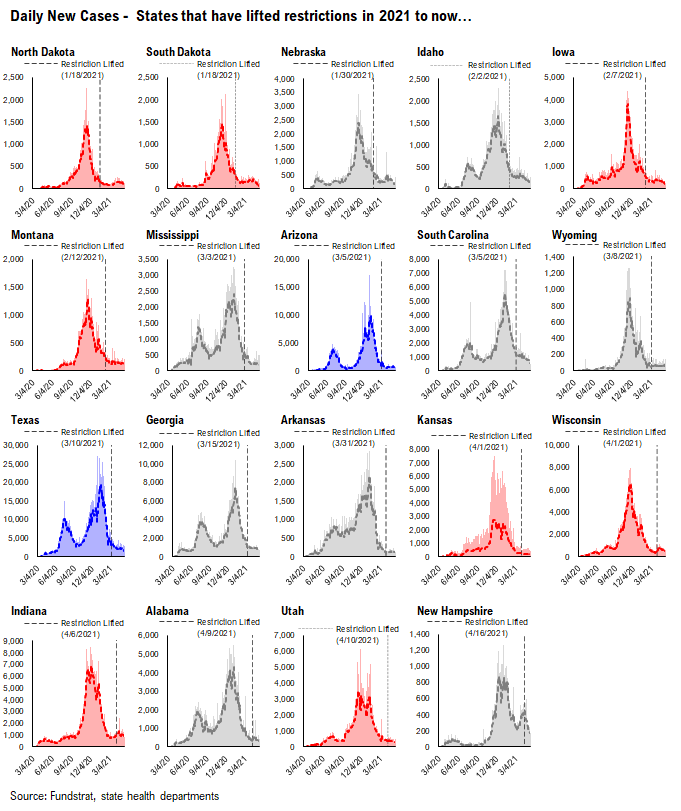
– states that have eased all restrictions in 2021 to now: ND, SD, NE, ID, IA, MT, MS, AZ, SC, WY, TX, GA, AR, KS, WI, IN, AL, UT, NH
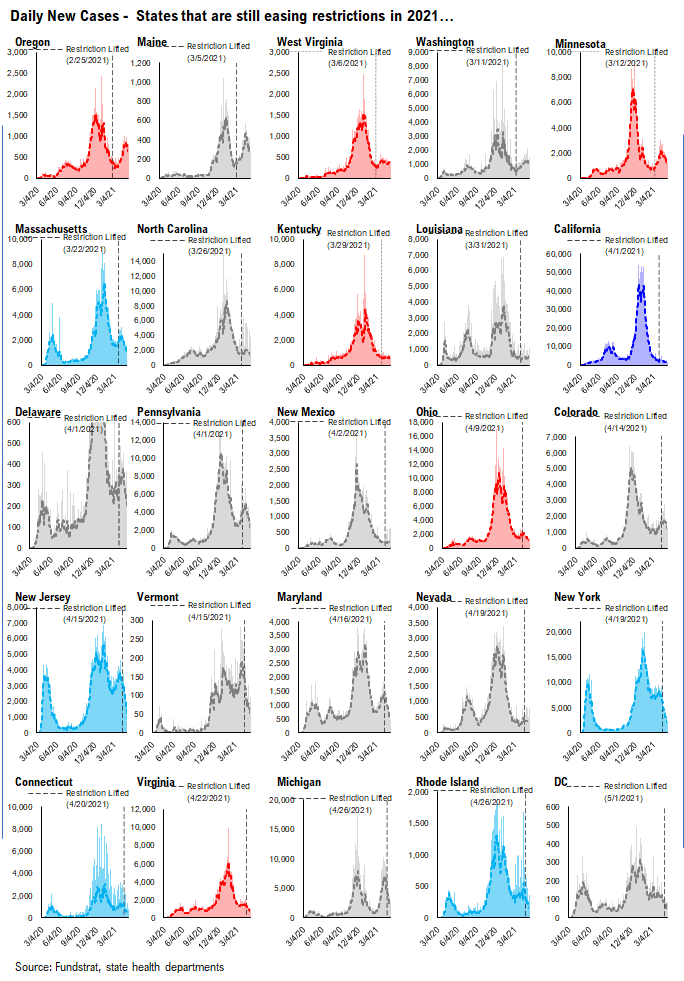
– states that are still easing restrictions in 2021: OR, ME, WV, WA, MN, MA, NC, KY, LA, CA, DE, PA, NM, OH, CO, NJ, VT, MD, NV, NY, CT, VA, MI, RI, DC
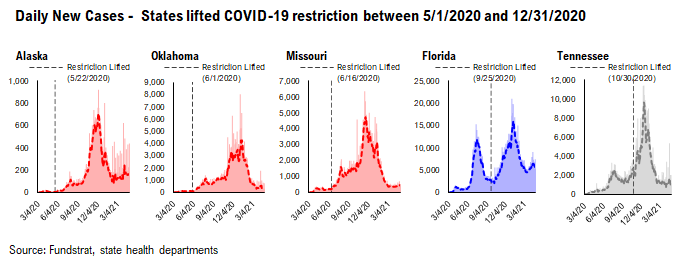
GROUP 1: States that lifted restrictions in 2020…
The daily case trends in these states are impressive and it is difficult to say that lifting restrictions has actually caused a new wave of cases because the case trends in these states look like other states.
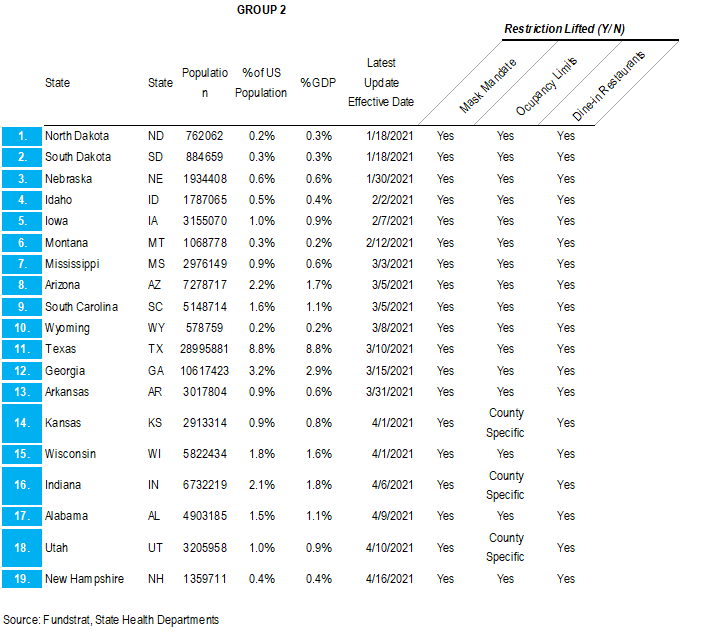
GROUP 2: States that have lifted restrictions in 2021 to now…
Similar to the list of states above, the daily case trends in these states are impressive and it seems that lifting restrictions hasn’t caused an increase in cases.
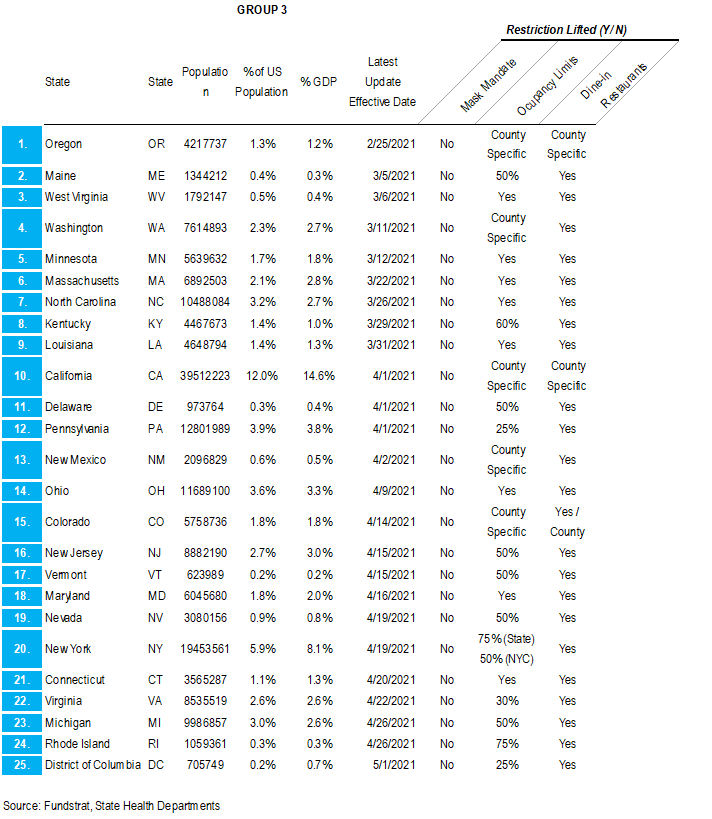
GROUP 3: States that are still easing restrictions in 2021…
These states have begun to lift restrictions, but have yet to ease all restrictions. The date of each state’s most recent restrictions lifting is indicated on each chart. The case trends in these states have been mostly positive.
– Easing restrictions appears to have contributed to an increase in cases in several of these states, most drastically in OR, ME, WA, and MN
More from the author
Articles Read 1/2
🎁 Unlock 1 extra article by joining our Community!
Stay up to date with the latest articles. You’ll even get special recommendations weekly.
Already have an account? Sign In 57ff95-7a94a9-dd1948-78f8db-90a438
Already have an account? Sign In 57ff95-7a94a9-dd1948-78f8db-90a438

