In USA, lower VAX rates age 16-64 = parabolic rise in state cases. Sufficient panic shown in VIX term structure associated with market bottoms

Click HERE to access the FSInsight COVID-19 Daily Chartbook.
We are shifting to a 4-day a week publication schedule:
- Monday
- Tuesday
- Wednesday
- SKIP THURSDAY
- Friday
STRATEGY: Sufficient panic shown in VIX term structure associated with market bottoms
The global story of COVID-19 is the Delta variant…
Over the past 8 weeks, the story of COVID-19 has become almost singularly about the Delta variant. There are many ways to show this, but the simplest graphic is one from Ourworldindata.org which shows a time series and share of cases associated with Delta variant.
– in UK/India 100%
– USA >95%
– Australia >90%
– Italy >85%
OK, you get the picture. The Delta variant is the most transmissible mutation and has already caused a parabolic surge in UK, Israel, and dozens of states in the US.
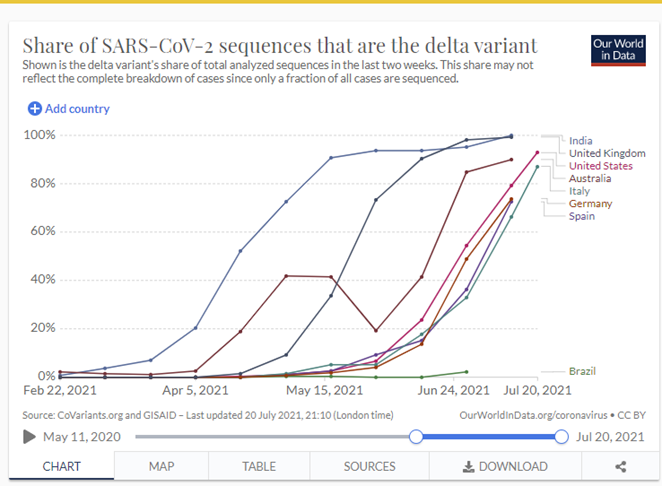
Source: https://ourworldindata.org/grapher/covid-cases-delta?time=2021-02-22..latest&country=BRA~GBR~USA~ITA~ESP~DEU~IND
…It is still unclear if vaccinations prevent Delta virus
And the unfortunate reality is that Delta is causing “breakthrough” cases in fully vaccinated adults. This is evident in multiple nations and from a increasingly multiple anecdotes we are hearing in the US.
– but breakthroughs do not mean vaccines are ineffective
– but breakthroughs do raise the question about the effectiveness of vaccines
There are a number of studies showing that some vaccines offer significantly lower protection against the Delta variant. The latest is this one cited by the NY Times (published on BioRxiv, see below). And shows the J&J vaccine effectiveness is not providing insufficient boost to antibody protection, and the authors suggest a booster is needed. But it is not just J&J, as Israel, which exclusively used the Pfizer vaccine, has seen breakthrough cases as well.
– so I don’t think the evidence is clear whether mRNA vaccines protect against the Delta variant
– and other mutations plus future mutations, such as Lambda variant, mean vaccine protection is seeing its limits
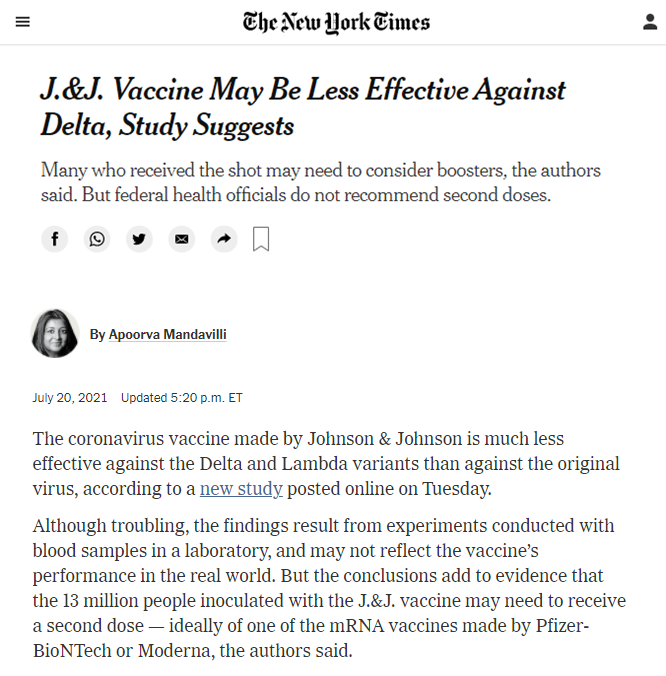
Source: https://www.nytimes.com/2021/07/20/health/coronavirus-johnson-vaccine-delta.html

Source: https://www.biorxiv.org/content/10.1101/2021.07.19.452771v1
…but curiously, US states with lower vaccination rates are seeing exponentially faster surge in cases
That said, tireless Ken pulled together some analysis looking at the vaccination rates of “working age” Americans and the associated change in cases.
– we chose age 18-64 because this is working population of USA
– and age 18-64 is the most mobile cohort
– thus, infection rates and vaccination rates of this cohort is the most important for keeping the economy open
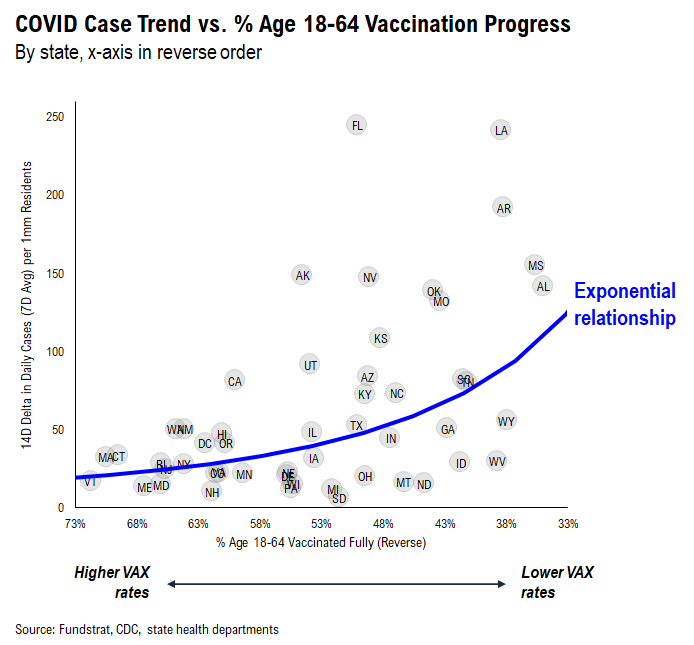
The scatter chart below shows the comparative relationship between vaccination rates and case growth:
– X-axis is “fully vaccinated” rate of age 18-64, by state
– Y-axis is 14D change in COVID-19 cases
As shown below, there seems to be a pronounced relationship.
– states with lower vax rates are seeing exponential rise in cases
– this relationship is not “linear” but “exponential”
= states with lower vax rates are seeing a far worse breakout in cases
So the casual observation is that at this stage in the US, vaccination rates of age 18-64 seem to be important to mitigate the surge in cases associated with Delta variant. But the future is uncertain. As we noted Monday, there is some arguments to be made that COVID-19 might actually be a seasonal virus. And that comparing case patterns 2021 vs 2020 certainly seem to argue this.
STRATEGY: Sufficient panic shown in VIX term structure associated with market bottoms
In the multiple discussions I had over the past few days, clients have asked us this simple question:
– “how can stocks rise if the Delta variant is causing a surge in cases?”
In short, the answer is YES.
But let me explain below:
– policymakers will be reluctant to shutdown the economy again
– UK is a template, fully re-open despite a parabolic rise in cases
– India cases rolling over HARD. Delta is 100% cases there
– stocks bottom way ahead of case peaks –> last year, 34 days before cases peaked
– see Monday’s note on wave 2
– watch the VIX
– we said this multiple times recently
– VIX has been “low energy” and a peak in VIX = market bottom
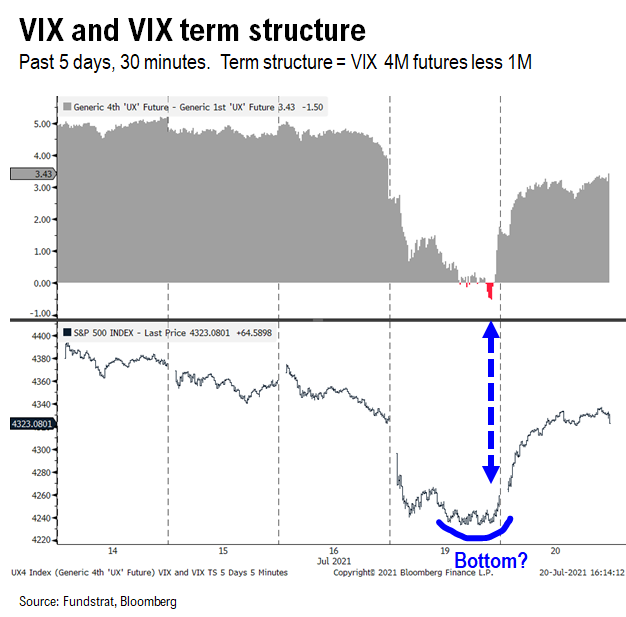
…Squint, do you see the “inverted” VIX term structure at end of trading on Monday?
Recall, one of our favorite ways to track the VIX is not the “spot” price (that is key also) but rather, the term structure of VIX 4M futures less 1M futures. By the way, in the non-equity world, VIX futures are widely used and traded, so the term structure has tons of signal.
– when 4M less 1M is inverted
– markets pricing in “near term high volatility event”
– usually = bottom for equities
At the end of trading Monday (7/19), the VIX term structure (4M futures less 1M) inverted intraday:
– the 4M less 1M term structure (TS) inverted intraday
– by close 7/19, the TS normalized
– a brief but important inversion
– Tuesday 7/20, TS steepened
This suggests that we saw “peak inversion” Monday and this would be a good argument that equity markets might have bottomed.
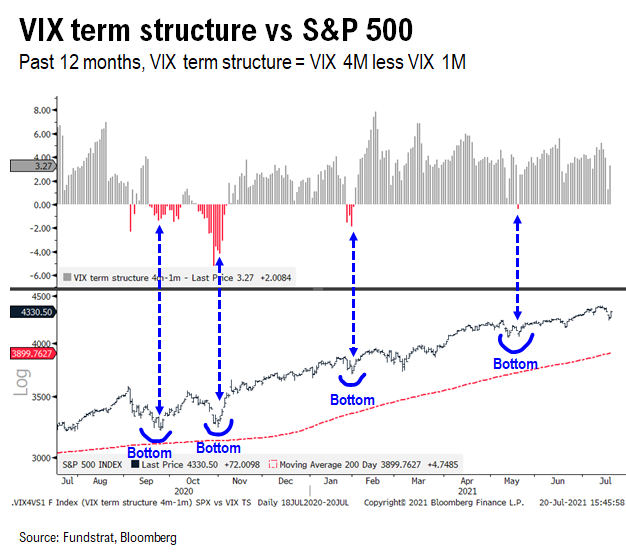
…past “peak inversions” associated with end of sell-off aka “market bottoms”
Take a look at the prior 4 VIX TS inversions. There have been 4 instances since August 2020:
– peak VIX TS inversion = equity market bottom
– Exception: August 2020 had a “punk” signal
– August saw stocks fall for another 8 weeks
– But Aug-Sept 2020 was during Presidential election season = less valid
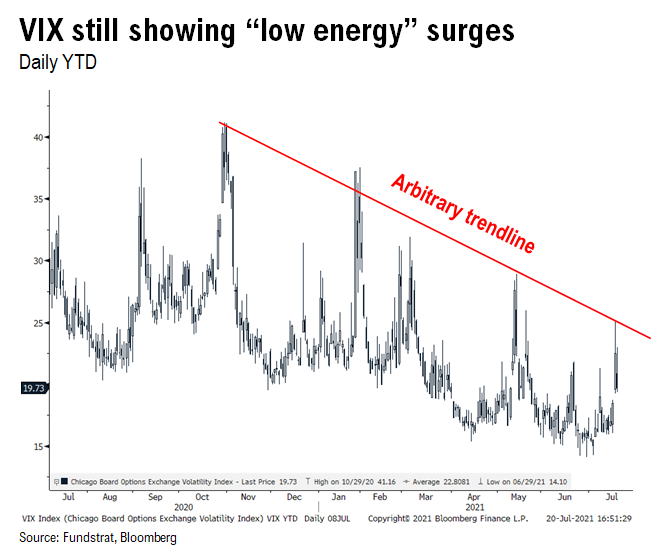
…VIX still showing only “low energy” surges
Naturally, the question to ask is whether the VIX has peaked in this current episode. After all, a peak in the VIX is key. The VIX spot peaking and the inversion of the term structure occur contemporaneously. But the TS inversion is a sign to add credibility to shift in direction of the spot VIX:
– VIX looks like it was repelled by this trend
– albeit, arbitrary trendline
Thus, we think odds are high that we have experienced peak panic around the US current surge in Delta variant cases.
BOTTOM LINE: “July chop” still in play, hence, don’t be a hero. But also, supports our view of a setup for a 2H2021 rally
The odds are high that we might have seen the crescendo in market panic — aka capitulation. That is, the Delta variant has become a risk to the economic recovery story. But as we wrote earlier this week:
– we expect Delta to be more “bark than bite”
– the sell-off associated with Delta not likely to be a larger 10%-plus drawdown
And as noted above, odds are high we saw peak in the panic this week already.
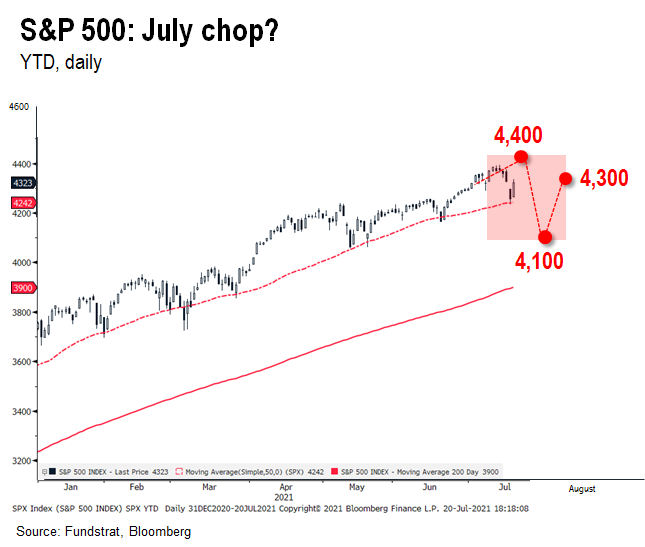
That said, our base case remains for July chop. Could this have been the “chop” and now it’s “greedy” time?
– the S&P 500 touched the 50D moving average
– and as shown below, has bounced smartly off that
Stocks remain resilient and for multiple reasons, we believe stocks will have a strong 2H2021:
– pent-up consumer demand “revenge spend”
– pent-up capex, corporate “revenge capex”
– pent-up stock buybacks, corporate “revenge buybacks”
– dovish Fed, more dovish due to uncertainties of Delta = bullish surprise
– scared policymakers due to Delta = more fiscal support
– interest rates low due to Delta = risk premia support
– scared investors = bad news priced in
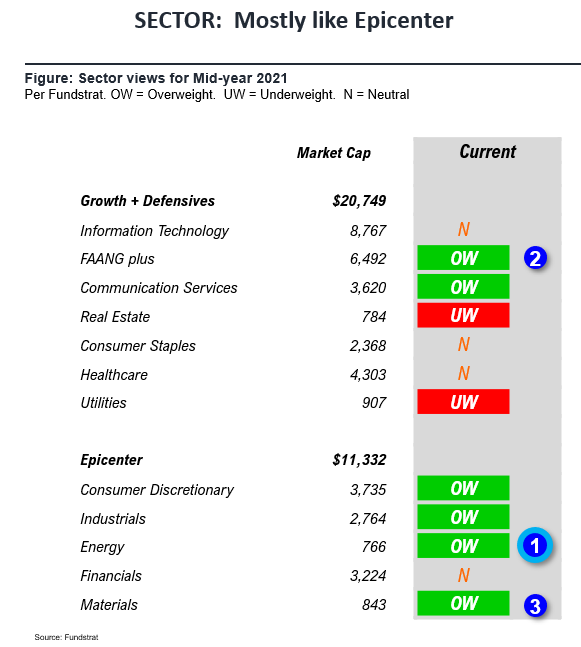
So you can see multiple reasons for a 2H rally. And we expect this to be led by Epicenter stocks. Our favorite sectors remain:
– Energy
– Technology
– Basic Materials
In other words, we believe in reflationary groups and also groups boosting productivity (labor force issues). Hence, Energy, Materials and Technology. The reflationary trades got clobbered due to Delta variant.
And once that “bark” mitigates, should results in a sharp rebound in reflationary trades.
Where will we be wrong? If Delta proves to be more of a healthcare risk than we realize. And as a result, policymakers will be forced to use blunt tools such as lockdowns.
POINT 1: Daily COVID-19 cases 33,237, up +11,344 (ex-FL) vs 7D ago… 7D delta (the speed of case rise) has been constant over the past 9 days…
_____________________________
Current Trends — COVID-19 cases:
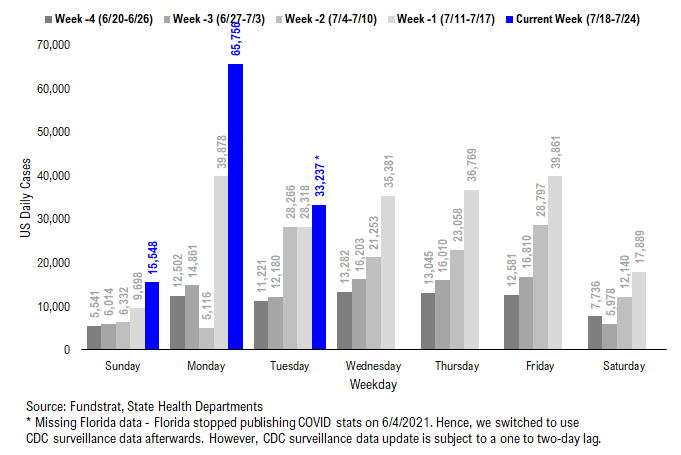
– Daily cases 33,237 vs 28,318 7D ago, up +4,919
– Daily cases ex-FL&NE 33,237 vs 21,893 7D ago, up +11,344
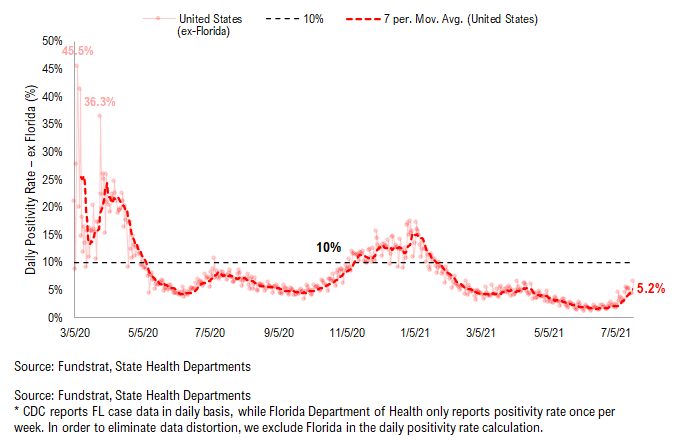
– 7D positivity rate 5.2% vs 3.5% 7D ago
– Hospitalized patients 24,520, up +29% vs 7D ago
– Daily deaths 229, down -15% vs 7D ago
_____________________________
*** Florida and Nebraska stopped publishing daily COVID stats updates on 6/4 and 6/30, respectively. We switched to use CDC surveillance data as the substitute. However, since CDC surveillance data is subject to a one-to-two day lag, we added a “US ex-FL&NE” in our daily cases and 7D delta sections in order to demonstrate a more comparable COVID development.
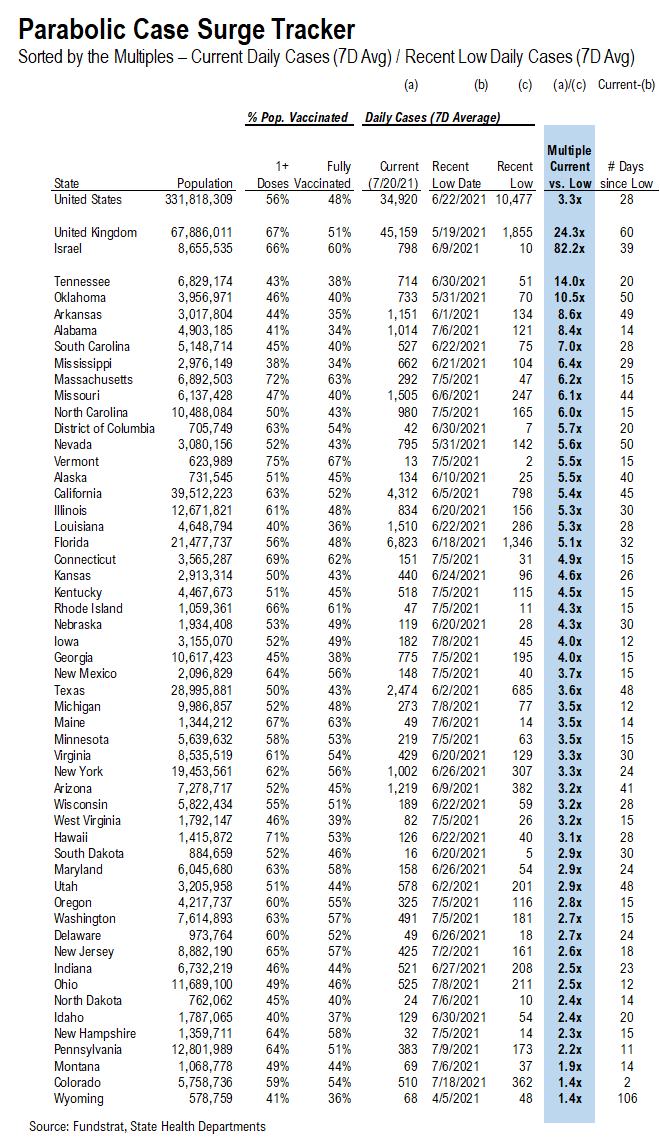
The latest COVID daily cases came in at 33,237, up +11,344 (ex-FL). The daily cases are still rising, but fortunately (at least so far), the cases are not surging parabolically. The 7D delta in daily cases has been flat over the past 9 days. However, the future is uncertain, so that it could rise rapidly. And we believe in order to prevent such a parabolic surge in case figures (and hospitalizations, death toll, too), continued efforts to get more people vaccinated is the key, especially in this “wave of unvaccinated.”Currently, TN, OK, AR, SC, AL, MO, and MS are the states with the largest increase in daily cases compared to their recent lows (as shown in the “parabolic” tracker below), and all 7 states have less than 50% of their populations vaccinated with at least one dose. This is consistent with what we wrote before regarding the majority of new cases being amongst unvaccinated individuals, and with what we noted previously, vaccination penetration appears to have some causal relationship with the case trend. Therefore, the COVID developments (both the case and vaccination trends) in these states along with the other low vaccinated states (such as LA, GA, ID, WY, ND, IN) are worth watching.
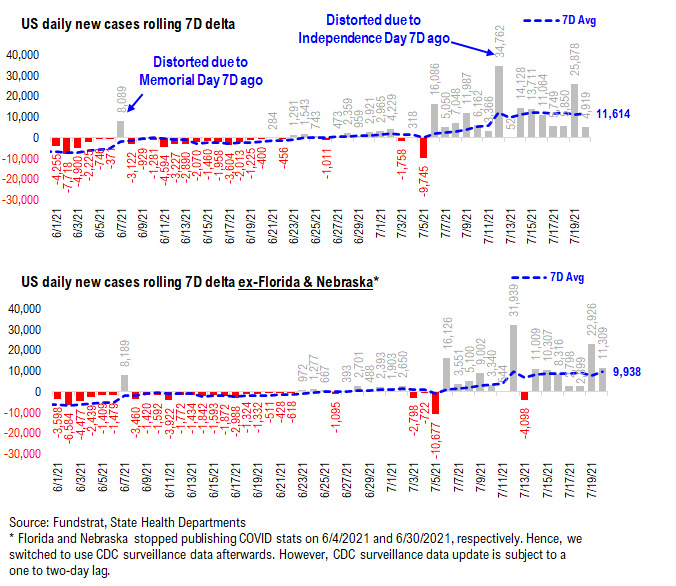
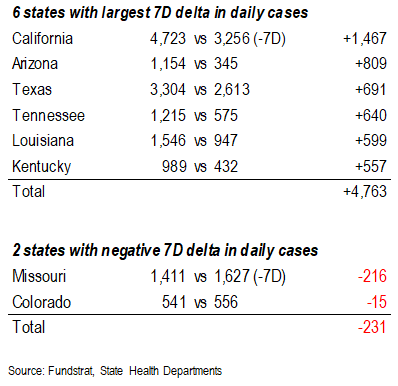
7D delta in daily cases has been about 10,000, flat-lined over the past 8 days…
The 7D delta in daily cases now rose to approximately 10,000, but it has flat-lined over the past few days. The good news is the speed of case increase is not parabolic. However, the future is uncertain, so that it could rise rapidly. We will be closely watching this metric.
Low vaccinated states seem to have a larger increase in daily cases compared to their recent low…
Below, we added a new section called “Parabolic Case Surge Tracker” to monitor the possible parabolic surge in daily case figures. In the table, we included both the vaccine penetration and the recent case trend for 50 US states + DC. The table is sorted by the multiple of their current daily cases divided by their recent low in daily cases.
– The states with higher ranks are the states that have seen a more significant rise in daily cases
– We also calculated the number of days between now and the recent low date; a state with a high multiple but low number of days since its low means the state is facing a relatively rapid surge in daily cases
– The US as a whole, UK, and Israel are also shown at the top as a reference
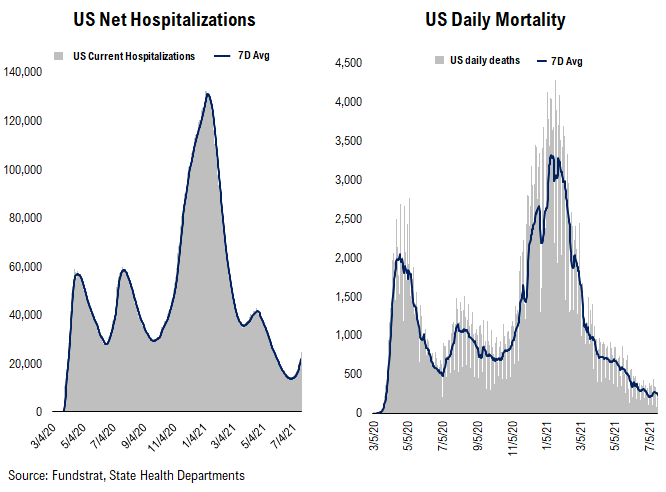
Current hospitalization and positivity rates are rising… Daily deaths also seem to be turning upwards now…
Below we show the aggregate number of patients hospitalized due to COVID, daily mortality associated with COVID, and the daily positivity rate for COVID. As you can see, hospitalization and daily deaths are relatively low compared to the prior waves. However, with the recent increase in daily cases, current hospitalization is clearly turning upwards, while daily deaths also appear to be turning. Regarding positivity rate, it recently exceeded 5%, which is higher than the positivity rate we observed during the “mini” wave this April and significantly higher than the recent low of <2%.
POINT 2: VACCINE: vaccination pace has been flat over the past week… The effort to get more people fully vaccinated remains the key…
_____________________________
Current Trends — Vaccinations:
– avg 0.5 million this past week vs 0.5 million last week
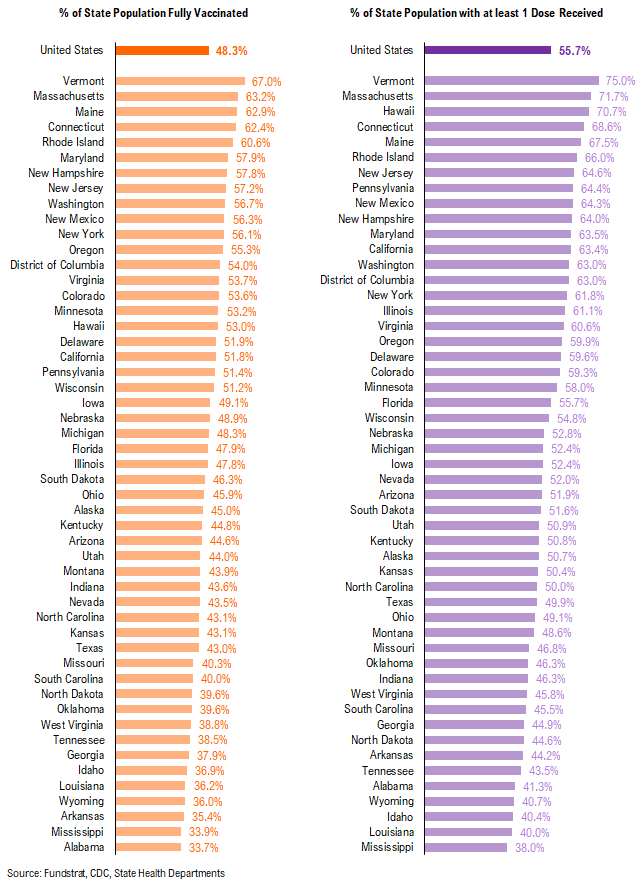
– overall, 48.3% fully vaccinated, 55.7% 1-dose+ received
_____________________________
Vaccination frontier update –> all states now near or above 80% combined penetration (vaccines + infections)
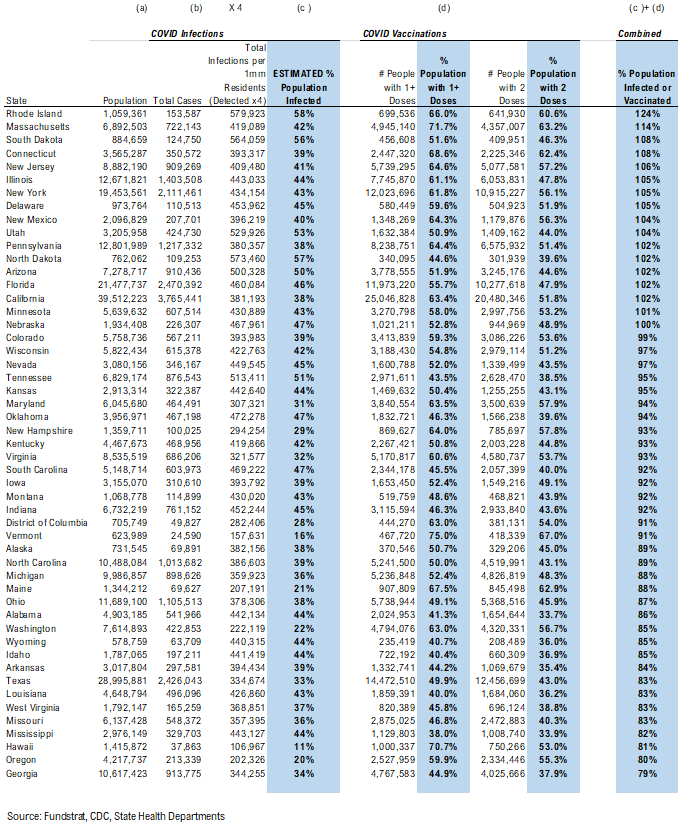
Below we sorted the states by the combined penetration (vaccinations + infections). The assumption is that a state with higher combined penetration is likely to be closer to herd immunity, and therefore, less likely to see a parabolic surge in daily cases and deaths. Please note that this “combined penetration” metric can be over 100%, as infected people could also be vaccinated (actually recommended by CDC).
– Currently, all states are near or above 80% combined penetration
– RI, MA, SD, CT, NJ, IL, NY, DE, NM, UT, PA, ND, AZ, MN, CA, FL are now above 100% combined penetration (vaccines + infections). Again, this metric can be over 100%, as infected people could also be vaccinated. But 100% combined penetration does not mean that the entire population within each state is either infected or vaccinated.
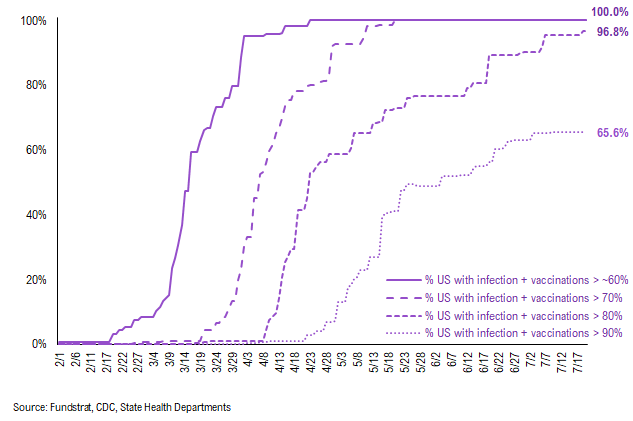
Below is a diffusion chart that shows the % of US states (based on state population) that have reached the combined penetration >60%/70%/80%/90%. As you can see, all states have reached 60% and 70% combined vaccination + infection. 96.8% of US states (based on state population) have seen combined infection & vaccination >80% and 65.6% of US states have seen combined infection & vaccination >90%.
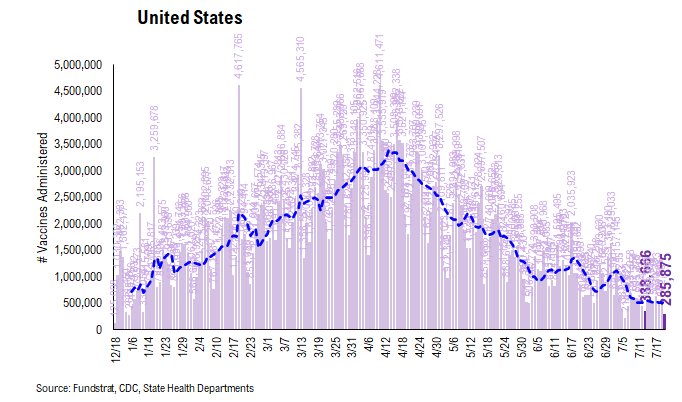
There were a total of 285,875 doses administered reported on Tuesday. Over the past 7 days, 508,269 doses were administered per day on average, down 4.0% from 7D ago. Over the past 10 days, the vaccination speed has been flat, not fallen. However, compared to mid-April, the current vaccination rate remains low. Admittedly, nearly 2/3 of the US population eligible (age 12+) to receive COVID vaccines have already received at least one dose. For some people among the rest 1/3, the vaccine hesitancy concerns might not easily be reversed. But in order to prevent another parabolic surge in daily cases, hospitalization and fatalities, getting more people fully vaccinated remains the key.
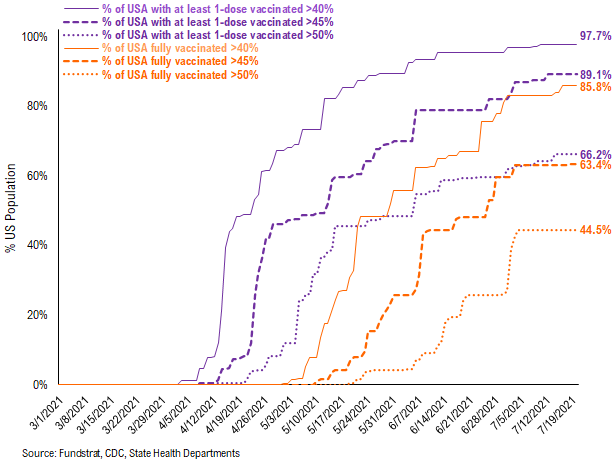
97.7% of the US has seen 1-dose penetration >40%…
To better illustrate the actual footprint of the US vaccination effort, we have a time series showing the percent of the US with at least 45%/45%/50% of its residents fully vaccinated, displayed as the orange line on the chart. Currently, 85.8% of US states have seen 40% of their residents fully vaccinated. However, when looking at the percentage of the US with at least 45% of its residents fully vaccinated, this figure is 63.4%. And only 44.5% of US (by state population) have seen 50% of its residents fully vaccinated.
– While 97.7% of US states have seen vaccine penetration >40%, 89.1% of them have seen 1 dose penetration >45% and 66.2% of them have seen 1 dose penetration > 50%.
– 85.8% of the US has at least 40% of its residents fully vaccinated, However, only 63.4% of US has fully vaccinated >45% and 44.5% of US has fully vaccinated >50%.
This is the state by state data below, showing information for individuals with one dose and two doses.
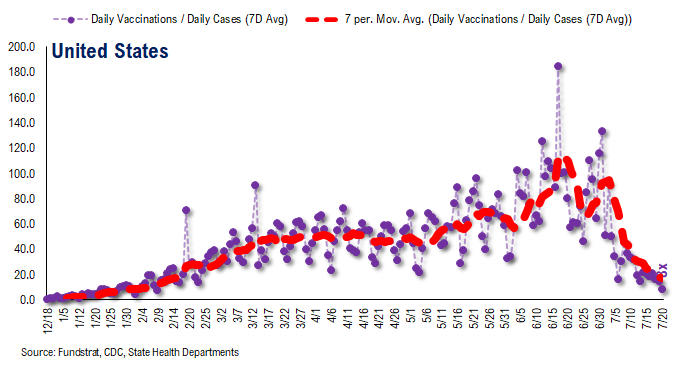
The ratio of vaccinations/ daily confirmed cases has been falling significantly (red line is 7D moving avg). Both the surge in daily cases and decrease in daily vaccines administered contributed to this.
– the 7D moving average is about ~20 for the past few days
– this means 20 vaccines dosed for every 1 confirmed case
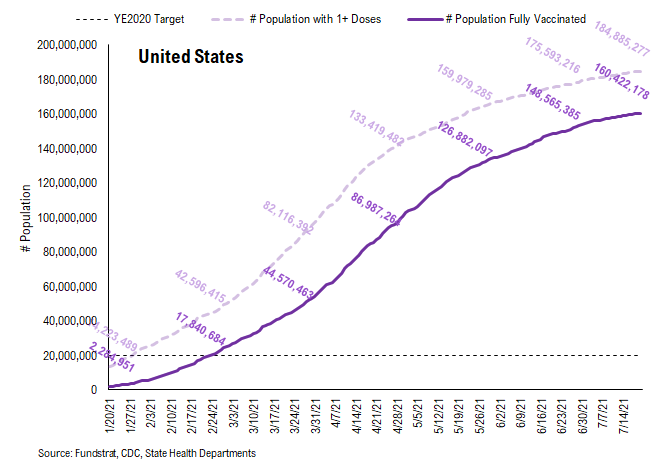
In total, 337 million vaccine doses have been administered across the country. Specifically, 185 million Americans (56% of US population) have received at least 1 dose of the vaccine. And 160 million Americans (48% of US population) are fully vaccinated.
POINT 3: Tracking restrictions lifting and subsequent effects in individual states
Point #3 focuses primarily on tracking the lifting of restrictions, as states have eased the majority of mandates. Keep in mind, easing/lifting restrictions are contingent upon state of emergency ordinances being renewed.
– States in groups 1 and 2 represent states that let their emergency ordinances expire, or that never had one in the first place
– Note: IL and HI are not listed. This is because restrictions lifting is determined at the county / island level, and no statewide policy will be established to lift restrictions until a full reopening
So there is a spectrum of approaches. Our team is listing 3 tiers of states and these are shown below.
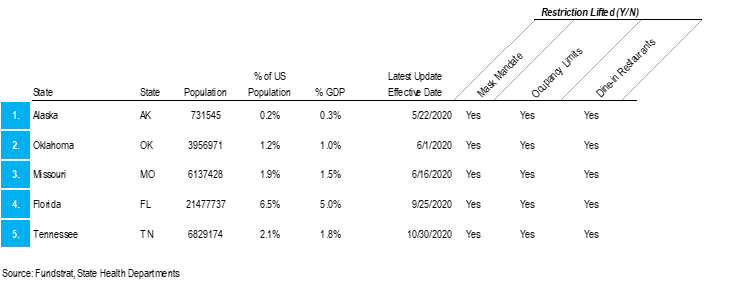
– states that eased all restrictions in 2020: AK, OK, MO, FL, TN
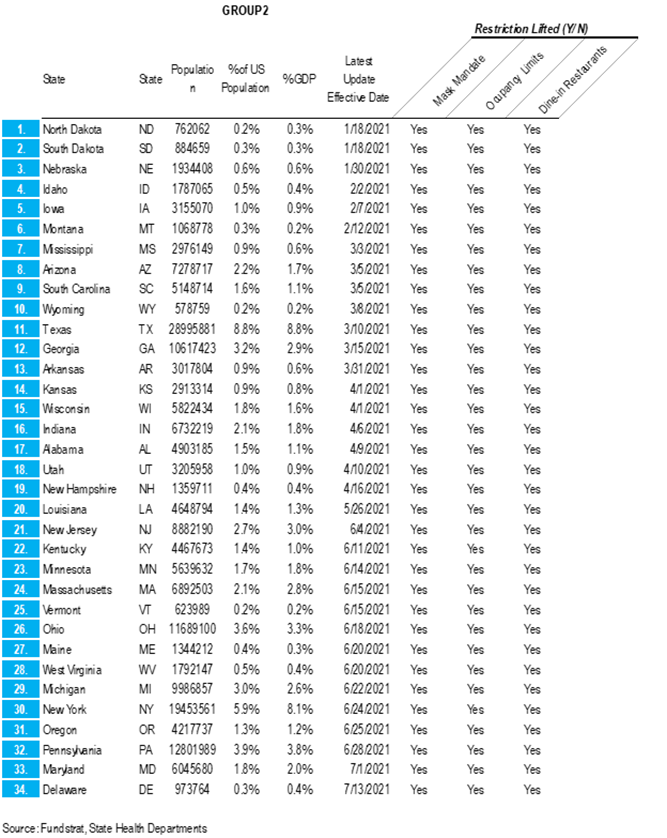
– states that have eased all restrictions in 2021 to now: ND, SD, NE, ID, IA, MT, MS, AZ, SC, WY, TX, GA, AR, KS, WI, IN, AL, UT, NH, LA, NJ, KY, MN, MA, VT, OH, WV, ME, MI, NY, OR, PA, MD, DE
– states that are still easing restrictions in 2021: WA, NC, CA, NM, CO, NV, CT, VA, RI, DC
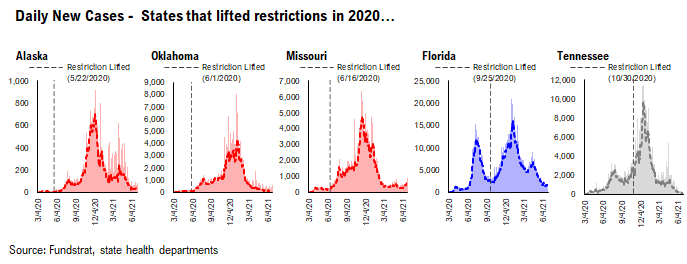
GROUP 1: States that lifted restrictions in 2020…
The daily case trends in these states are impressive and it is difficult to say that lifting restrictions has actually caused a new wave of cases because the case trends in these states look like other states.
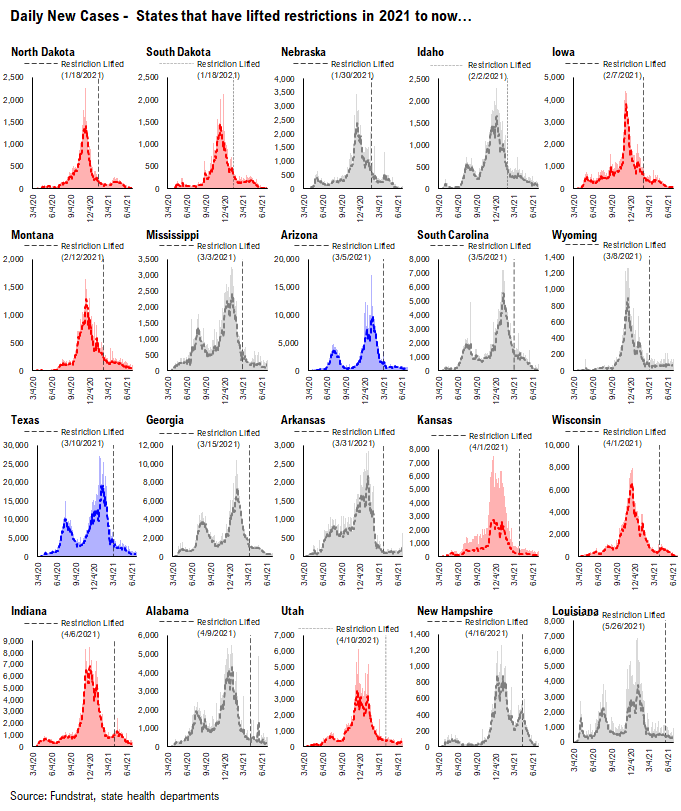
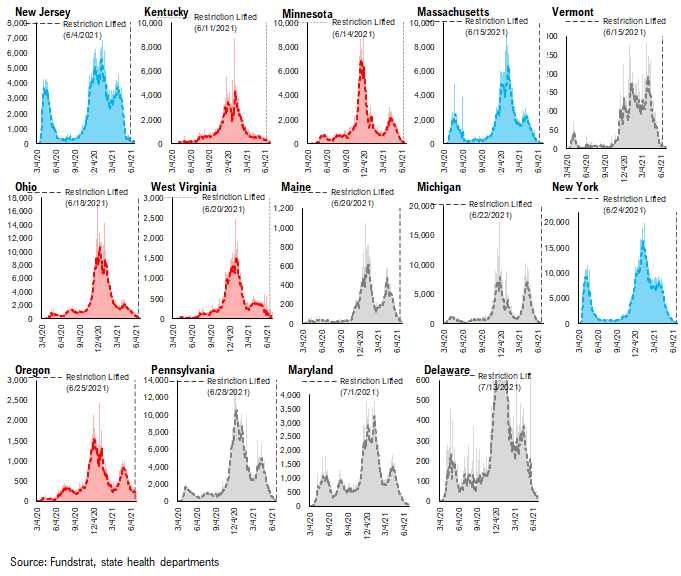
GROUP 2: States that have lifted restrictions in 2021 to now…
Similar to the list of states above, the daily case trends in these states are impressive and it seems that lifting restrictions hasn’t caused an increase in cases.
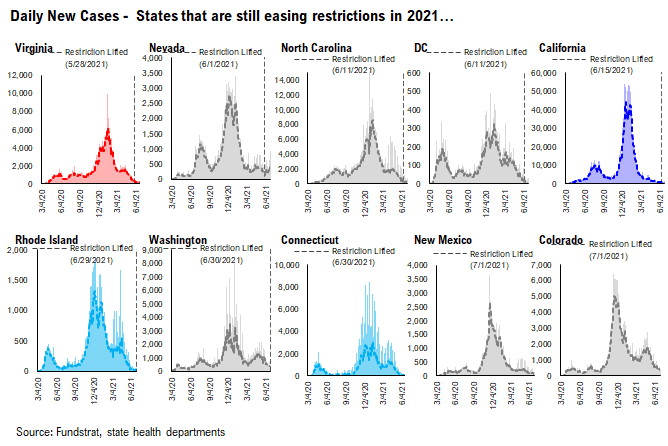
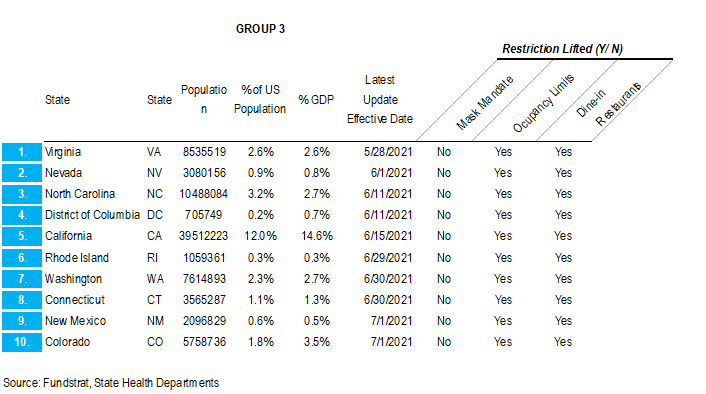
GROUP 3: States that are still easing restrictions in 2021…
These states have begun to lift restrictions, but have yet to ease all restrictions. The date of each state’s most recent restrictions lifting is indicated on each chart. The case trends in these states have been mostly positive.
– Easing restrictions appears to have contributed to an increase in cases in several of these states, most drastically in OR, ME, WA, and MN