


Half-full vs Half-empty --> the public and markets going "half-empty"

Click HERE to access the FSInsight COVID-19 Daily Chartbook.
We are shifting to a 4-day a week publication schedule:
Monday
Tuesday
Wednesday
SKIP THURSDAY
Friday
STRATEGY: Half-full vs Half-empty –> the public and markets going “half-empty”
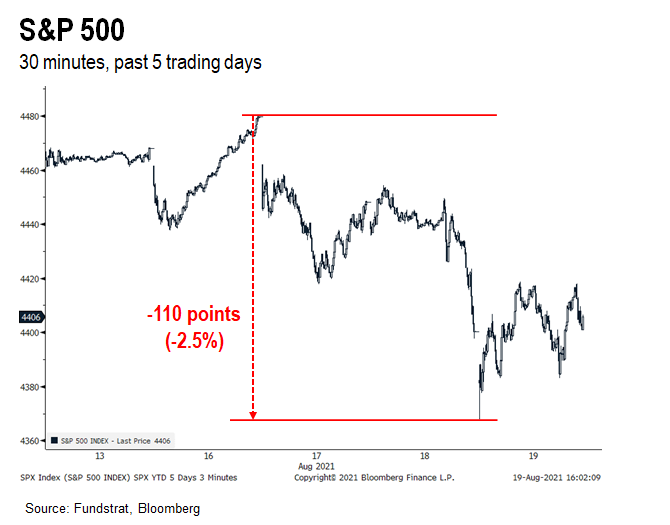
Since closing at an all-time high of 4,480 four days ago, the S&P 500 has been lurching violently lower. Based on our multiple conversations over the past week, it seems the wall of worry had grown to a level that was beyond the investor’s appetite for risk. Stocks have been internally weakening for some time, so the sell-off on Thursday morning was a continuation of the internal turmoil within markets.
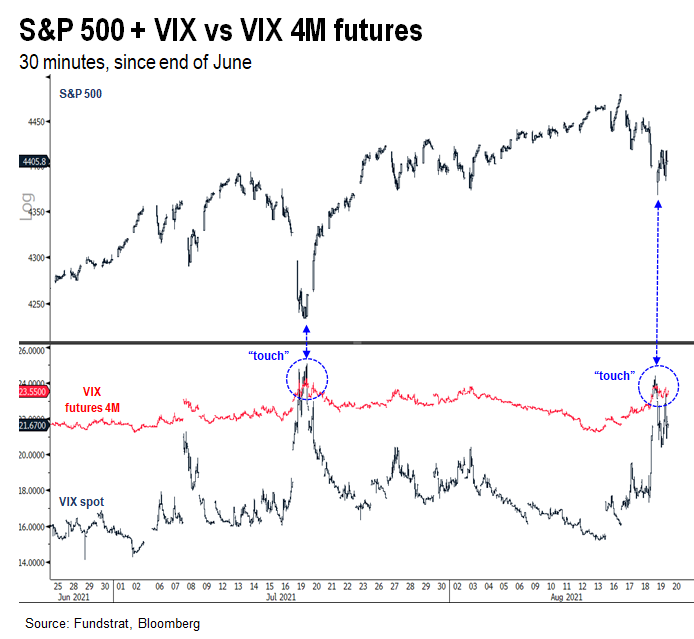
…But panic showed up in volatility markets, which if it reverses, is a sign that “bad news” is baked in
As Tom DeMark likes to say, “markets bottom on bad news, not good,” meaning stocks bottom when sellers are done selling. And when there are no sellers left, stocks begin to rise.
Selling is not the only way investors seek to reduce risk, they can also buy volatility — that is, investors can neutralize positions by betting on a near term rise in risk. Thus, one way to identify “sellers are done selling” is:
– when spot VIX surpasses VIX futures with a future settlement
– compare, for instance, VIX spot level vs VIX futures 4M forward
Look below, you can see within the session this am, the spot VIX (dark blue) surpassed 4M VIX (red line).
– it was a “touch” because at the close, VIX spot settled below VIX 4M futures
– this same “touch” took place on 7/19
– on 7/19, the S&P 500 bottomed
– and rallied 6% over the next 12 trading sessions
Thus, if Thursday’s touch is analogous to 7/19, Thursday was the selling crescendo. Not at the close, but in the morning session.
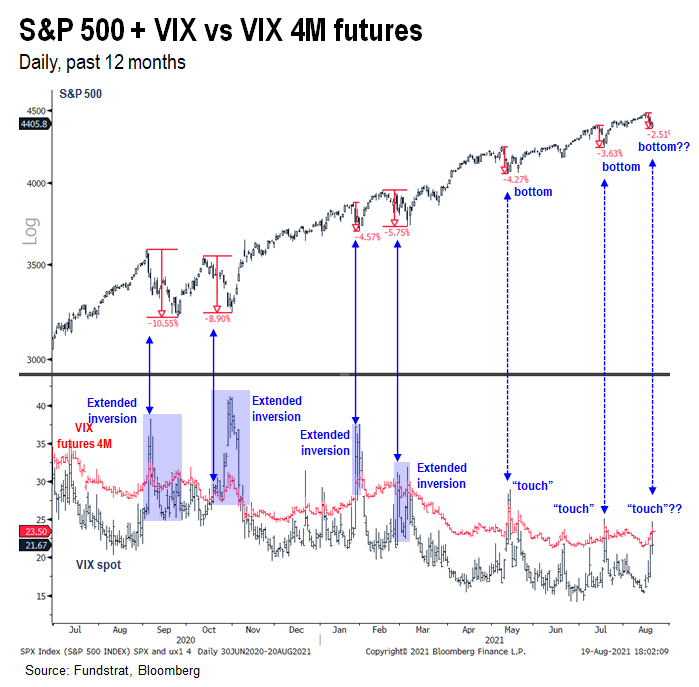
…”touch” or “extended inversion”: VIX inversions were seen at the last 6 market lows, but the duration is the question
It is probably self-evident that inversions in VIX take place at market bottoms — panic selling/ panic protection seeking. But the key question is whether this inversion is:
– “touch” lasting 1-2 days –> market low contemporaneous
– “extended inversion” –> week long process and final low is at that last date
As shown below, since the March 2020 bottom, these inversions have lasted for a shorter and shorter period of time. This has a few meanings:
– VIX was elevated in 2020, so inversions also lasted multi-sessions
– VIX level is now decline in a trend
– shorter inversions mean shorter corrections
If we had to guess, we think this episode will be a touch. Why? There are multiple reasons:
– Delta variant is running its course in multiple US states
– US yield curve remains steep, not flattening = constructive
– Investors are already showing signs of panic, particularly in sector rotation
– Anecdotally, we see lots of evidence of “half-full” interpretations
Largest ever UK study of vaccine effectiveness vs Delta: Half-full or half-empty? Depends on which continent
An example of this “half-full” thinking is the latest comprehensive study of vaccine effectiveness. UK Researchers just published their findings from the largest ever COVID-19 vaccine effectiveness study, sampling > 740,00 participants. This study was unique because it looked at vaccine effectiveness over time and across Astra-zeneca and Pfizer’s vaccine. There was limited review of Moderna’s.
– the key conclusion is two doses of either Astra or Pfizer significantly reduced risk of COVID-19
– even against Delta variant
– the WHO threshold is 50% effectiveness, and both Astra and Pfizer’s vaccine surpassed this, even after 4-5 months
– Pfizer’s effectiveness starts higher, however, after 4-5 months drifts towards the efficacy of Astra (which was more stable)
But the key conclusions of the authors is vaccine’s are effective against the Delta variant. And there are some open questions, such as whether high viral loads of breakthroughs results in greater spread or whether this leads to more severe outcomes.
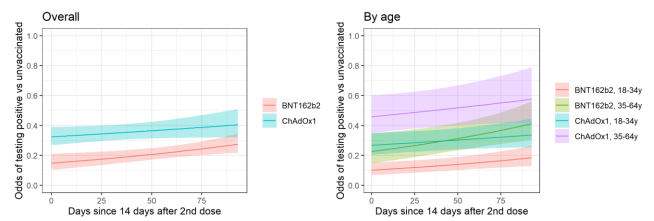
This chart from the report shows this time effect and both by age and overall:
– BNT –> Pfizer
– ChAdOx –> Astra Zeneca
You can see that Pfizer is superior but effectiveness does wane towards Astra, but not necessarily a material decline.
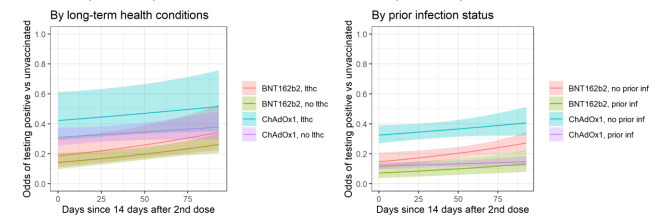
This second set of charts shows that the vaccine waning effects and also protection are impacted by co-morbidities and by having “previous infection”:
– a co-morbidity makes vaccines less effective
– prior infection makes vaccines more effective
Neither is a surprise, actually.
…Media coverage: One study, two completely different headlines
But look at the media coverage of this study. This is one study, but with two completely different headlines:
– BBC –> “covid vaccines still effective against Delta variant”
– Bloomberg –> “covid shots are less effective against Delta in UK study”
This is comical. One study. The results I showed above. Two completely different stories. I included the links to the articles. And if you read both, you will have two completely different takeaways.
Yup. Half-full versus half-empty.

https://www.bloomberg.com/news/articles/2021-08-18/covid-vaccines-are-less-effective-against-delta-in-u-k-study
HALF-FULL OR HALF-EMPTY? UK cases: 4 of 9 regions seeing sustained declines in cases, but 5 of 9 stubborn plateau
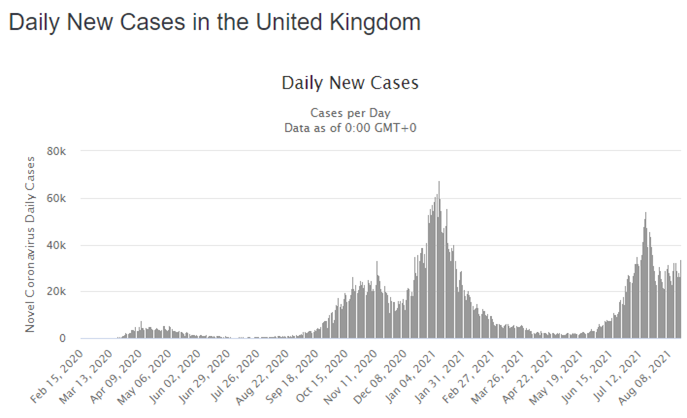
Another example is the UK case counts. As shown below, the UK had a surge in COVID-19 cases from Delta and after a sharp fall, daily cases have been flattish. But this is not the entire story.
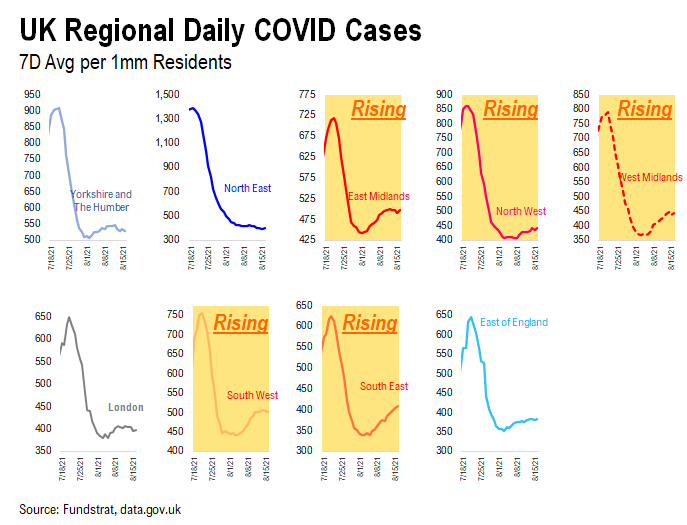
…Looking at 9 regions of UK, shows that COVID-19 waning in 4 of 9 regions
Looking at the 9 regions tracked by the UK Health ministry, we see two divergent paths:
– collapses in 4 of 9 regions hit hardest by Delta, such as Yorkshire/ Humber and North East and even London, etc
– stable/slight rising in 5 of 9 regions
The composite shows cases flat/ rising, but the actual diffusion, underlying trends are actually better than is apparent.
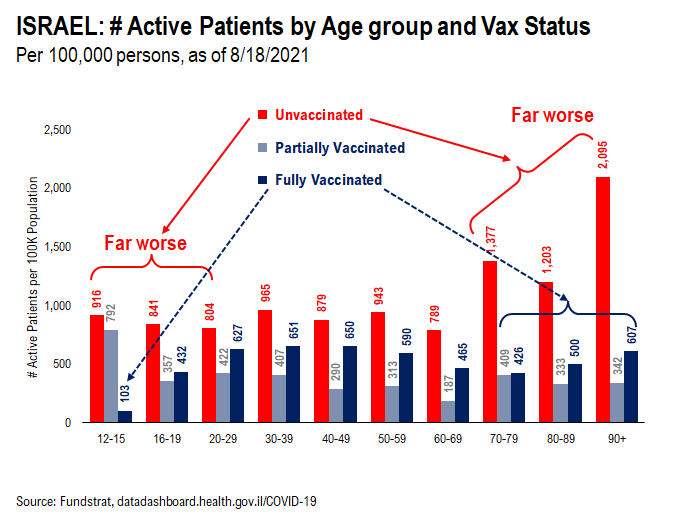
HALF-FULL OR HALF-EMPTY? Israel case prevalence vaxxed vs unvaxxed
Similarly, take a look at the active case data in Israel. Israel is seeing a high level of breakthrough cases. About 75% of Israel adults are vaccinated, leaving about 25% unvaccinated.
– Israel is cited as example that vaccine effectiveness wanes over time
– thus, rising breakthrough cases –> true to an extent
But look at the composition of active cases. The data is “right sized” using active cases per 100,000 residents:
– highest case rate –> unvaxxed age 90-plus –> 2,095 per 100k
– by comparison: vaxxed age 90-plus –> 607
– unvaxxed age 12-15 –> 916 per 100k
– vaxxed age 12-15 –> 103 per 100k
So, while breakthroughs are happening, the penetration or prevalence is far lower among vaccinated cohorts.
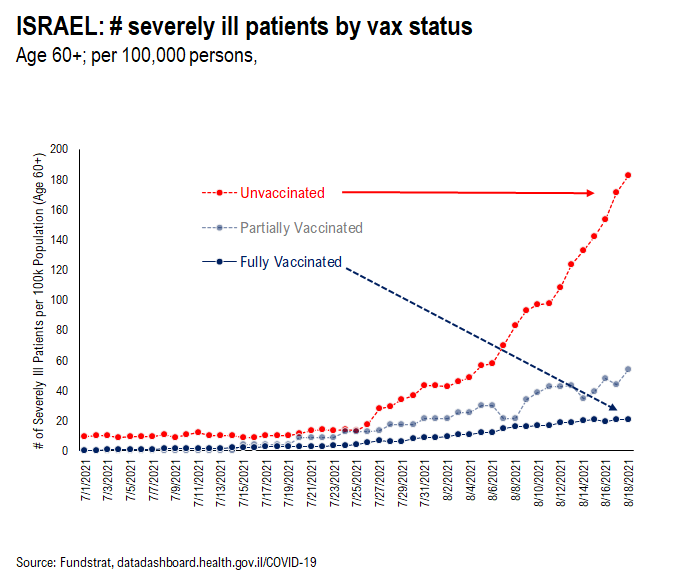
…divergence between vaxxed and unvaxxed soaring with time
In fact, look at the prevalence of severely ill patients below. This is patients age 60-plus:
– fully vaxxed prevalence is up but a stable and low slope
– unvaxxed prevalence is exploding
To me, vaccinations seem to mitigate severe illness in Israel.
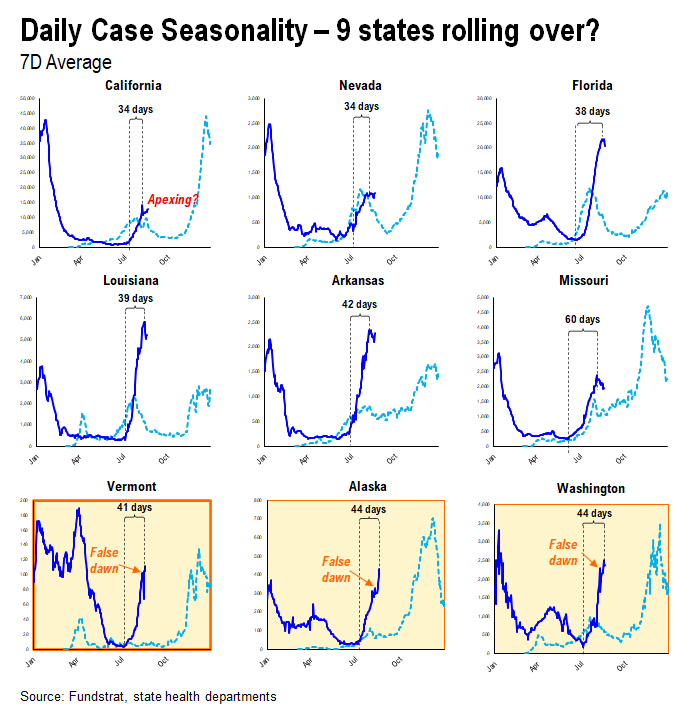
6 US states seem to have notable rolling over of cases, but 3 were false dawns
Earlier this week, we highlighted 9 states which seemed to have COVID-19 cases rolling over. A good sign. Updating this data, it looks like it is actually more like 6 states. 3 were false dawns:
– 6 states are CA, NV, FL, LA, AR, MO
– it took 34-60 days for cases to peak
But it looks like VT, AK and WA were false dawns, as cases are still rising in these states. Still, COVID-19 is not rampaging through states indefinitely. While Delta variant is highly contagious, it also seems to burn through a community faster than prior variants. Thus, while COVID-19 cases are rising in US (not peaking as we had hoped), it is peaking in some states.
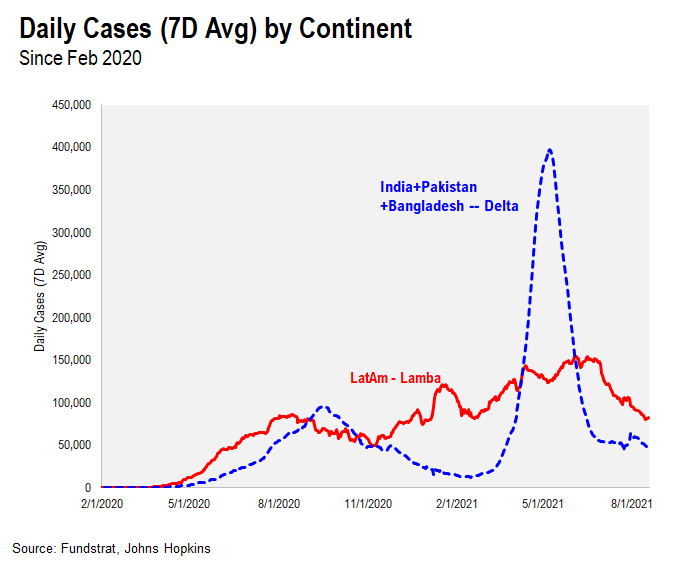
HALF-FULL or HALF-EMPTY: COVID-19 waning dramatically in Latin America and India
One last observation. It is winter in Latin America, so we would naturally cases to be surging in Latin America. And the Lambda variant first emerged in Latin America. And India saw the first reported cases of the Delta variant:
– Latin American cases rolling over hard
– India cases rolling over hard
So these two regions, hit hardest by a highly transmissible variant, are now seeing cases fall sharply.
BOTTOM LINE: Half-full or half-empty –> are headwinds structural or transitory
As this relates to markets, we think the key question is whether the headwinds identified Thursday are transitory or structural:
– Delta variant effect on consumer travel –> cancelled plans, permanent or transitory
– Collapse in soft survey such as consumer confidence –> permanent or transitory
– Demand for oil, commodities –> permanent or transitory
– Corporate uncertainty –> permanent or transitory
– Questions of vaccine ability to neutralize COVID-19 –>permanent or transitory
– Negative fallout for Afghanistan –> Global economy impact permanent or transitory
– Collapse in investor confidence due to Delta variant risks –> permanent or transitory
If one thinks these are transitory, then one’s reaction to the market fallout would vary. Based on our conversations, many investors seem to think these issues have become permanent and thus, are reducing their outlook for markets and upside potential.
…if it is transitory, this is a “buyer’s strike” which will naturally end
On the other hand, if these are transitory, then investors are simply going on a buyer’s strike now. This is why trading volumes have been light, but markets have fallen sharply.
Our central case is “fuller risk on” into YE…
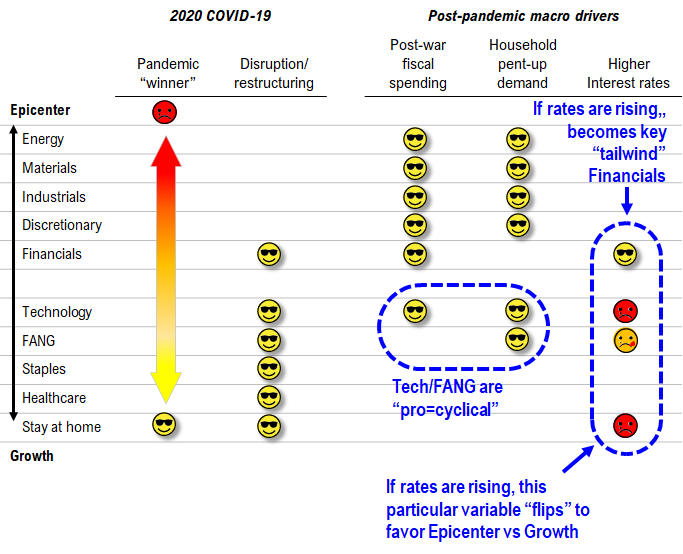
Our rationale for recommending Epicenter stocks is shown below. Post-pandemic drivers favor Epicenter, particularly if we are going full risk-on.
– the key inflection in the past 10 days is the reversal higher in interest rates
– this becomes a big tailwind for Financials XLF1.38%
– this also is a tailwind for Energy XLE1.20% OIH0.82% (see note from last Tuesday)
– we still like FAANG because there is a pro-cyclical element to FAANG FNGS-4.09%
– there is also a catch-up trade for AMZN-2.56% AAPL-1.22% which are up a mere 2%/9% versus 18% for S&P 500
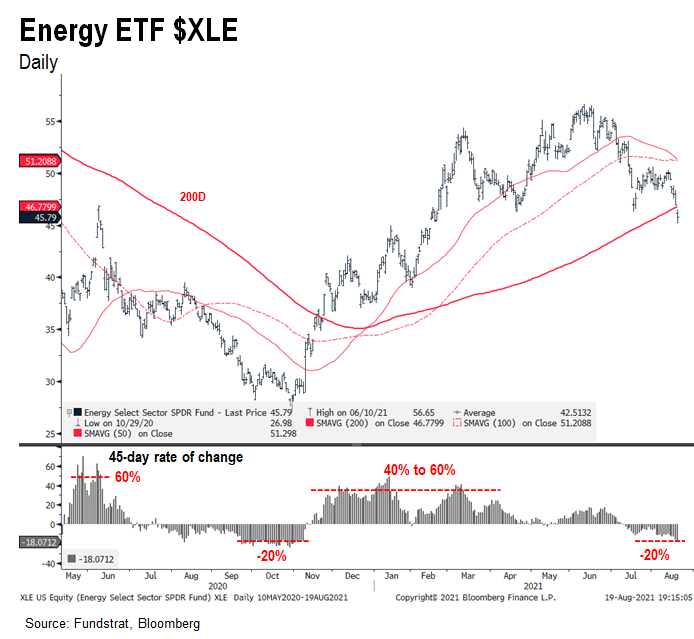
Energy is at 200D mavg, and we expect XLE1.20% to re-attain this –> stay out of the kitchen if you cannot handle “the fire”
Energy stocks have tended to have violent moves. See the 45 day rate of change below (lower part of chart). And as you can see, XLE is either soaring or falling, but with large magnitude moves:
– the sell-off since June has been staggering
– oil has fallen, but the reaction of Energy equities is outsized, because equities are more sensitive to buyer’s strikes
– but XLE1.20% is hovering near its 200-day moving average
– and the 200D shows XLE remains in a strong uptrend
If you think the risks outlined above are permanent, then Energy stocks will keep falling.
If you think these are transitory, then Energy will resume a violent uptrend.
– COVID-19 cases could peak within days
– Booster shots bolster immunity
– Consumer panic means mitigation steps being taken
I am in the camp these are transitory headwinds.
__________________________
26 Granny Shot Ideas: We performed our quarterly rebalance on 07/30. Full stock list here –> Click here
___________________________
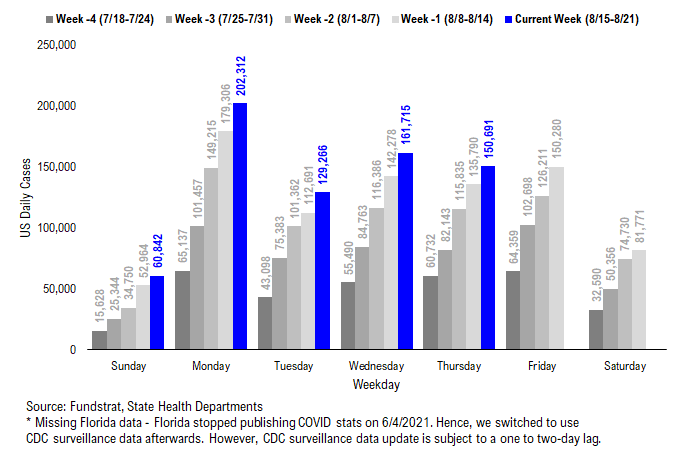
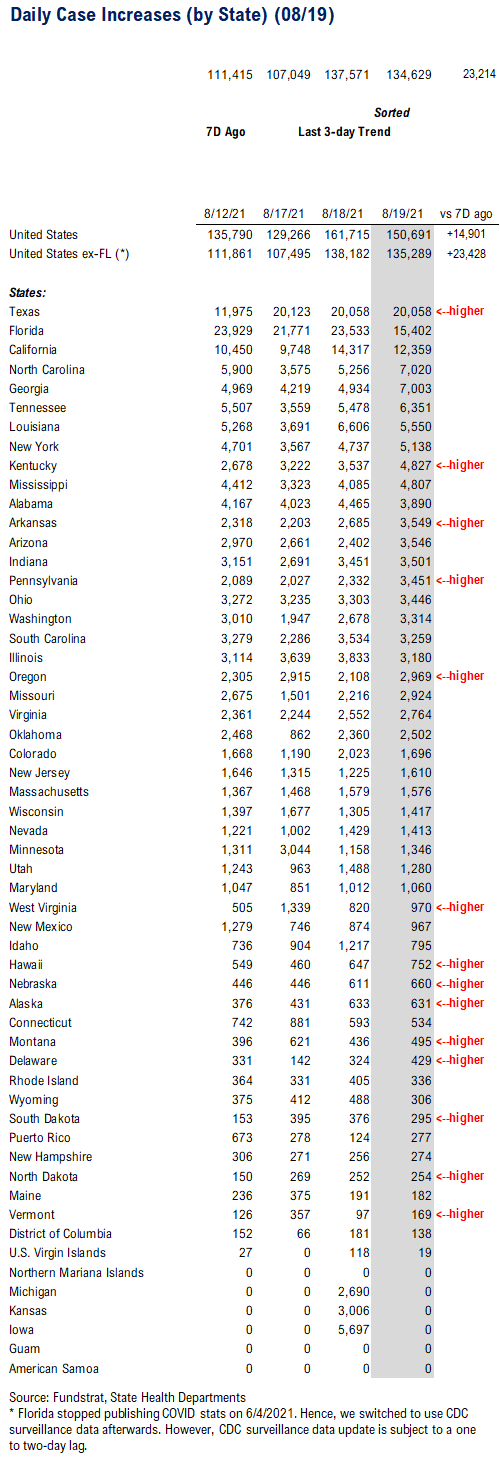
POINT 1: Daily COVID-19 cases 150,691, up +14,901 vs 7D ago…
_____________________________
Current Trends — COVID-19 cases:
– Daily cases 150,691 vs 135,790 7D ago, up +14,901
– Daily cases ex-FL&NE 134,629 vs 111,415 7D ago, up +23,214
– 7D positivity rate 9.1% vs 8.7% 7D ago
– Hospitalized patients 87,599, up +15% vs 7D ago
– Daily deaths 723, up +26% vs 7D ago
_____________________________
*** Florida and Nebraska stopped publishing daily COVID stats updates on 6/4 and 6/30, respectively. We switched to use CDC surveillance data as the substitute. However, since CDC surveillance data is subject to a one-to-two day lag, we added a “US ex-FL&NE” in our daily cases and 7D delta sections in order to demonstrate a more comparable COVID development.
The latest COVID daily cases came in at 150,691, up +149,01 vs 7D ago.
– The daily cases are still rising, but at a slower rate.
– The 7D average of 7D delta in daily cases is still on a downtrend, primarily due to the case apexing in Florida. When excluding Florida and Nebraska, 7D delta in daily cases has been essentially flat over the past 4 days.
Currently, we are at the critical stage of case rollover for many states. The daily cases in some states (i.e. MO, LA, NV, AR) appear to have already rolled over (or apex right now), while the daily cases in some other states are still rising. We could have a more clear view on the case trend next week. Hopefully, we could see the daily cases in those “apexing” states start to fall next week. Anyhow, as long as the 7D delta continues to fall, the case rollover is just a matter of time.
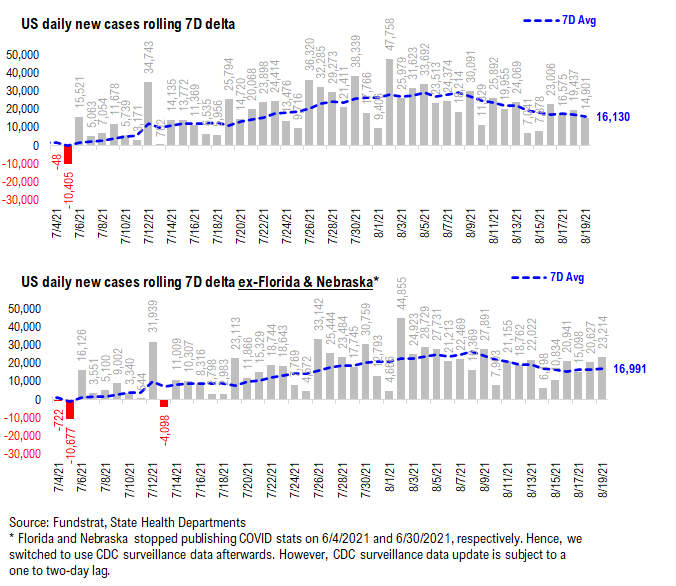
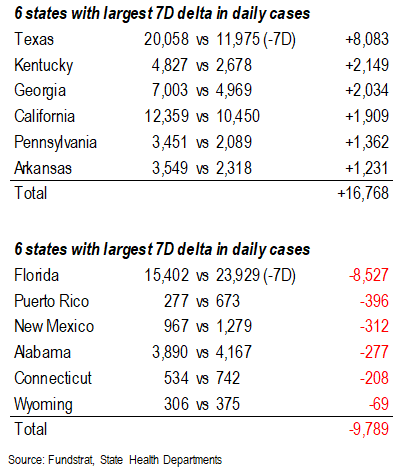
7D delta in daily cases fell to ~16,000 now…
As shown in the chart below, the 7D delta in daily cases seems to roll over now – down from ~26,000 two weeks ago to current level at about 16,000. As the daily cases in more states are apexing, we expect the decline in daily cases persists.
Low vaccinated states seem to have a larger increase in daily cases compared to their recent low…
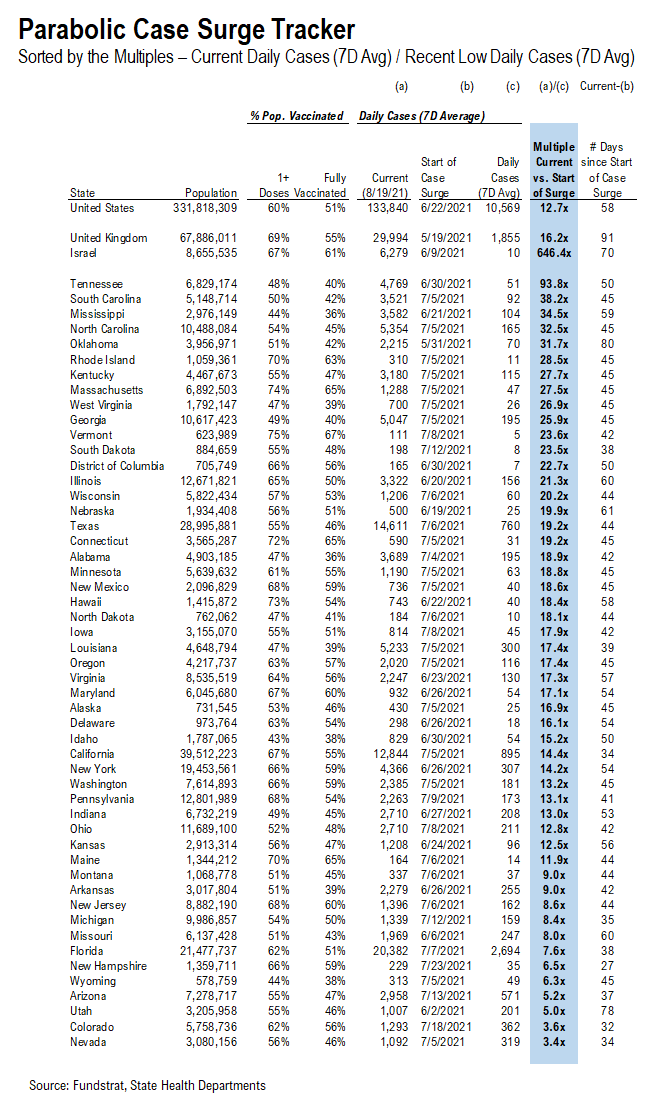
Below, we added a new section called “Parabolic Case Surge Tracker” to monitor the possible parabolic surge in daily case figures. In the table, we included both the vaccine penetration and the recent case trend for 50 US states + DC. The table is sorted by the multiple of their current daily cases divided by their recent low in daily cases.
– The states with higher ranks are the states that have seen a more significant rise in daily cases
– We also calculated the number of days between now and the recent low date; a state with a high multiple but low number of days since its low means the state is facing a relatively rapid surge in daily cases
– The US as a whole, UK, and Israel are also shown at the top as a reference
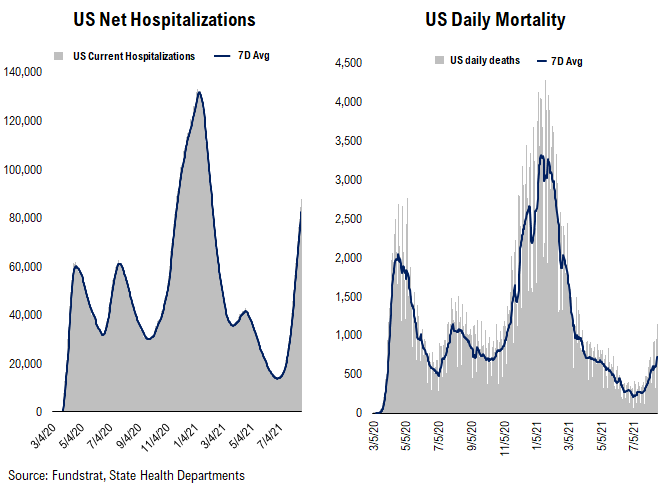
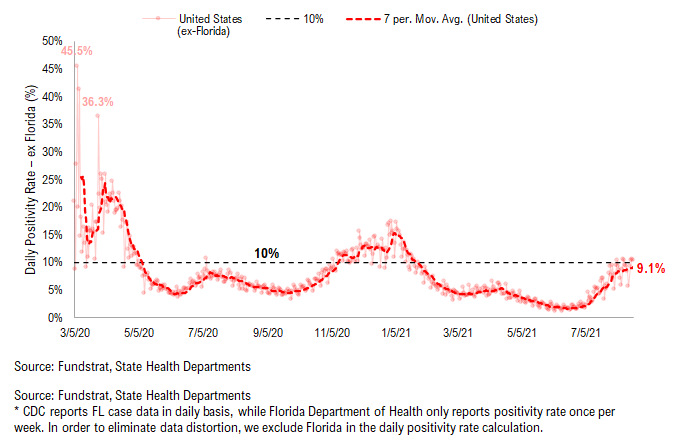
Hospitalization continues rising, while positivity rate starts to apex… Daily deaths is also trending upwards now…
Below we show the aggregate number of patients hospitalized due to COVID, daily mortality associated with COVID, and the daily positivity rate for COVID.
– Hospitalization has exceeded the peak level we’ve seen in Wave 1 and 2 in 2020 and continues surging.
– Positivity rate has been flat over the past few days and seems to apex. If it’s true, the positivity rate could roll over soon.
– Daily deaths have been trending upwards recently, but far less “dramatic” than the cases or hospitalization trends.
POINT 2: VACCINE: vaccination pace has been gradually rising over the past four weeks… Over half of Americans are fully vaccinated…
_____________________________
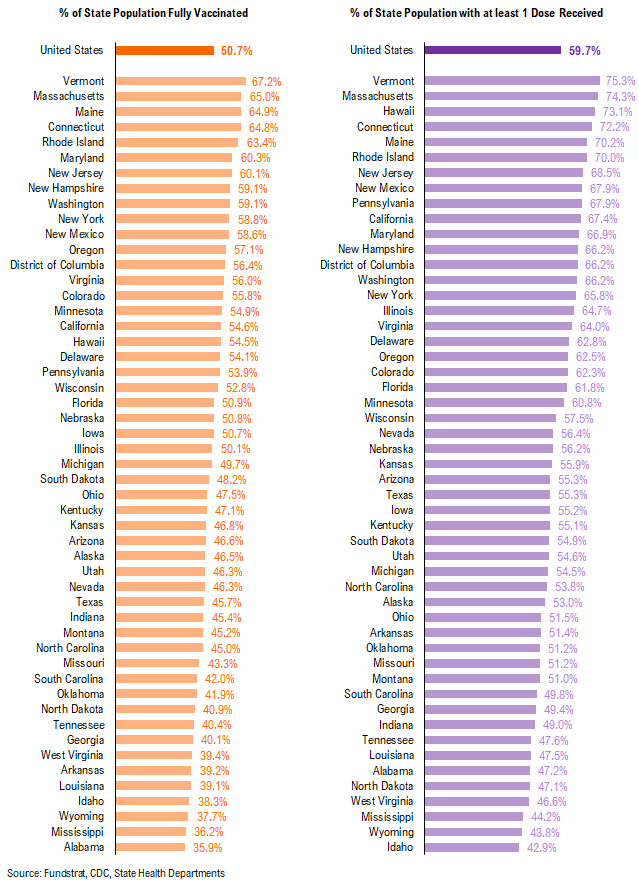
Current Trends — Vaccinations:
– avg 0.8 million this past week vs 0.7 million last week
– overall, 50.7% fully vaccinated, 59.7% 1-dose+ received
_____________________________
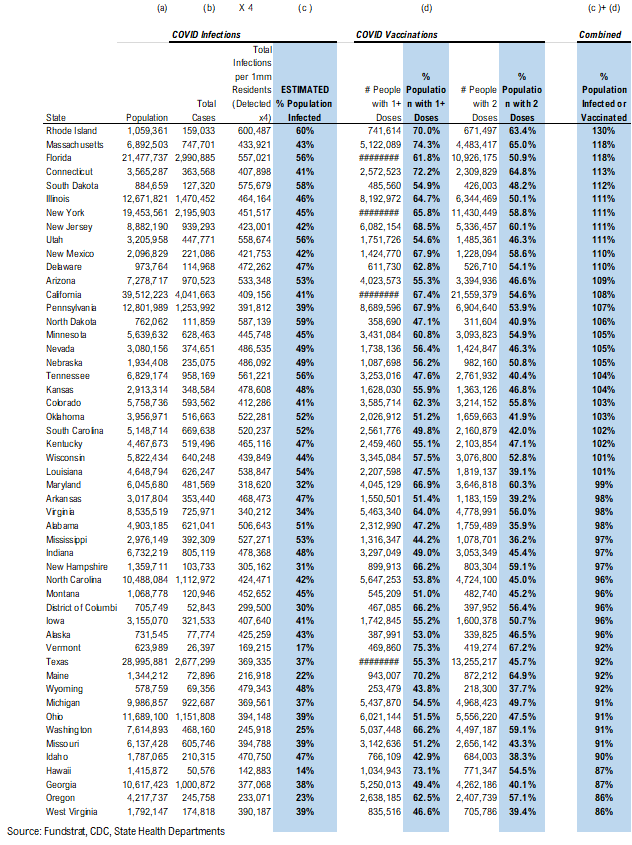
Vaccination frontier update –> all states now near or above 80% combined penetration (vaccines + infections)
Below we sorted the states by the combined penetration (vaccinations + infections). The assumption is that a state with higher combined penetration is likely to be closer to herd immunity, and therefore, less likely to see a parabolic surge in daily cases and deaths. Please note that this “combined penetration” metric can be over 100%, as infected people could also be vaccinated (actually recommended by CDC).
– Currently, all states are near or above 80% combined penetration
– RI, MA, FL, CT, SD, NJ, IL, NY, DE, NM, UT, PA, ND, NV, CO, KS, TN, OK, WI, SC, AZ, MN, CA, and NE are now above 100% combined penetration (vaccines + infections). Again, this metric can be over 100%, as infected people could also be vaccinated. But 100% combined penetration does not mean that the entire population within each state is either infected or vaccinated.
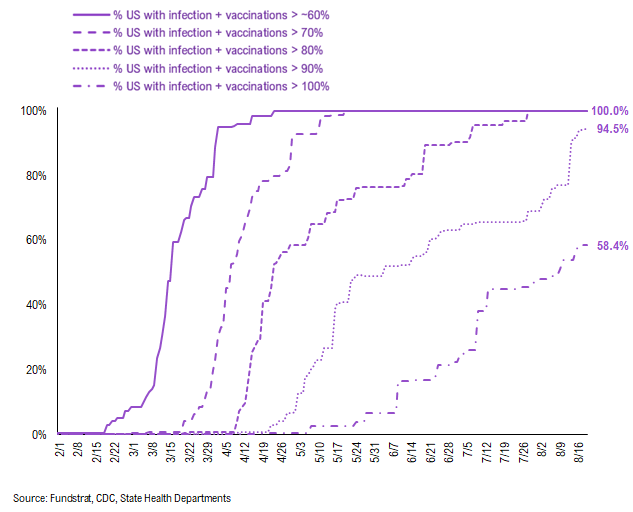
Below is a diffusion chart that shows the % of US states (based on state population) that have reached the combined penetration > 60%/70%/80%/90%/100%. As you can see, all states have reached 80% combined vaccination + infection. 94.5% of US states (based on state population) have seen combined infection & vaccination > 90% and 58.4% of US states have seen combined infection & vaccination > 100% (Reminder: this metric can be over 100%, as infected people could also be vaccinated. But 100% combined penetration does not mean that the entire population within the state is either infected or vaccinated).
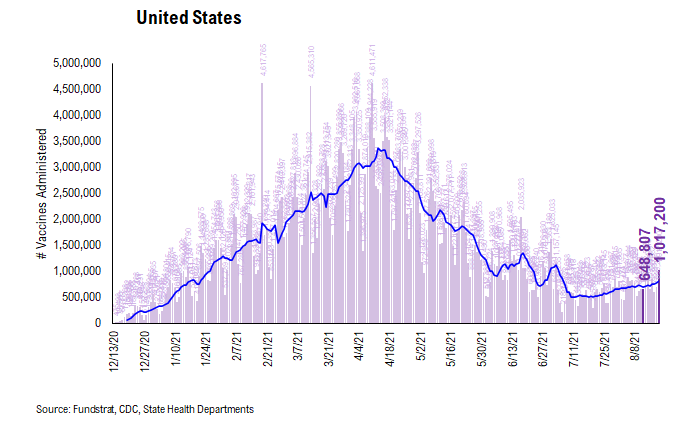
There were a total of 1,017,200 doses administered reported on Thursday. The vaccination pace has been up at a slower rate over the past few days. As we noted previously, many American cities are now requiring proof of vaccination for several activities: indoor dining, indoor fitness, and so on. Besides, certain venues are also now requiring proof of vaccination to enter. All these policies could play an important role in pushing more people to get vaccinated. The daily number of vaccine administered will be an important metric to track this progress and we will be closely watching the relevant data.
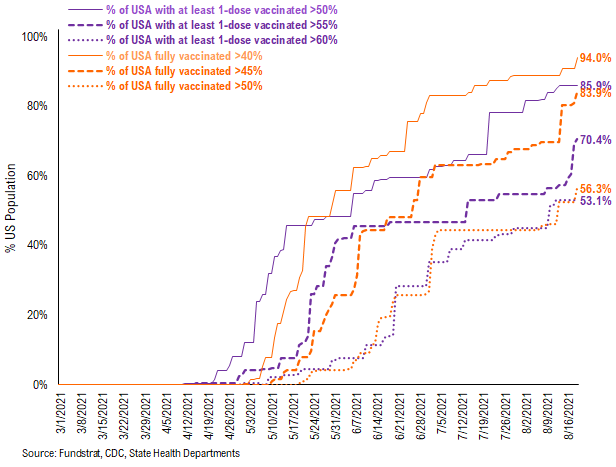
53.1% of the US has seen 1-dose penetration > 60%…
To better illustrate the actual footprint of the US vaccination effort, we have a time series showing the percent of the US with at least 45%/45%/50% of its residents fully vaccinated, displayed as the orange line on the chart. Currently, 94% of US states have seen 40% of their residents fully vaccinated. However, when looking at the percentage of the US with at least 45% of its residents fully vaccinated, this figure is 83.9%. And only 56.3% of US (by state population) have seen 50% of its residents fully vaccinated.
– While 85.9% of US states have seen vaccine penetration > 50%, 70.4% of them have seen 1 dose penetration > 55% and 53.1% of them have seen 1 dose penetration > 60%.
– 94.0% of the US has at least 40% of its residents fully vaccinated, However, only 83.9% of US has fully vaccinated > 45% and 56.3% of US has fully vaccinated > 50%.
This is the state by state data below, showing information for individuals with one dose and two doses.
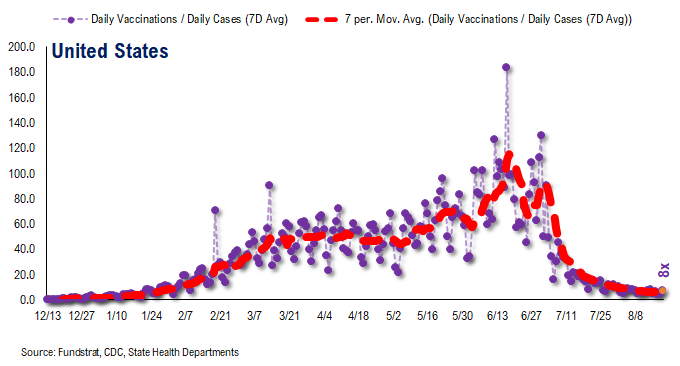
The ratio of vaccinations/ daily confirmed cases has been falling significantly (red line is 7D moving avg). Both the surge in daily cases and decrease in daily vaccines administered contributed to this.
– the 7D moving average is about ~8 for the past few days
– this means 8 vaccines dosed for every 1 confirmed case
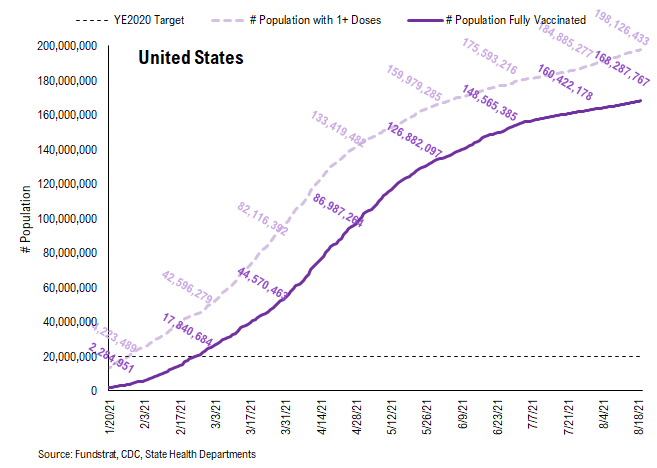
In total, 366 million vaccine doses have been administered across the country. Specifically, 198 million Americans (60% of US population) have received at least 1 dose of the vaccine. And 168 million Americans (51% of US population) are fully vaccinated.
POINT 3: Tracking the seasonality of COVID-19
In July, we noted that many states experienced similar case surges in 2021 to the ones they experienced in 2020. As such, along with the introduction of the more transmissible Delta variant, seasonality also appears to play an important role in the recent surge in daily cases, hospitalization, and deaths. Therefore, we think there might be a strong argument that COVID-19 is poised to become a seasonal virus.
The possible explanations for the seasonality we observed are:
– Outdoor Temperature: increasing indoor activities in the South vs increasing outdoor activities in the northeast during the Summer
– “Air Conditioning” Season: similar to “outdoor temperature”, more “AC” usage might facilitate the spread of the virus indoors
If this holds true, seasonal analysis suggests that the Delta spike could roll over by following a similar pattern to 2020.
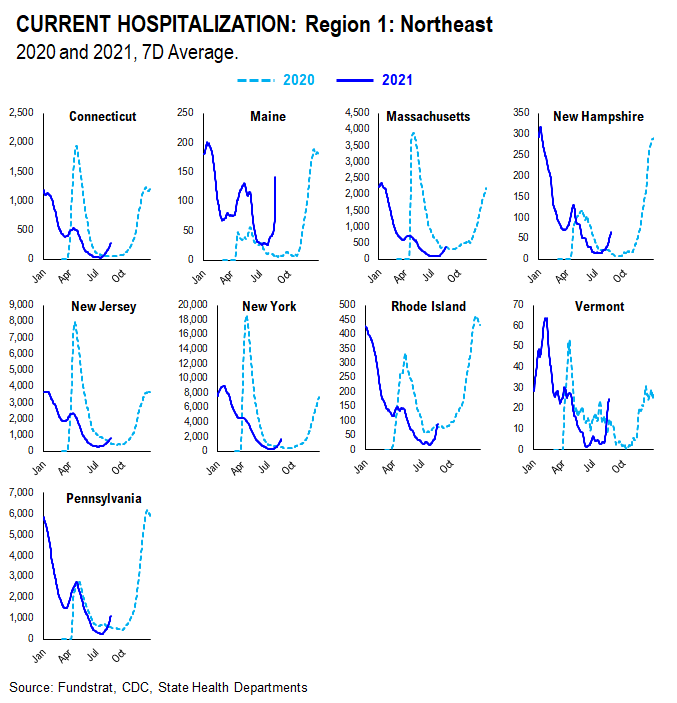
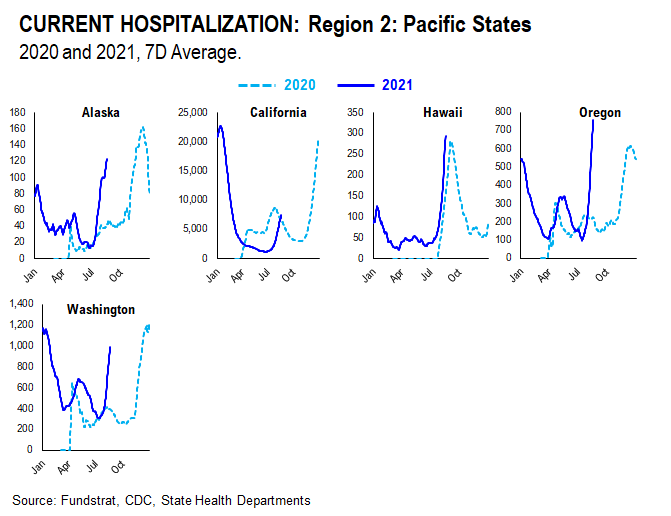
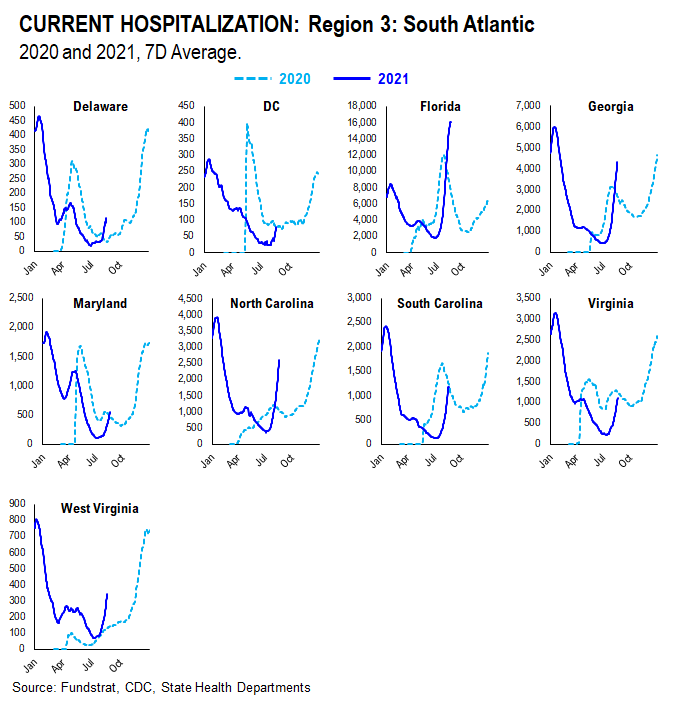
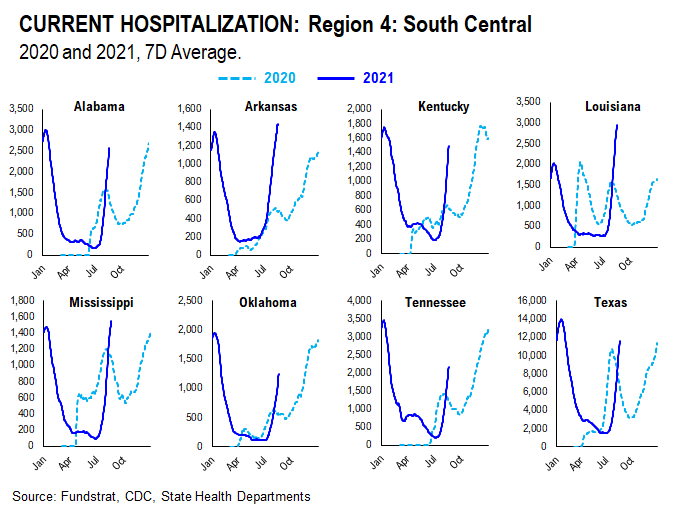
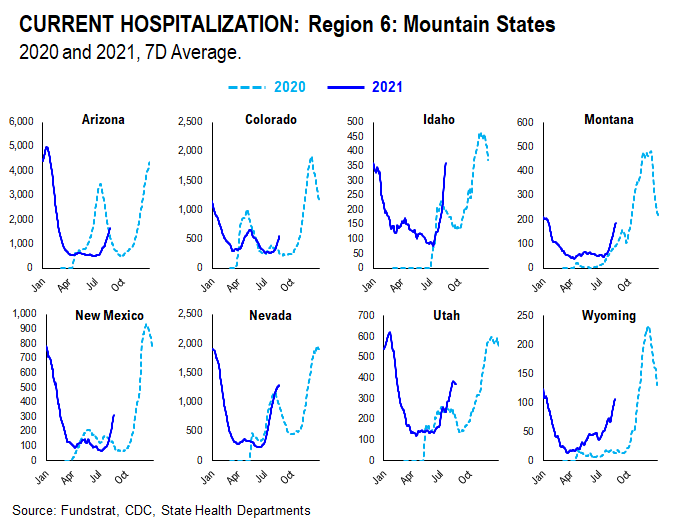
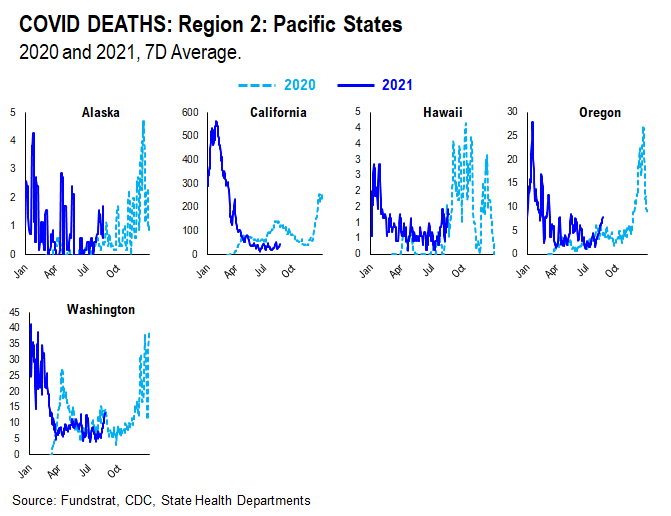
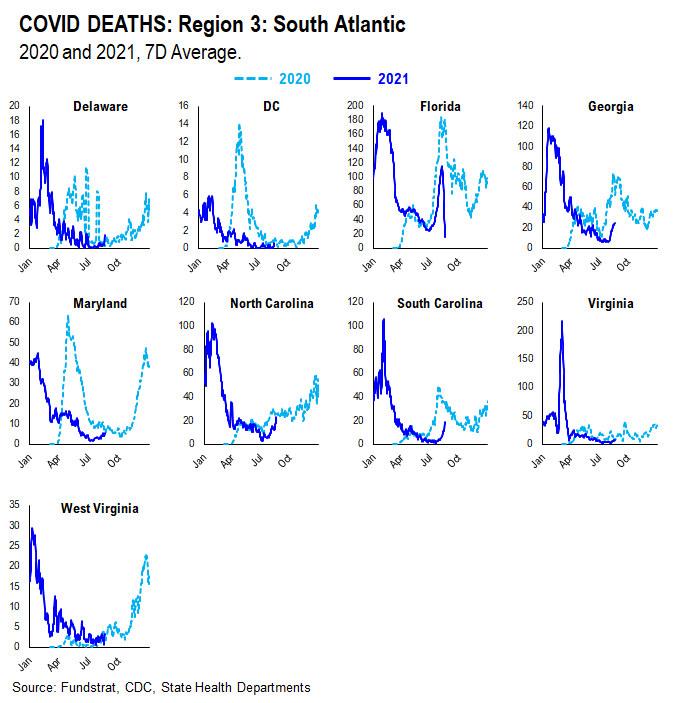
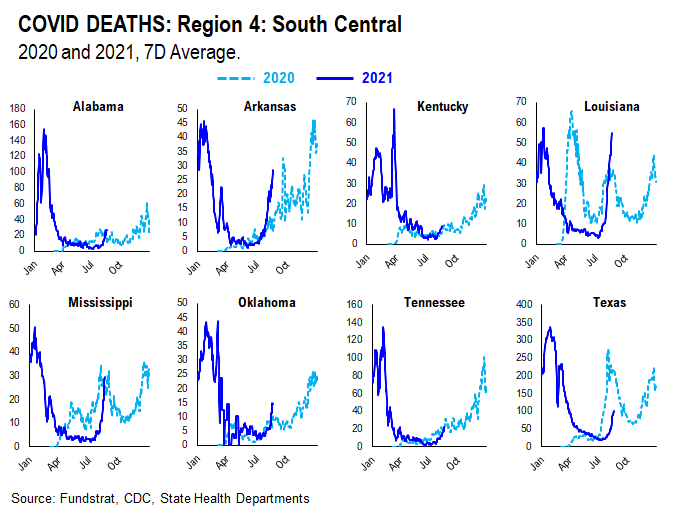
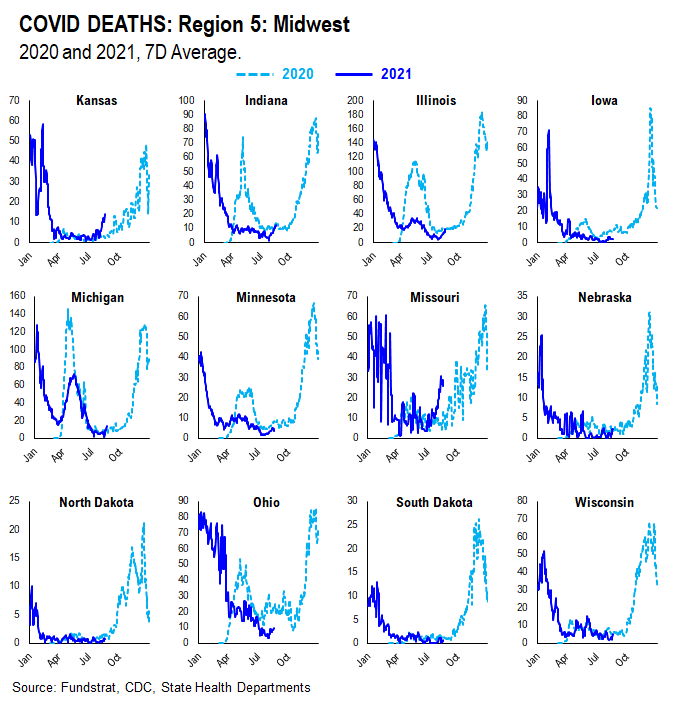
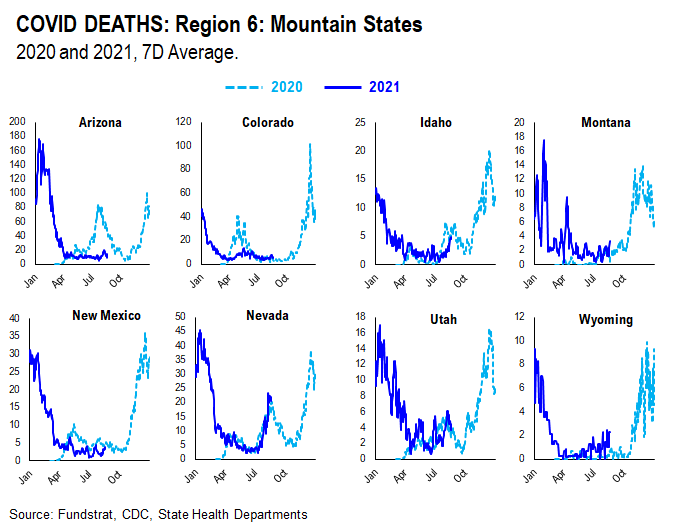
We created this new section within our COVID update which tracks and compare the case, hospitalization, and death trends in both 2020 and 2021 at the state level. We grouped states geographically as they tend to trend similarly.
CASES
It seems as if the main factor contributing to current case trends right now is outdoor temperature. During the Summer, outdoor activities are generally increased in the northern states as the weather becomes nicer. In southern states, on the other hand, it becomes too hot and indoor activities are increased. As such, northern state cases didn’t spike much during Summer 2020 while southern state cases did. Currently, northern state cases are showing a slight spike, especially when compared to Summer 2020. This could be attributed to the introduction of the more transmissible Delta variant and the lifting of restrictions combined with pent up demand for indoor activities.
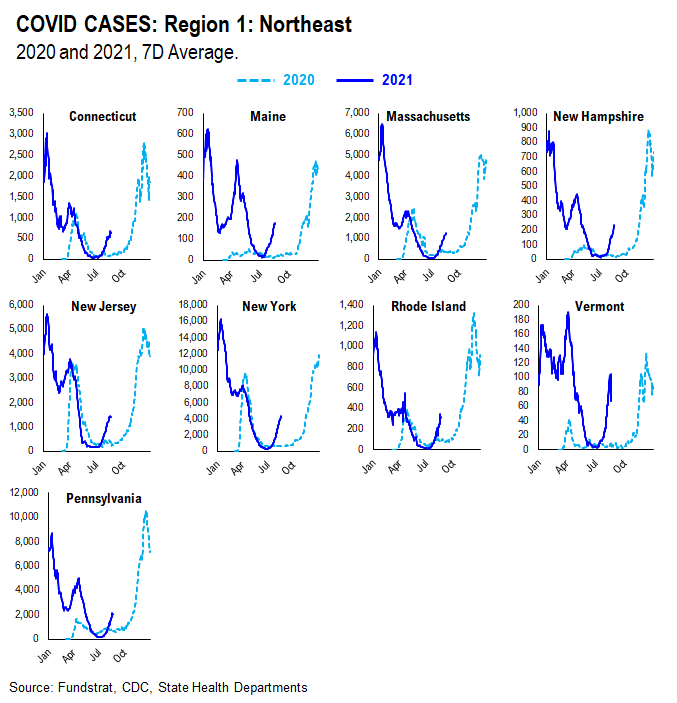
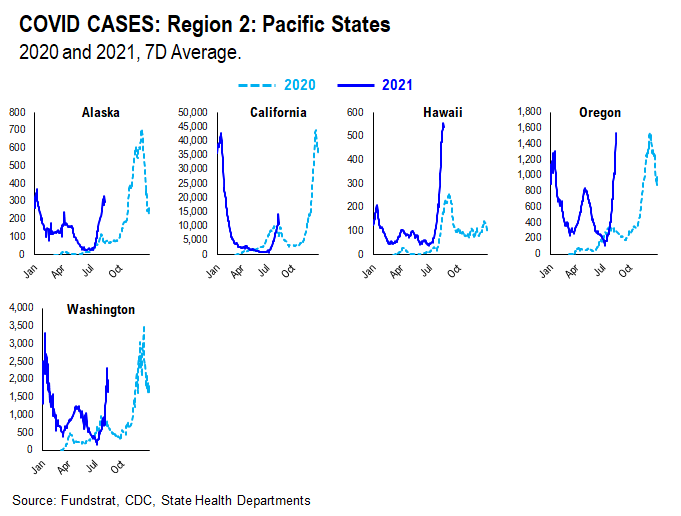
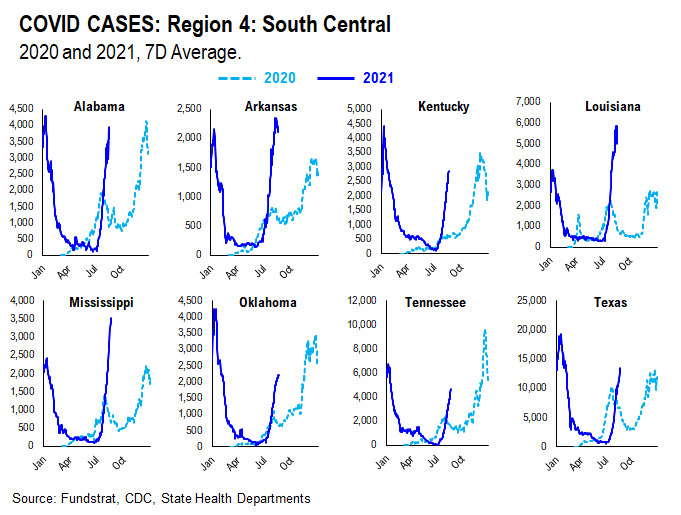
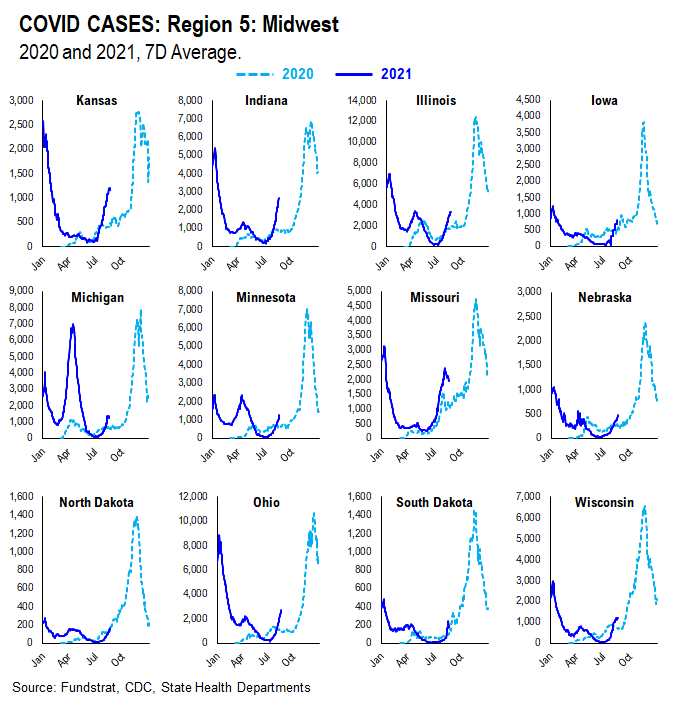
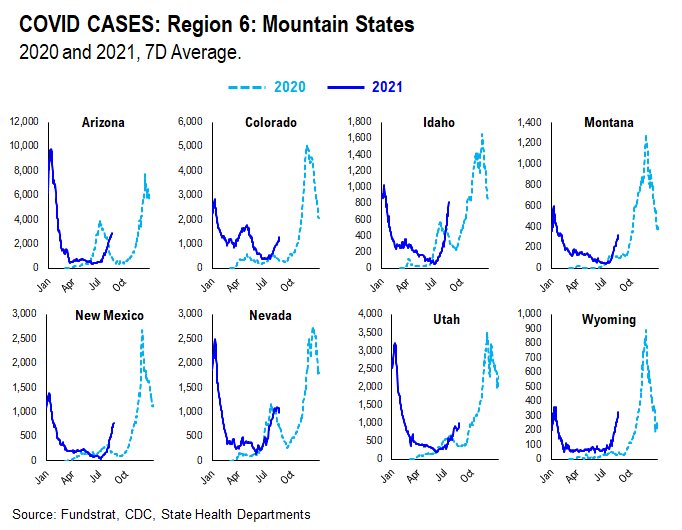
HOSPITALIZATION
Current hospitalizations appear to be similar or less than Summer 2020 rates in most states. This is likely due to increased vaccination rates and the vaccine’s ability to reduce the severity of the virus.

DEATHS
Current death rates appear to be scattered compared to 2020 rates. This is likely due to varying vaccination rates in each state. States with higher vaccination rates seem to have lower death rates given the vaccine’s ability to reduce the severity of the virus; states with lower vaccination rates seem to have higher death rates.

More from the author
Articles Read 1/2
🎁 Unlock 1 extra article by joining our Community!
Stay up to date with the latest articles. You’ll even get special recommendations weekly.
Already have an account? Sign In 631d47-a76f34-95faf4-103c58-f1fd24
Already have an account? Sign In 631d47-a76f34-95faf4-103c58-f1fd24

