

Entering October with a "cluster of worries" but stocks so oversold, we see reasons for upside

Click HERE to access the FSInsight COVID-19 Daily Chartbook.
We are shifting to a 4-day a week publication schedule:
Monday
Tuesday
Wednesday
SKIP THURSDAY
Friday
STRATEGY: Entering October with a “cluster of worries” but stocks so oversold, we see reasons for upside
COVID-19 is moving to the northern US states… but overall trends positive
COVID-19 overall remains in retreat in the US, evidenced best by looking at the 7D delta chart below. And aside from the distortions associated with Labor Day, we see see that the delta in cases are consistently negative and thus, pointing to a decline in cases.
– COVID-19 is impressively improving overall in the US
– and the mix effect of rising cases in the North vs falling in the South is still on balance declining overall
– this is good
…daily cases could slip under 100,000 per day next week
And on an aggregate basis, the case figures look ready to dip below 100,000 cases per day by sometime next week. But there is a mix shift taking place:
– cases are declining in the South
– but flu season is starting across the US
– this generally leads to a rise in cases in northern states
– the state-level data is already showing this
– IHME forecasts that overall cases might start to creep up in mid-October due to this effect
So, this could prove to be a temporary reprieve.
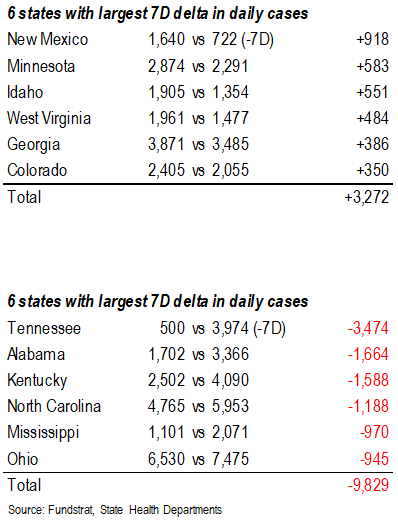
This chart shows the level of cases (per 1mm residents) and the redder the worse the case impact. And as you can see:
– the states in the North are seeing the highest cases per capita.
– the states in the North are also seeing the largest 7D increases in new cases (per 1mm residents)
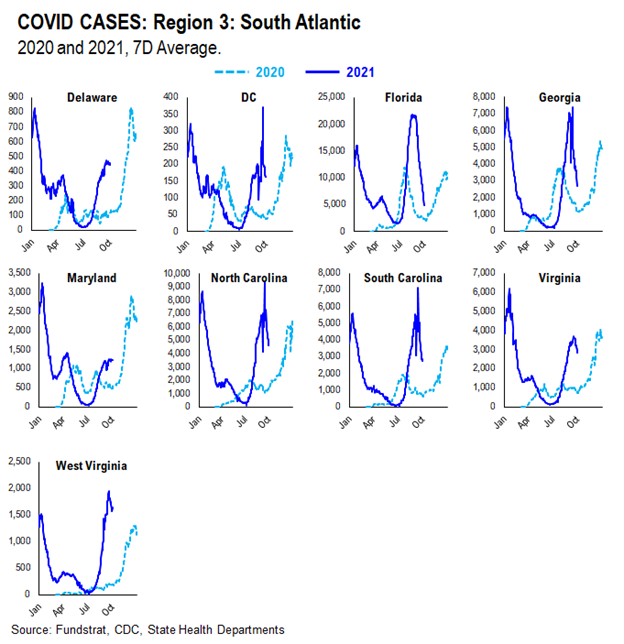
In fact, as shown below, cases are generally falling sharply in states like FL, NC, and SC
– these were states that had a troubling surge in July/August led by the Delta-variant
– it is a key reminder that Delta-variant surge tends to run its course in a community

The pace of vaccinations continues to lag in the US and there remains some intransigence. And it is actually helpful for sport teams, which are widely followed, to potentially have some impact on incenting Americans to be vaccinated. The NBA, for instance, is now not paying players who are unvaccinated, if they miss games in certain cities/states. This only applies to games played in cities/states where such rules exist. At the moment, it is NYC and San Francisco.
As this chart from Kaiser Foundation shows, the vaccination rates by race continue to show a large disparity. Vaccination rates for Black/Hispanic are trailing that of Whites and Asians broadly. There are multiple reasons for this from cultural distrust, to healthcare access, but also, many researchers suggest there remains substantial misinformation as well. In this case, this is where MLB and NBA could improve community awareness. As the CNBC article above suggests.
STRATEGY: September was an awful month for stocks
The S&P 500 fell 4.8%in the month of September. This is the worst month in 2021 (see below) and the worst month since the start of the pandemic.
– Seasonally, September and October might be weak months (see “all instances” row)
– But during strong years (1H>13%), September should have been more resilient
The weakness in September really emerged in the second half. While a number of factors likely contributed, it was a combination of:
– an overbought market
– concerns about macro given Delta-variant COVID-19 surge
– geopolitical turmoil given Afghanistan
– Washington dysfunction around debt ceiling and shutdown
– reversals in interest rates and commodities (both higher)
– Fed signaling less dovish commentary
– continued frustrations with supply chain shortages and inflation debate
Overall, it was a month where investors have been forced to decide whether data was half-full or half-empty.
Epicenter stocks actually rose in September — strong argument against “peak everything”
In September, leadership in equities came from Epicenter stocks, aka Cyclicals. Take a look below:
– Oil & Gas led +18.44%
– Construction & Engineering +10.07%
– Hotels +6.56%
If the US economy was slowing and peak everything is behind us, we do not think Cyclicals would be leading. In fact, under a slowing growth scenario, one would expect Defensives and Growth to lead, but that was not the case. In other words, we would urge investors to not get too bearish on the market, despite the weak performance of markets.
…S&P 500 internal correction matches levels seen on September 24, 2020
Jurien Timmer of Fidelity Investments posted this chart earlier this week. It shows the S&P 500 and the lower half is the % of S&P 500 stocks trading above their respective 50-day moving average:
– Jurien is highlighting that S&P 500 has been in an internal correction for several months now
– and the figure has dipped to a level that shows much of the market is below its 50D
% stocks >50D moving average is now 24.85%, lower than its oversold status on September 24, 2020 (year ago)
As of the close on 9/30/2021, this figure has fallen to 24.85% as shown below. This chart shows the last 18 months.
– current level of 24.85% is below where it was on 9/24/2020
– stocks were undergoing a large correction in September 2020
Back in September 2020, S&P 500 made its low on 9/24 and rallied 11% in 12 trading days
In fact, the S&P 500 made its low on September 24, 2020. As the chart below makes clear:
– S&P 500 rallied 11% over 12 trading days
– there was a “retest” later in October, but this was also during the 2020 Presidential election cycle
I don’t think just because there was a retest in 2020, there has to be a retest in 2021.
BOTTOM LINE: October 1 is the start of a new quarter. While there has been significant internal damage, risk/reward still strong into YE
September was a disappointing month for the S&P 500. Were equities overdue for some consolidation? Yes, sure. But we still see positive risk/reward into YE:
– pent-up demand from consumers
– improving confidence of businesses
– COVID-19 remains stable
– boosters being deployed
– investor sentiment negative (AAII) and is a contrarian signal
– market oversold
– seasonals into YE strong (see below)
But this also does not mean the downside has been exhausted. As our Technical Head, Mark Newton, has noted, there remains many internal breakdowns and thus many groups are in downtrends. Thus, these groups need to reverse higher to confirm a tradable bottom is in place.
If one wanted to be somewhat half full:
– % stocks >50D is similar to 9/24/2020, and stocks bottomed on that day
– the chart below shows 9/30/2021 low was S&P 500 4,306.24
– this is similar to S&P 500 low early last week of 4,305.91
It is a new month, so markets tend to see inflows. And while there are other portfolio balance effects underway, the fourth quarter tends to be seasonally strong. So investors are likely to allocate to equities in the coming months.
__________________________
26 Granny Shot Ideas:
26 Granny Shot Ideas: We performed our quarterly rebalance on 07/30. Full stock list here –> Click here
___________________________
POINT 1: Daily COVID-19 cases 98,008, down -21,129 vs 7D ago…
_____________________________
Current Trends — COVID-19 cases:
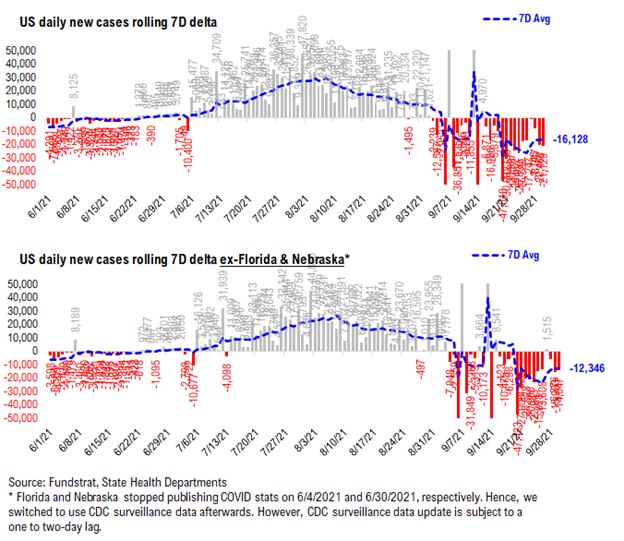
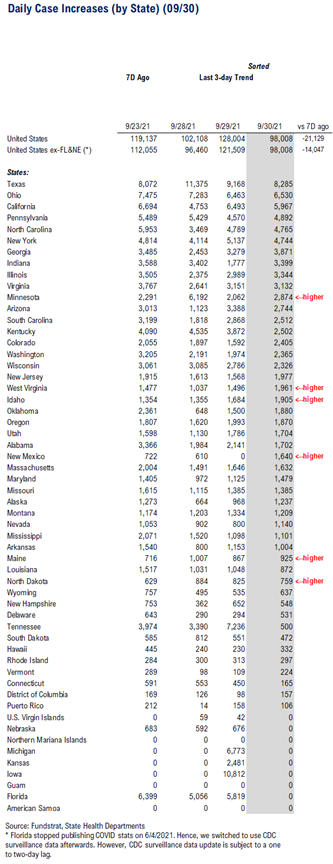
– Daily cases 98,008 vs 119,137 7D ago, down -21,129
– Daily cases ex-FL&NE 98,008 vs 112,055 7D ago, down -14,047
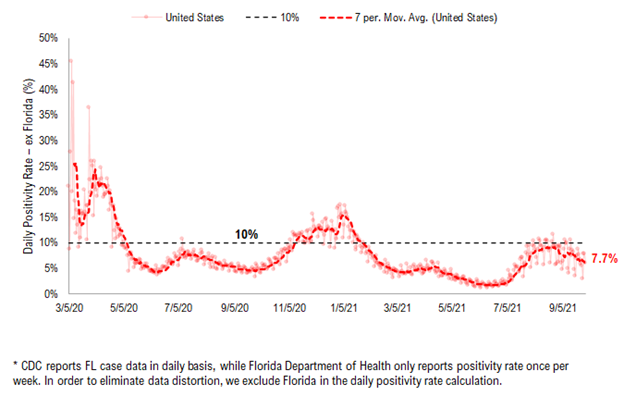
– 7D positivity rate 6.1% vs 6.7% 7D ago
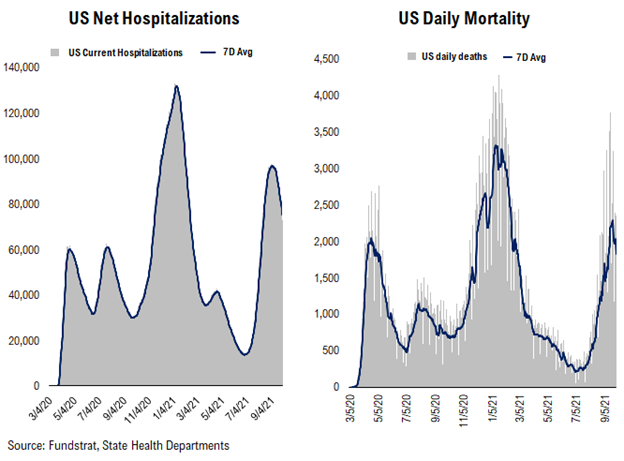
– Hospitalized patients 71,243, down -12.2% vs 7D ago
– Daily deaths 1,824, down -19.0% vs 7D ago
_____________________________
*** Florida and Nebraska stopped publishing daily COVID stats updates on 6/4 and 6/30, respectively. We switched to use CDC surveillance data as the substitute. However, since CDC surveillance data is subject to a one-to-two day lag, we added a “US ex-FL&NE” in our daily cases and 7D delta sections in order to demonstrate a more comparable COVID development.
The latest COVID daily cases came in at 98,008, down -21,129. As indicated by the negative 7D delta, cases are currently rolling over. At the individual state level, we’ve recently been at the critical stage of case rollover as more states begin to turn. We will continue to monitor all relevant data closely, but as long as 7D deltas remain negative, case rollover will continue.
Rolling 7D delta in daily cases is negative…
As shown in the chart below, the rolling 7D delta in daily cases remains negative. The negative rolling 7D delta further emphasizes the case roll over.
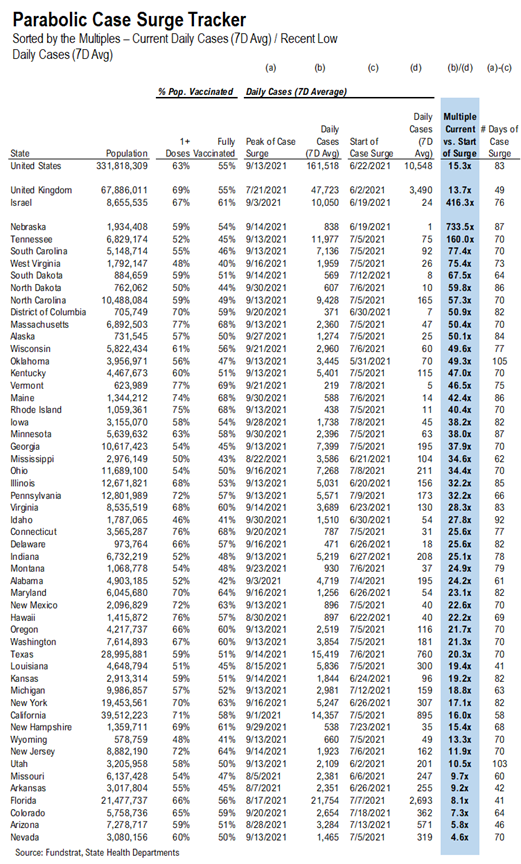
Low vaccinated states seem to have a larger increase in daily cases compared to their recent low…
The “Parabolic Case Surge Tracker” monitors the possible parabolic surge in daily case figures. In the table, we included both the vaccine penetration and the recent case trend for 50 US states + DC. The table is sorted by the multiple of their recent peak daily cases divided by the daily cases when their case surges started.
– The states with higher ranks are the states that have seen a more significant rise in daily cases
– We also calculated the number of days during the recent case surge; a state with a high multiple but low number of days since its low means the state is facing a relatively rapid surge in daily cases
– The US as a whole, UK, and Israel are also shown at the top as a reference
Hospitalizations, deaths, and positivity rates are rolling over amidst case rollover…
Below we show the aggregate number of patients hospitalized due to COVID, daily mortality associated with COVID, and the daily positivity rate for COVID.
– Net hospitalizations peaked below the Wave 3 peak and are currently rolling over
– Daily death peaked slightly above the Wave 2 peak and are currently rolling over
– As per the decline in daily cases, the positivity rate is currently rolling over
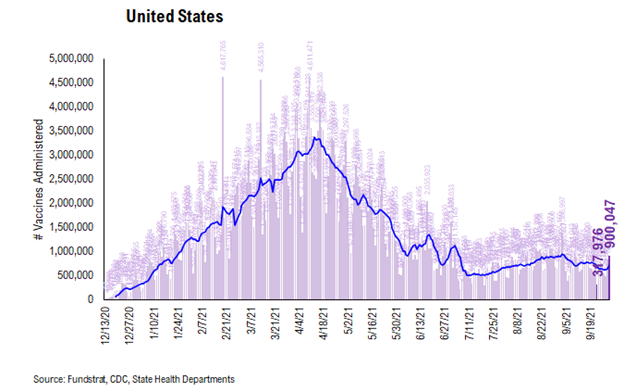
POINT 2: VACCINE: vaccination pace has slowed, but could rise on booster eligibility
_____________________________
Current Trends — Vaccinations:
– avg 0.7 million this past week vs 0.7 million last week
– overall, 55.2% fully vaccinated, 64.0% 1-dose+ received
_____________________________
Vaccination frontier update –> all states now near or above 80% combined penetration (vaccines + infections)
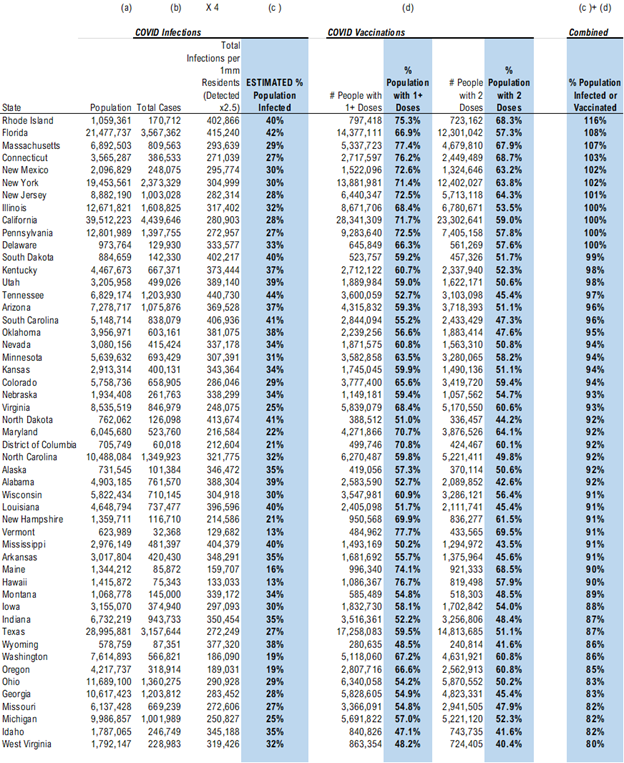
*** We’ve updated the total detected infections multiplier from 4.0x to 2.5x. The CDC changed the estimate multiplier because testing has become much better and more prevalent.
Below we sorted the states by the combined penetration (vaccinations + infections). The assumption is that a state with higher combined penetration is likely to be closer to herd immunity, and therefore, less likely to see a parabolic surge in daily cases and deaths. Please note that this “combined penetration” metric can be over 100%, as infected people could also be vaccinated (actually recommended by CDC).
– Currently, all states are near or above 80% combined penetration
– Given the new multiplier. only RI, FL, MA, CT, NM, NY, NJ, IL, CA, PA, and DE are now above 100% combined penetration (vaccines + infections). Again, this metric can be over 100%, as infected people could also be vaccinated. But 100% combined penetration does not mean that the entire population within each state is either infected or vaccinated
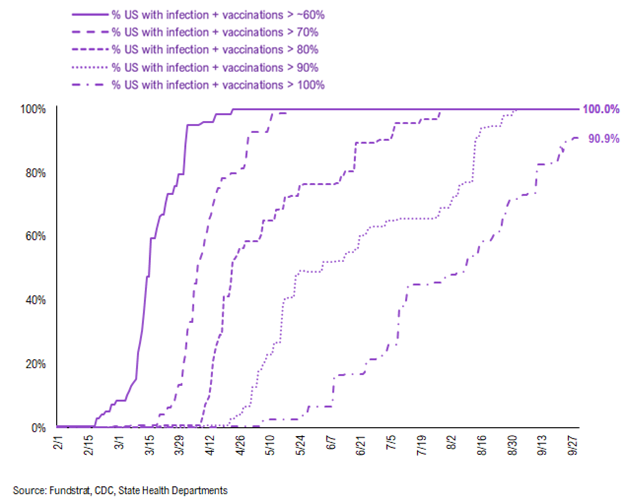
Below is a diffusion chart that shows the % of US states (based on state population) that have reached the combined penetration >60%/70%/80%/90%/100%. As you can see, all states have reached 90% combined vaccination + infection. 90.0% of US states (based on state population) have seen combined infection & vaccination >100% (Reminder: this metric can be over 100%, as infected people could also be vaccinated. But 100% combined penetration does not mean that the entire population within the state is either infected or vaccinated).
There were a total of 900,047 doses administered reported on Thursday, up 183% vs. 7D ago. As a larger percentage of the population is now vaccinated, the vaccination trend had started to decrease. With booster shots becoming more widely available, we believe that the vaccination pace could once again pick up. This is made evident by Thursday’s data. Also, the same catalysts remain in place:
– Proof of vaccination required by many US cities and venues
– Booster shots
– Full FDA approval of Pfizer COVID vaccines (hopefully it could help overcome vaccine hesitancy)
– Biden’s vaccination plan
The daily number of vaccines administered remains the most important metric to track this progress and we will be closely watching the relevant data.
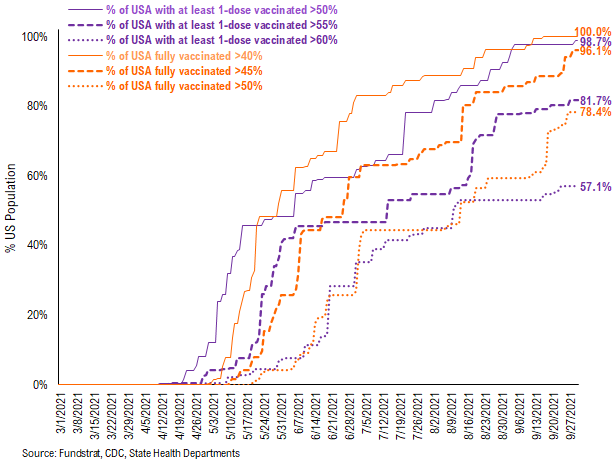
57.1% of the US has seen 1-dose penetration >60%…
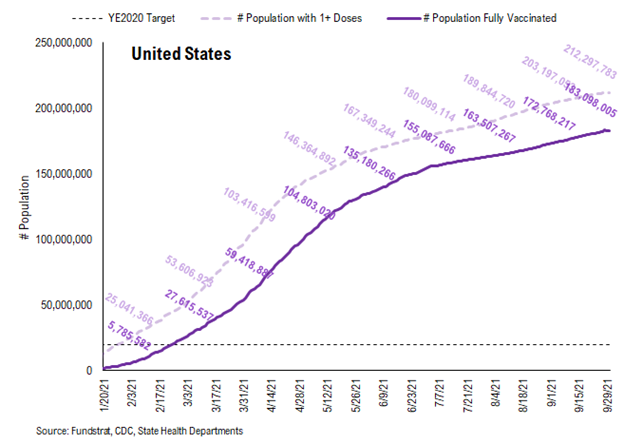
To better illustrate the actual footprint of the US vaccination effort, we have a time series showing the percent of the US with at least 45%/45%/50% of its residents fully vaccinated, displayed as the orange lines on the chart. Currently, 100% of US states have seen 40% of their residents fully vaccinated. However, when looking at the percentage of the US with at least 45% of its residents fully vaccinated, this figure is 96.1%. And only 78.4% of US (by state population) have seen 50% of its residents fully vaccinated.
We have done similarly for residents with at least 1-dose of the vaccination, denoted by the purple lines on the chart. While 98.7% of US states have seen 1 dose penetration >50%, 81.7% of them have seen 1 dose penetration >55% and 57.1% of them have seen 1 dose penetration > 60%.
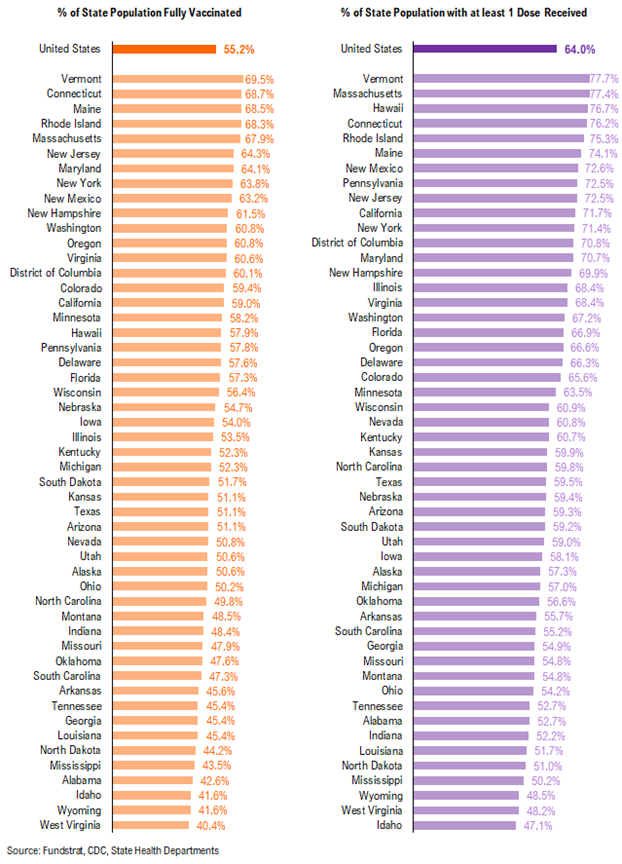
This is the state by state data below, showing information for individuals with one dose and two doses.
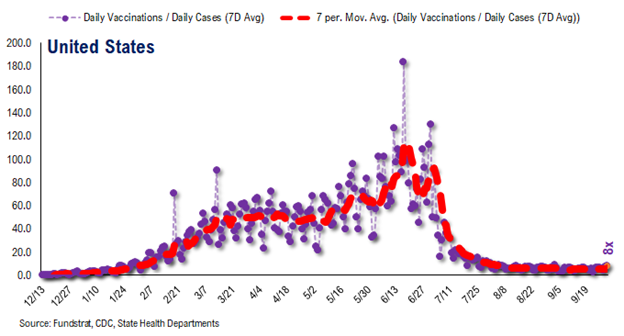
The ratio of vaccinations/ daily confirmed cases has been falling significantly (red line is 7D moving avg). Both the surge in daily cases and decrease in daily vaccines administered contributed to this.
– the 7D moving average is about ~8 for the past few days
– this means 5 vaccines dosed for every 1 confirmed case
In total, 395 million vaccine doses have been administered across the country. Specifically, 212 million Americans (65% of US population) have received at least 1 dose of the vaccine. And 183 million Americans (56% of US population) are fully vaccinated.
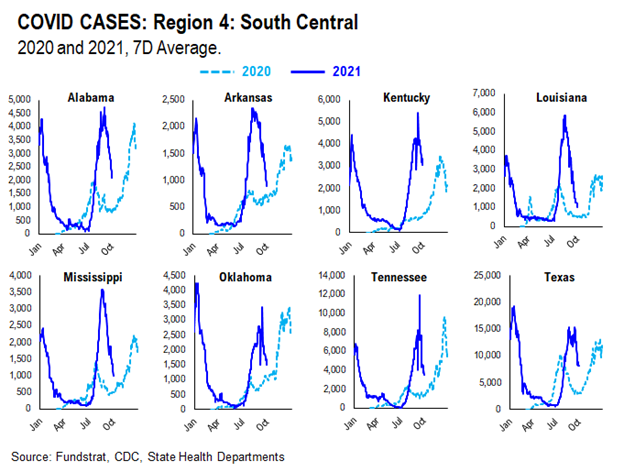
POINT 3: Tracking the seasonality of COVID-19
In July, we noted that many states experienced similar case surges in 2021 to the ones they experienced in 2020. As such, along with the introduction of the more transmissible Delta variant, seasonality also appears to play an important role in the recent surge in daily cases, hospitalization, and deaths. Therefore, we think there might be a strong argument that COVID-19 is poised to become a seasonal virus.
The possible explanations for the seasonality we observed are:
– Outdoor Temperature: increasing indoor activities in the South vs increasing outdoor activities in the northeast during the Summer
– “Air Conditioning” Season: similar to “outdoor temperature”, more “AC” usage might facilitate the spread of the virus indoors
If this holds true, seasonal analysis suggests that the Delta spike could roll over by following a similar pattern to 2020.
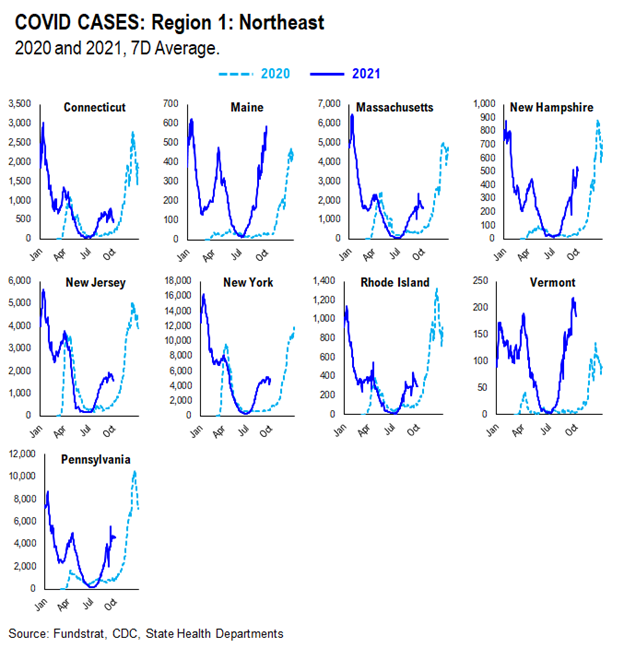
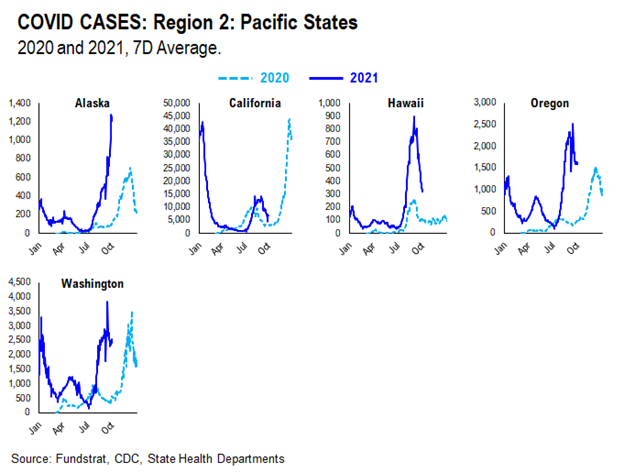
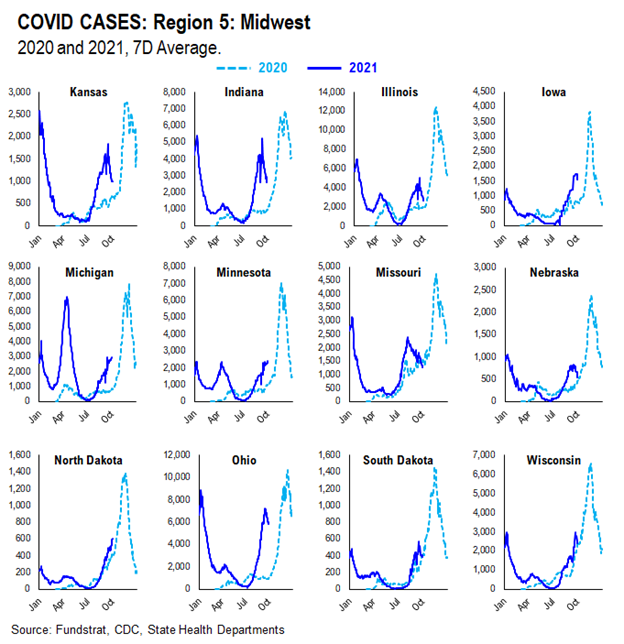
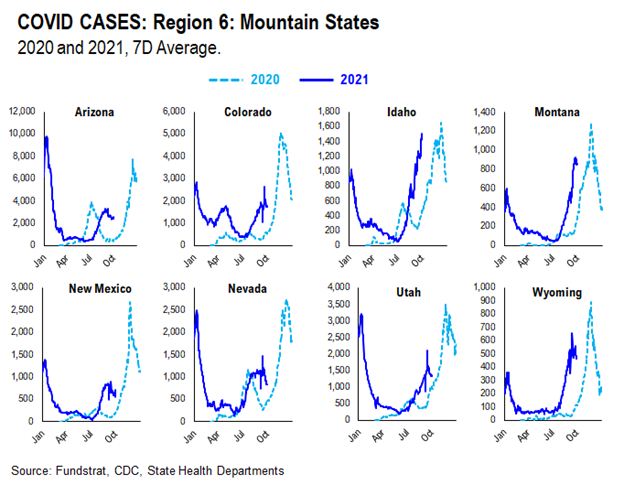
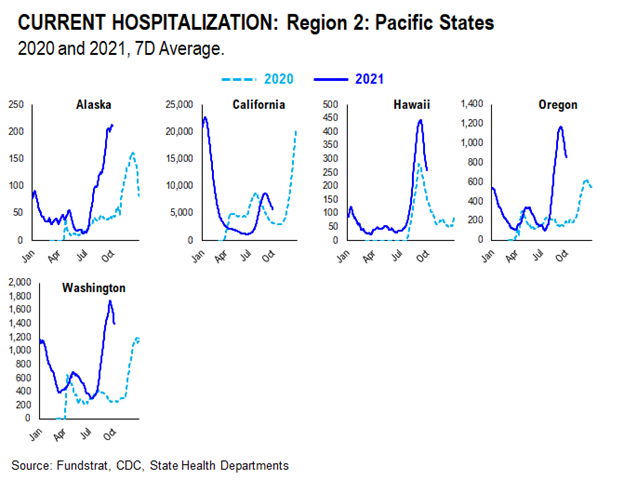
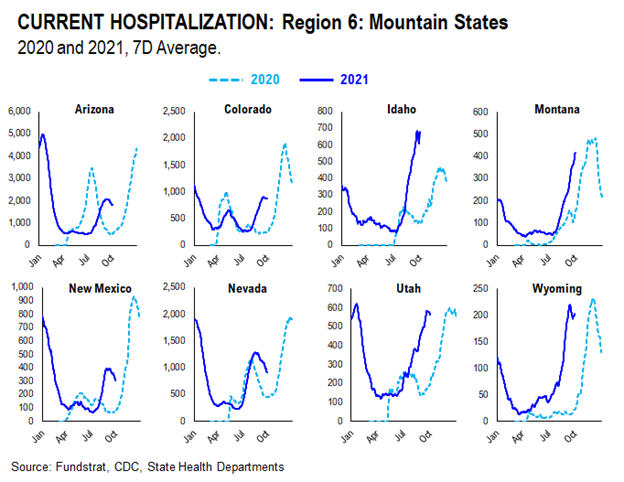
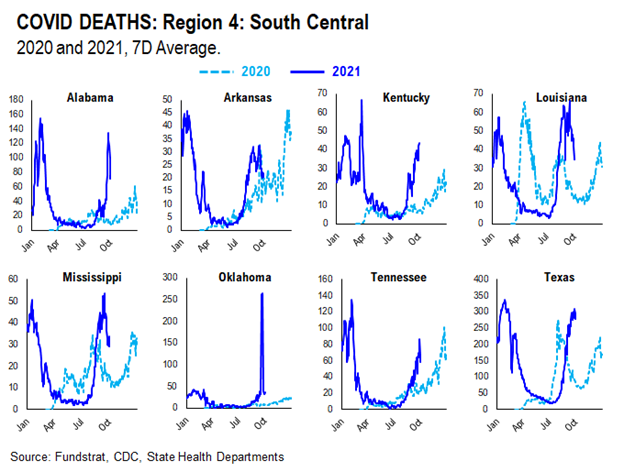
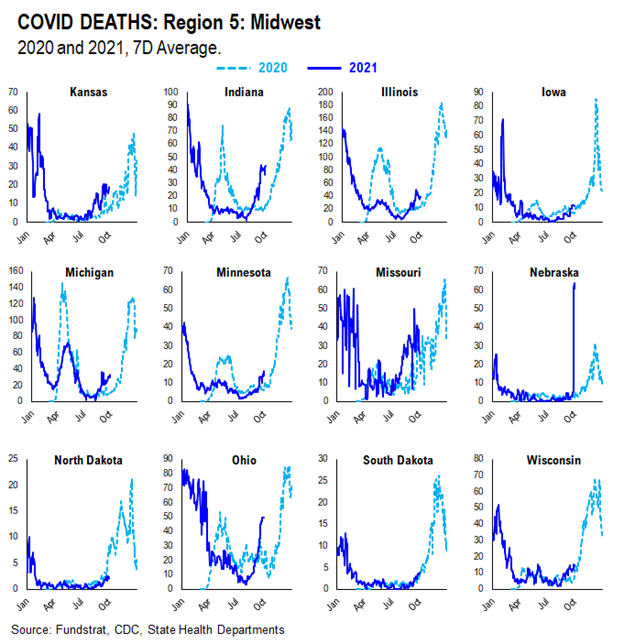
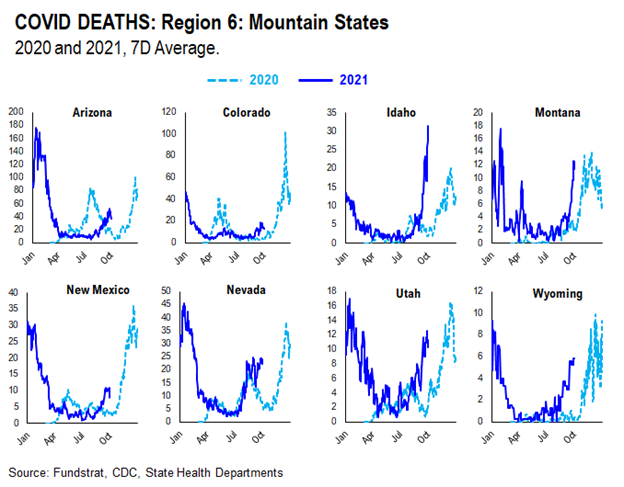
We created this section within our COVID update which tracks and compare the case, hospitalization, and death trends in both 2020 and 2021 at the state level. We grouped states geographically as they tend to trend similarly.
CASES
It seems as if the main factor contributing to current case trends right now is outdoor temperature. During the Summer, outdoor activities are generally increased in the northern states as the weather becomes nicer. In southern states, on the other hand, it becomes too hot and indoor activities are increased. As such, northern state cases didn’t spike much during Summer 2020 while southern state cases did. Currently, northern state cases are showing a slight spike, especially when compared to Summer 2020. This could be attributed to the introduction of the more transmissible Delta variant and the lifting of restrictions combined with pent up demand for indoor activities.
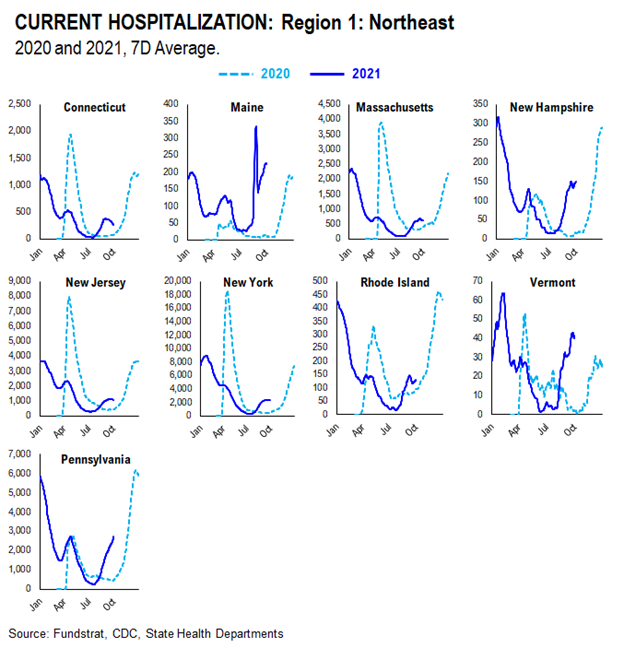
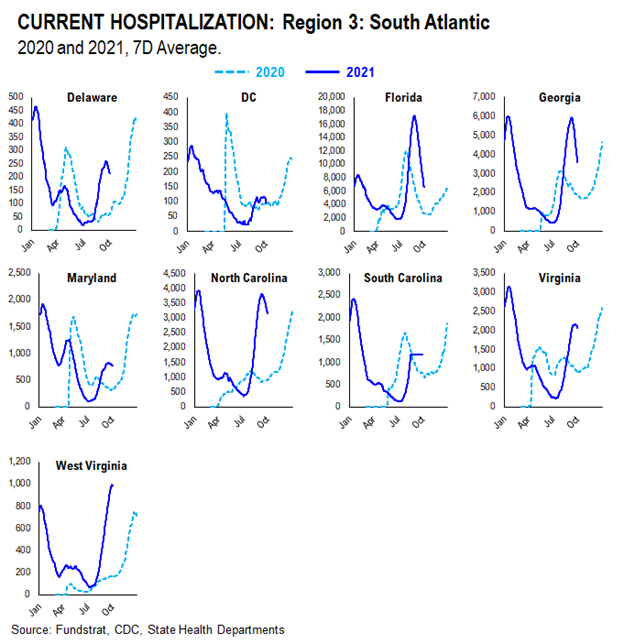
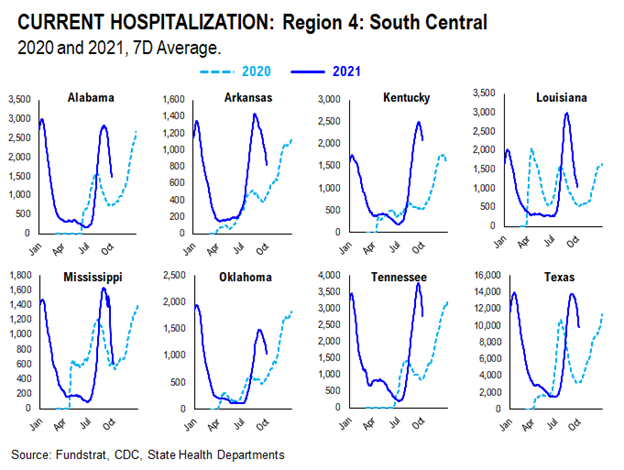
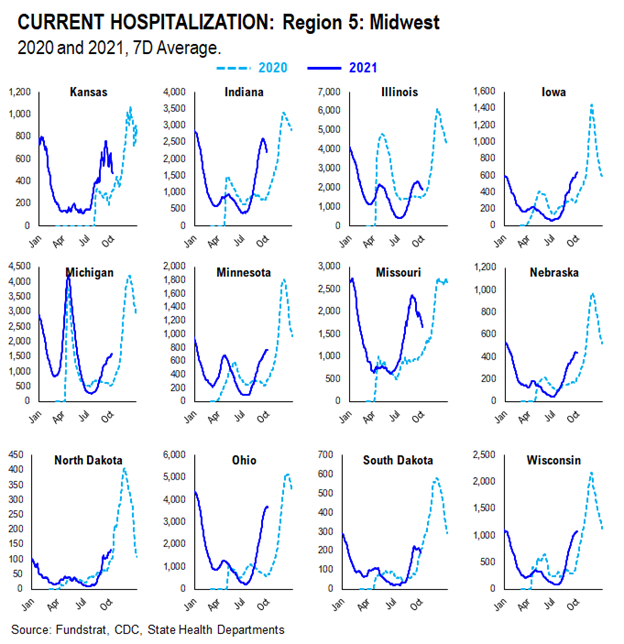
HOSPITALIZATION
Current hospitalizations appear to be similar or less than Summer 2020 rates in most states. This is likely due to increased vaccination rates and the vaccine’s ability to reduce the severity of the virus.
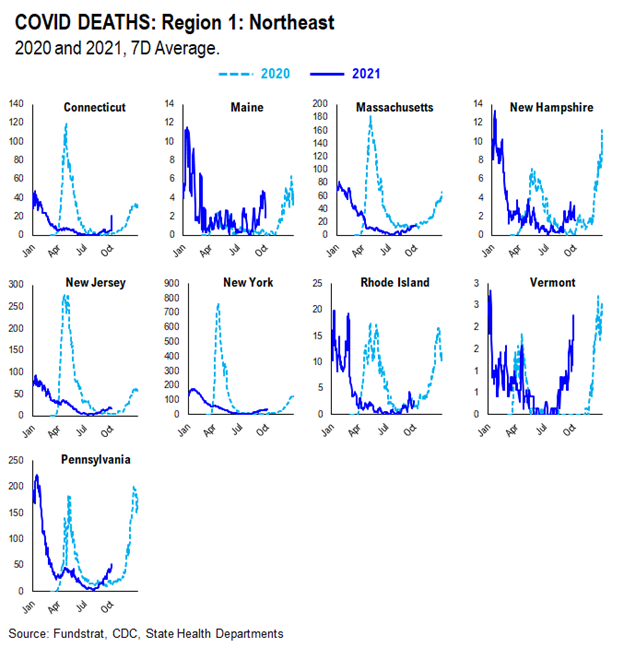
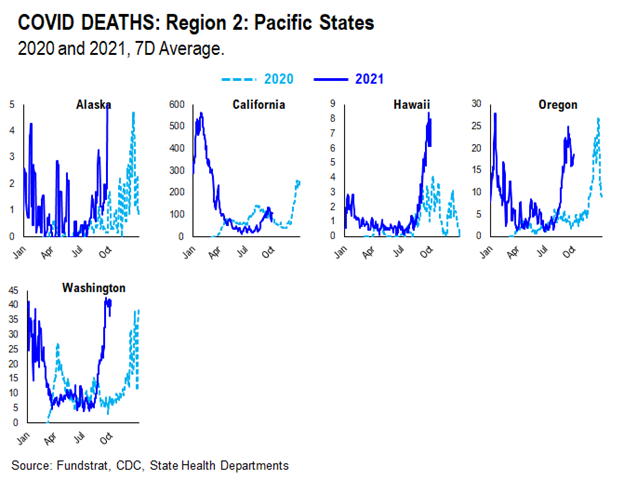
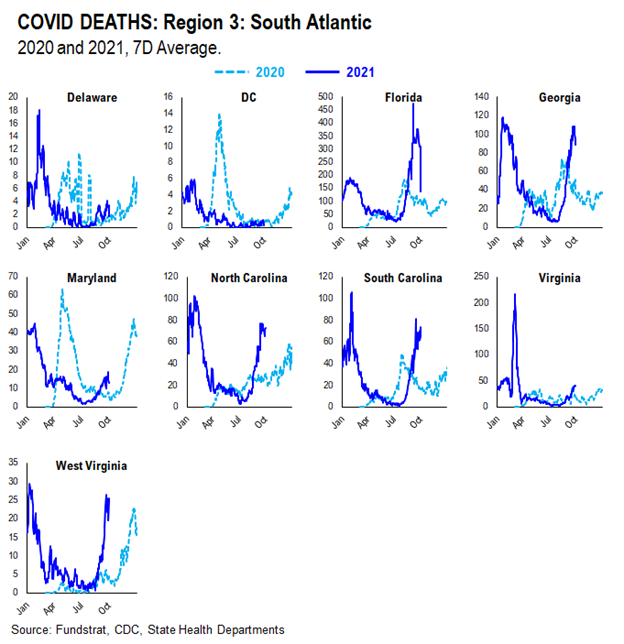
DEATHS
Current death rates appear to be scattered compared to 2020 rates. This is likely due to varying vaccination rates in each state. States with higher vaccination rates seem to have lower death rates given the vaccine’s ability to reduce the severity of the virus; states with lower vaccination rates seem to have higher death rates.
More from the author
Articles Read 1/2
🎁 Unlock 1 extra article by joining our Community!
Stay up to date with the latest articles. You’ll even get special recommendations weekly.
Already have an account? Sign In 0b8333-de42ed-e68ecd-4ec8ed-3d398f
Already have an account? Sign In 0b8333-de42ed-e68ecd-4ec8ed-3d398f

