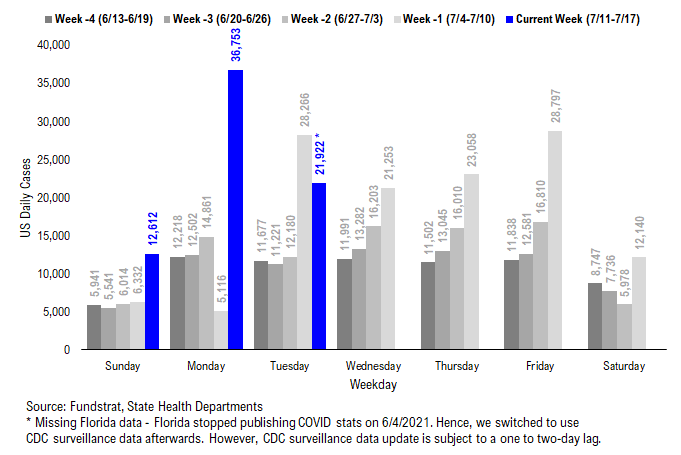
Daily cases at 21,922 (-4,069 vs. 7D ago, but 7D delta is distorted due to holiday), daily vaccinations at 338,666 (+120,490 vs. 7D ago)

Click HERE to access the FSInsight COVID-19 Daily Chartbook.
We are shifting to a 4-day a week publication schedule:
- Monday
- Tuesday
- Wednesday
- SKIP THURSDAY
- Friday
HEADS UP: I am taking a vacation this week, so there will not be “scheduled” market commentary July 12th to July 16th. COVID-19 daily updates will be sent, without market color. But if there is significant market turmoil, we will do INTRADAY commentary.
Eye-catching COVID headlines
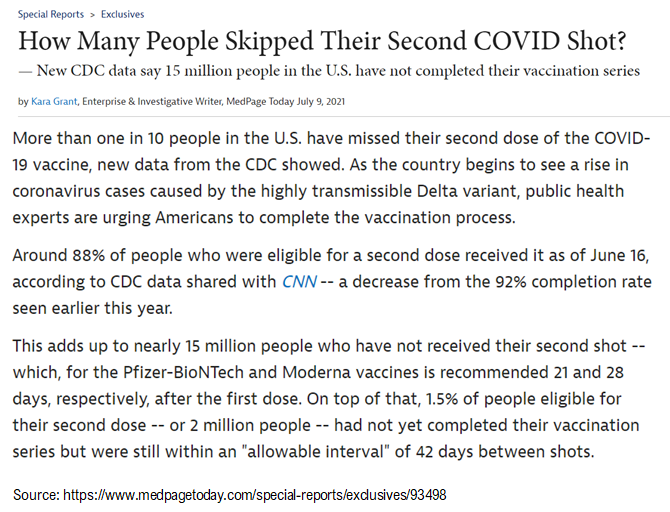
12% of US who received their first dose missed second dose of vaccine; efficacy more than doubles after receiving both doses…
The below article caught my eye Tuesday. According to the article, roughly 12% (up from 8% seen earlier this year) of the US population who were eligible for a second dose (in other words, they received their first dose) had missed their second dose of the vaccine, either Moderna or Pfizer. This 12% adds up to nearly 15 million people who have not received their second shot. WOW! This study shows that vaccine hesitancy is intensified which could also partially explain the stalled vaccination rate recently. As a reference, the article also cited a study that found that the efficacy of the Pfizer vaccine against the Delta variant could jump from 33% with the first dose to 88% with the second does. This demonstrates the importance of being fully vaccinated – efficacy more than doubles after receiving both doses.
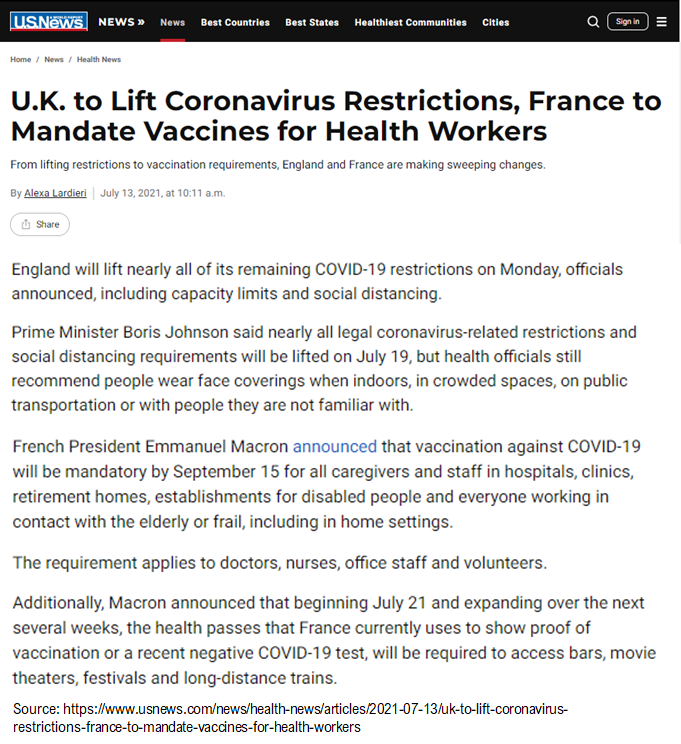
The COVID developments in UK and France are worth watching…
After PM Boris Johnson revealed his five-point plan for the country to “live with COVID” last week, he confirmed on Monday that England will lift COVID restrictions on July 19 as planned amid the surging cases. In contrast, France is mandating all health workers be vaccinated by September 15; after July 15th, proof of a negative COVID test or a vaccinated passport is needed to access bars, theaters, festivals, and long distance trains.
UK COVID cases have been surging since mid May, up from a recent low of 1,855 on 5/19 to 32,385. France COVID cases have been rising as well, but only up from the recent low of 1,840 on 6/27 to 3,853. Hence, the reaction from both governments is interesting and the following developments are worth watching. Besides, the UK’s COVID development is especially important to the US as both countries have a relatively higher vaccination rate and the Delta variant is now the dominant strain in both countries. The case/hospitalization/death trend in the UK could give us more insights on the severity of the Delta variant.
POINT 1: Daily COVID-19 cases 21,922, down -4,069 (ex-FL&NE) vs 7D ago… 7D delta is distorted but cases are indeed rising
_____________________________
Current Trends — COVID-19 cases:
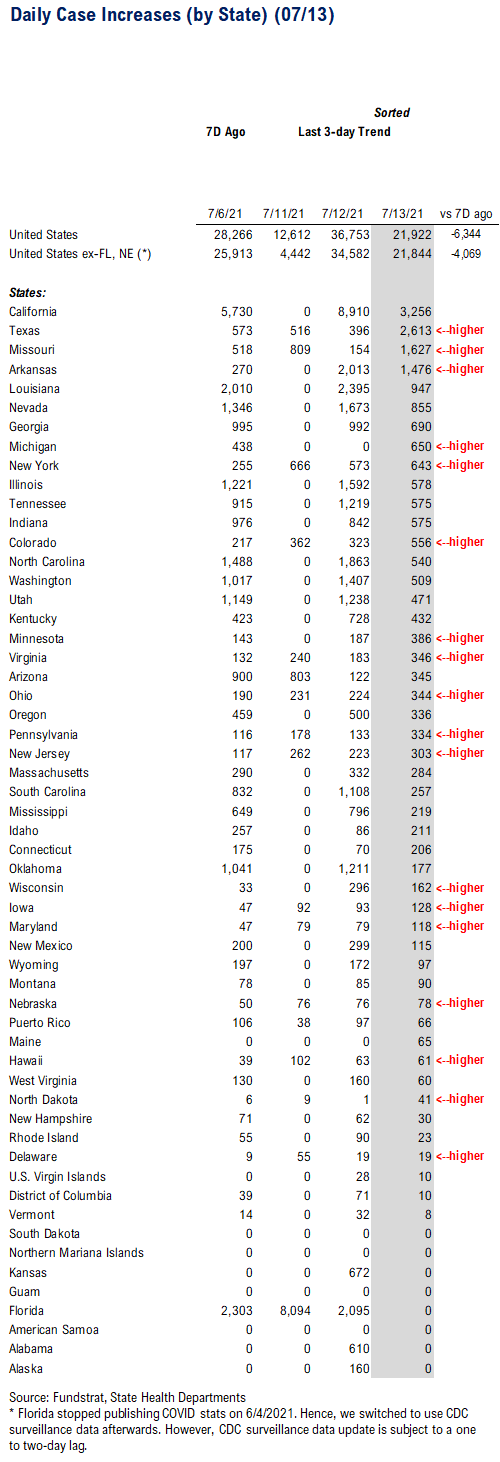
– Daily cases 21,922 vs 28,266 7D ago, down -6,344
– Daily cases ex-FL&NE 21,844 vs 25,913 7D ago, down -4,069
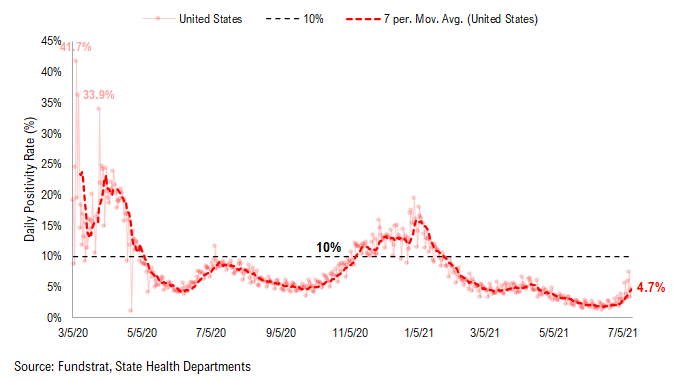
– 7D positivity rate 4.7% vs 2.8% 7D ago
– Hospitalized patients 18,202, up +21% vs 7D ago
– Daily deaths 286, up +36% vs 7D ago
_____________________________
*** Florida and Nebraska stopped publishing daily COVID stats updates on 6/4 and 6/30, respectively. We switched to use CDC surveillance data as the substitute. However, since CDC surveillance data is subject to a one-to-two day lag, we added a “US ex-FL&NE” in our daily cases and 7D delta sections in order to demonstrate a more comparable COVID development.
The latest COVID daily cases came in at 21,922, down -4,069 (ex-FL&NE). The 7D delta in daily cases became negative on Tuesday after yesterday’s spike – but this is also a result of the over-reporting last Tuesday following Independence Day. Overall, case trend, hospitalization, and positivity rate are all rising rapidly. Moreover, daily deaths also seem to edge up Tuesday. But as we noted yesterday, with nearly 80% of elder population (age 65+) and nearly 50% of the total population fully vaccinated, the death toll might not follow the same pattern as the case trend if the vaccines are efficient to a certain degree against the variant.
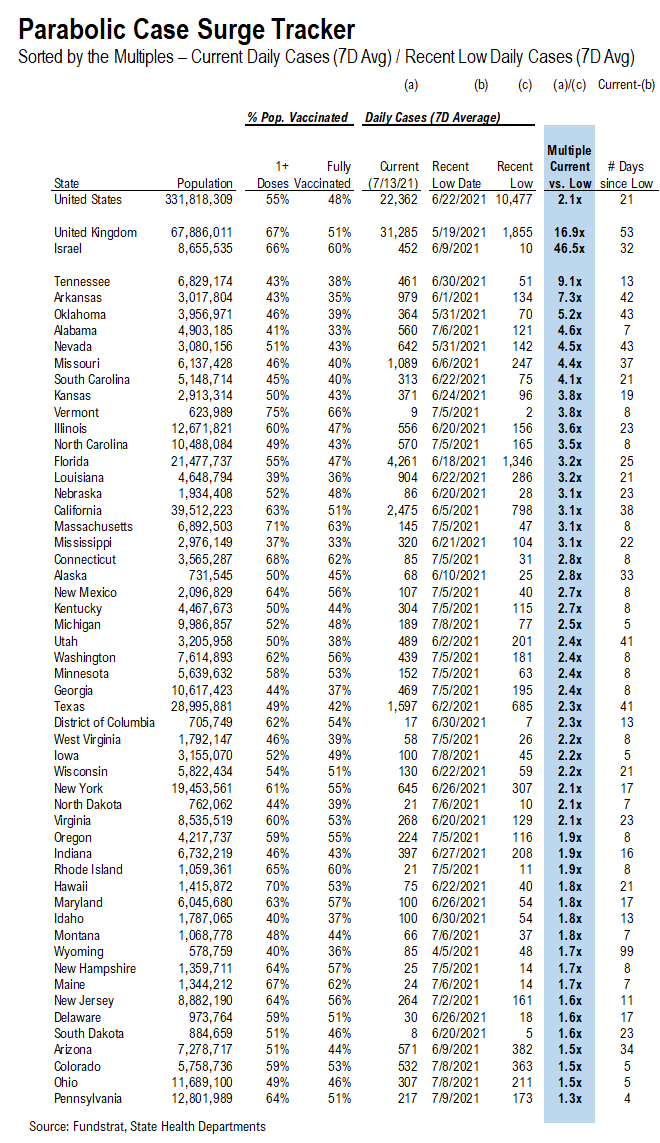
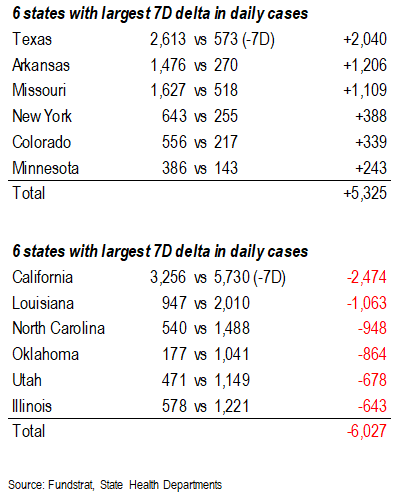
Currently, TN, OK, AR, SC, NV, AL, and NC are the states with the largest increase in daily cases compared to their recent lows (as shown in the “parabolic” tracker below), while all 7 states except NV have less than 50% of their populations vaccinated with at least one dose. As we noted previously, vaccine penetration appears to have some causal relationship with the case trend. Therefore, the COVID developments in these states along with the other low vaccinated states (such as MS, LA, GA, ID, WY, ND, IN) are worth watching.
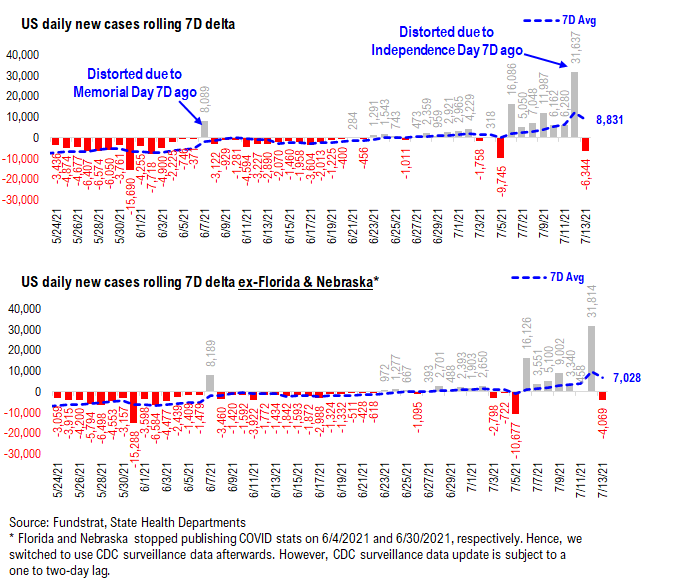
7D delta in daily cases fell to negative…
The 7D delta in daily cases fell significantly on Tuesday, but this is primarily due to the under-reporting 7D ago on Independence Day. That said, daily cases are indeed rising at a faster rate. The 7D avg (blue dash line) provides us with a better view of the trend, and as you can see, the 7D delta has been gradually rising over the past two weeks. But the good news is the rise is more “linear” and less” parabolic.” However, it is still too early to conclude whether or not the US will see a parabolic surge in daily cases. We will be closely watching the relevant data.
New case surge tracker in order to identify the states that have seen the largest case surge recently.
Below, we added a new section called “Parabolic Case Surge Tracker” to monitor the possible parabolic surge in daily case figures. In the table, we included both the vaccine penetration and the recent case trend for 50 US states + DC. The table is sorted by the multiple of their current daily cases divided by their recent low in daily cases.
– The states with higher ranks are the states that have seen a more significant rise in daily cases
– We also calculated the number of days between now and the recent low date; a state with a high multiple but low number of days since its low means the state is facing a relatively rapid surge in daily cases
– The US as a whole, UK, and Israel are also shown at the top as a reference
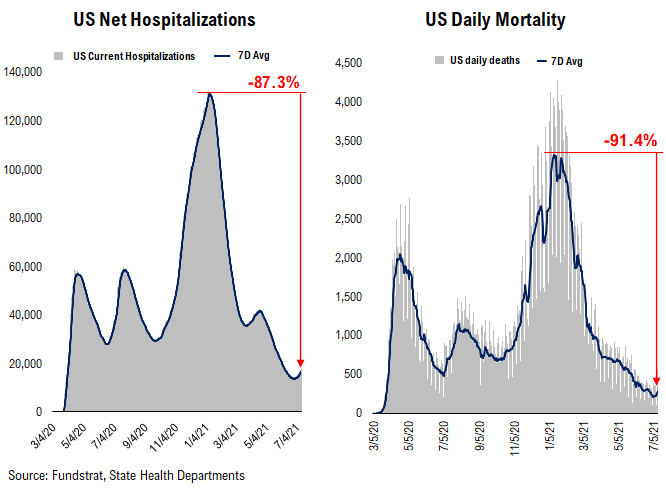
Current hospitalization and positivity rate are rising while daily deaths continue to fall…
Below we show the aggregate number of patients hospitalized due to COVID, daily mortality associated with COVID, and the daily positivity rate for COVID. As you can see, all three metrics are at their all-time lows since the start of the pandemic. However, current hospitalization and positivity rate are clearly turning upwards, while daily deaths remain on a downtrend. If the COVID related hospitalizations continue to rise, we could see the daily deaths start to turn upwards soon.
POINT 2: VACCINE: vaccination data could “true up” this week after the data distortion due to Independence Day
_____________________________
Current Trends — Vaccinations:
– avg 0.5 million this past week vs 0.9 million last week
– overall, 47.8% fully vaccinated, 55.1% 1-dose+ received
_____________________________
Vaccination frontier update –> all states now near or above 80% combined penetration (vaccines + infections)
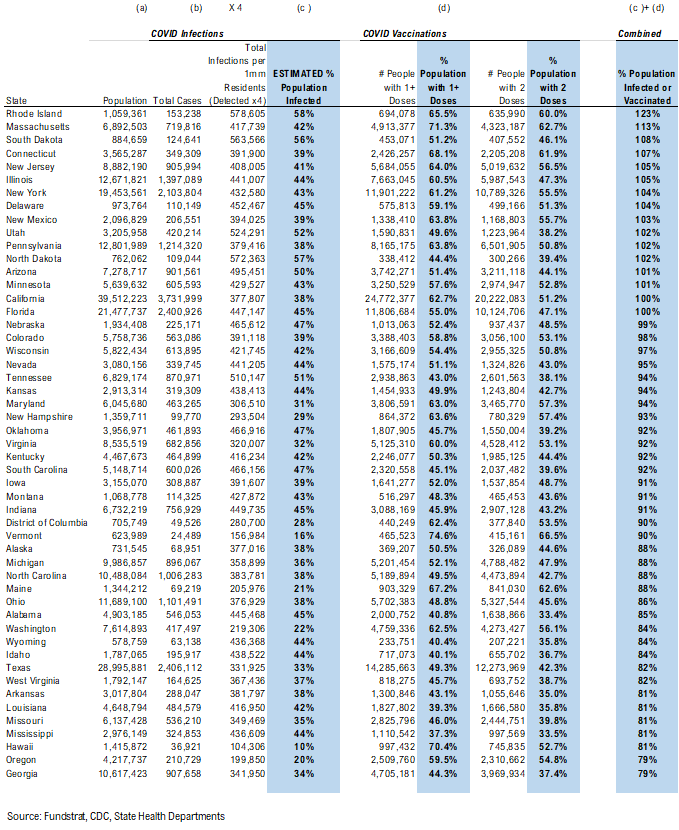
Below we sorted the states by the combined penetration (vaccinations + infections). The assumption is that a state with higher combined penetration is likely to be closer to herd immunity, and therefore, less likely to see a parabolic surge in daily cases and deaths. Please note that this “combined penetration” metric can be over 100%, as infected people could also be vaccinated (actually recommended by CDC).
– Currently, all states are near or above 80% combined penetration
– RI, MA, SD, CT, NJ, IL, NY, DE, NM, UT, PA, ND, AZ, MN, CA, FL are now above 100% combined penetration (vaccines + infections).
Again, this metric can be over 100%, as infected people could also be vaccinated. But 100% combined penetration does not mean that the entire population within each state is either infected or vaccinated.
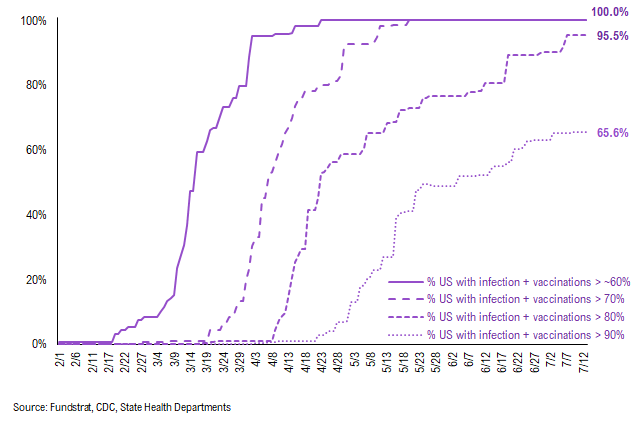
Below is a diffusion chart that shows the % of US states (based on state population) that have reached the combined penetration >60%/70%/80%/90%. As you can see, all states have reached 60% and 70% combined vaccination + infection. 95.5% of US states (based on state population) have seen combined infection & vaccination >80% and 65.6% of US states have seen combined infection & vaccination >90%.
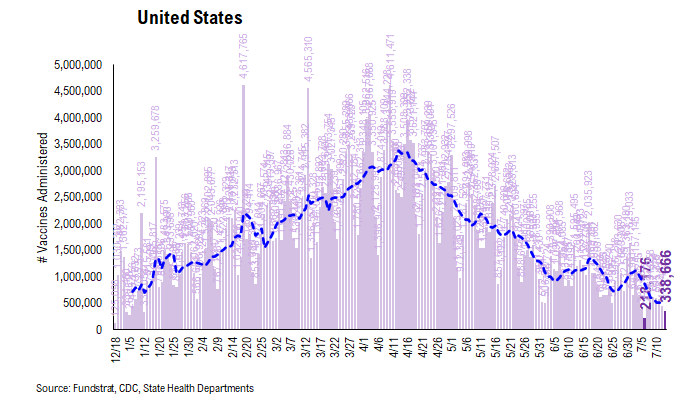
There were a total of 338,666 doses administered reported on Sunday. Over the past 7 days, 529,189 doses were administered per day on average, down 39% from 7D ago. The daily number of vaccines administered is likely to catch up after the under-reporting last week due to Independence Day. However, the overall vaccination trend has been sliding down over the past 3 months.
As the more transmissible Delta variant gradually becomes the dominant strain in the US, vaccinations could not only provide some degree of protection against the virus but are also likely to reduce virus transmission. Therefore, we might see the vaccination trend start to turn upwards. However, we understand that the vaccine hesitancy might not that easy to be eased. More studies on the vaccine’s side-effect and efficiency against the variant as well as government efforts are the key. We will be closely watching the relevant data.
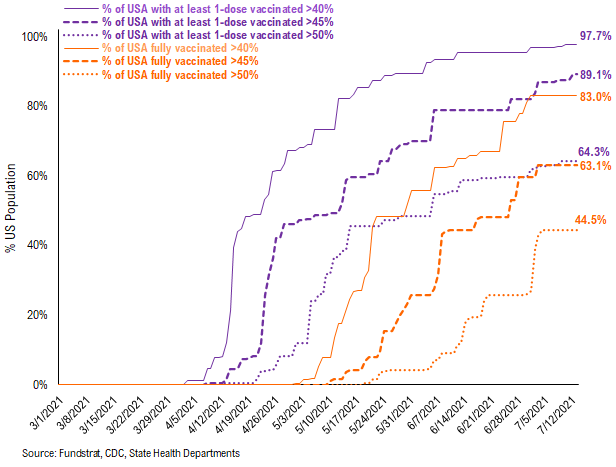
97.7% of the US has seen 1-dose penetration >40%…
To better illustrate the actual footprint of the US vaccination effort, we have a time series showing the percent of the US with at least 45%/45%/50% of its residents fully vaccinated, displayed as the orange line on the chart. Currently, 83.0% of US states have seen 40% of their residents fully vaccinated. However, when looking at the percentage of the US with at least 45% of its residents fully vaccinated, this figure is 63.1%. And only 44.5% of US (by state population) have seen 50% of its residents fully vaccinated.
-While 97.7% of US states have seen vaccine penetration >40%, 89.1% of them have seen 1 dose penetration >45% and 64.3% of them have seen 1 dose penetration > 50%.
-83.0% of the US has at least 40% of its residents fully vaccinated, However, only 63.1% of US has fully vaccinated >45% and 44.5% of US has fully vaccinated >50%.
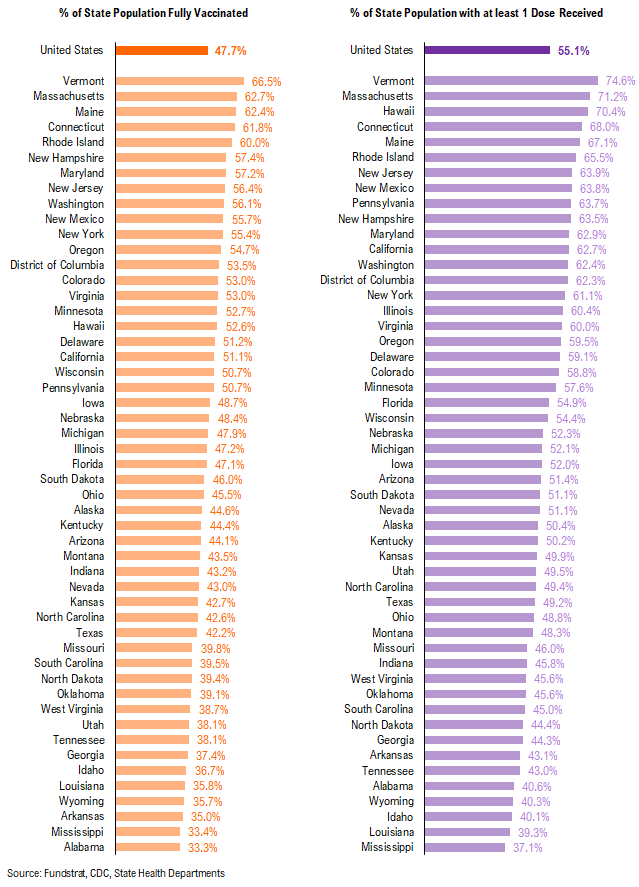
This is the state by state data below, showing information for individuals with one dose and two doses.
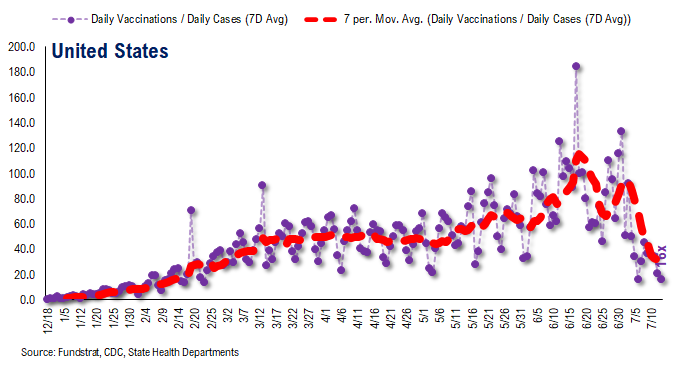
The ratio of vaccinations/ daily confirmed cases has been falling significantly (red line is 7D moving avg). Both the surge in daily cases and decrease in daily vaccines administered contributed to this.
– the 7D moving average is about ~30 for the past few days
– this means 30 vaccines dosed for every 1 confirmed case
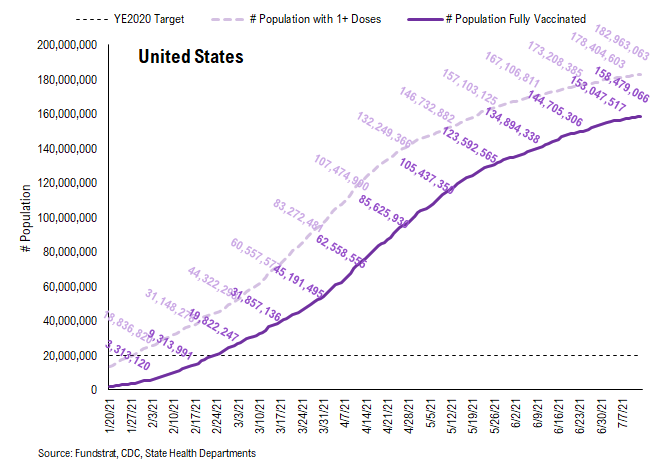
In total, 333 million vaccine doses have been administered across the country. Specifically, 183 million Americans (55% of US population) have received at least 1 dose of the vaccine. And 158 million Americans (48% of US population) are fully vaccinated.
POINT 3: Tracking restrictions lifting and subsequent effects in individual states
Point #3 focuses primarily on tracking the lifting of restrictions, as states have eased the majority of mandates. Keep in mind, easing/lifting restrictions are contingent upon state of emergency ordinances being renewed.
– States in groups 1 and 2 represent states that let their emergency ordinances expire, or that never had one in the first place
– Note: IL and HI are not listed. This is because restrictions lifting is determined at the county / island level, and no statewide policy will be established to lift restrictions until a full reopening
So there is a spectrum of approaches. Our team is listing 3 tiers of states and these are shown below.
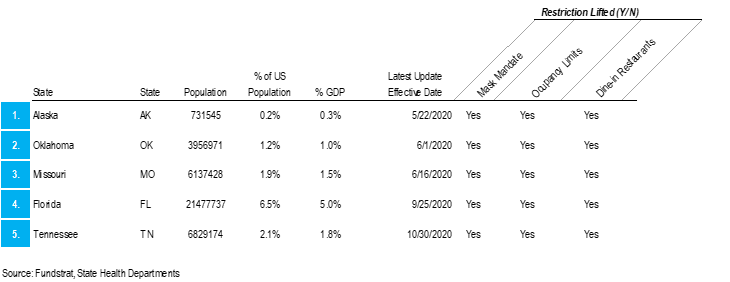
– states that eased all restrictions in 2020: AK, OK, MO, FL, TN
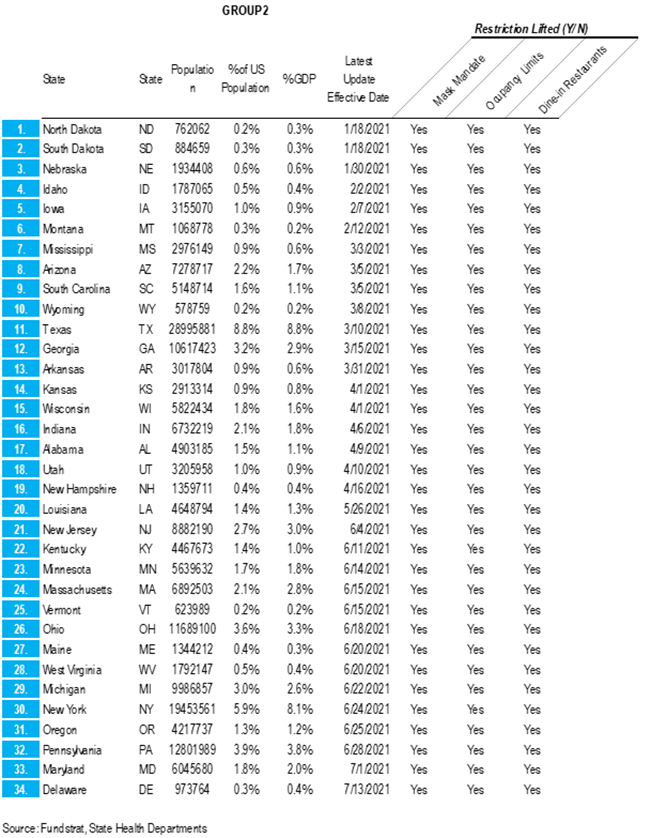
– states that have eased all restrictions in 2021 to now: ND, SD, NE, ID, IA, MT, MS, AZ, SC, WY, TX, GA, AR, KS, WI, IN, AL, UT, NH, LA, NJ, KY, MN, MA, VT, OH, WV, ME, MI, NY, OR, PA, MD, DE
– states that are still easing restrictions in 2021: WA, NC, CA, NM, CO, NV, CT, VA, RI, DC
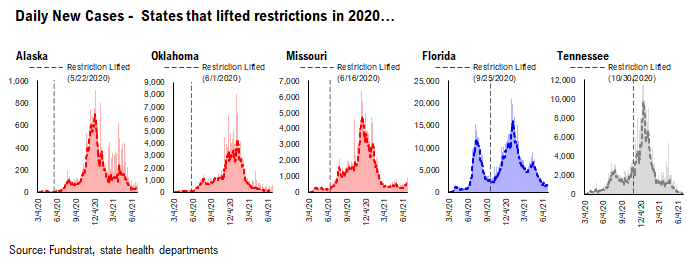
GROUP 1: States that lifted restrictions in 2020…
The daily case trends in these states are impressive and it is difficult to say that lifting restrictions has actually caused a new wave of cases because the case trends in these states look like other states.
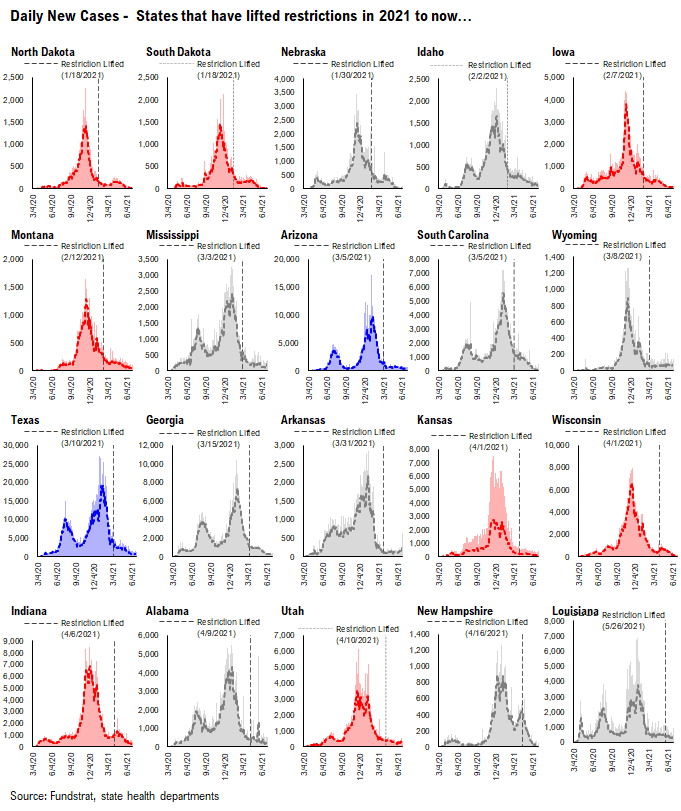
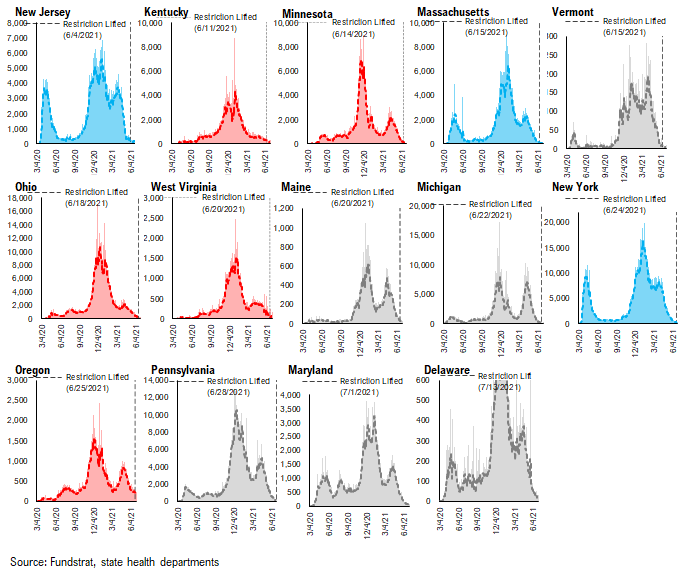
GROUP 2: States that have lifted restrictions in 2021 to now…
Similar to the list of states above, the daily case trends in these states are impressive and it seems that lifting restrictions hasn’t caused an increase in cases.
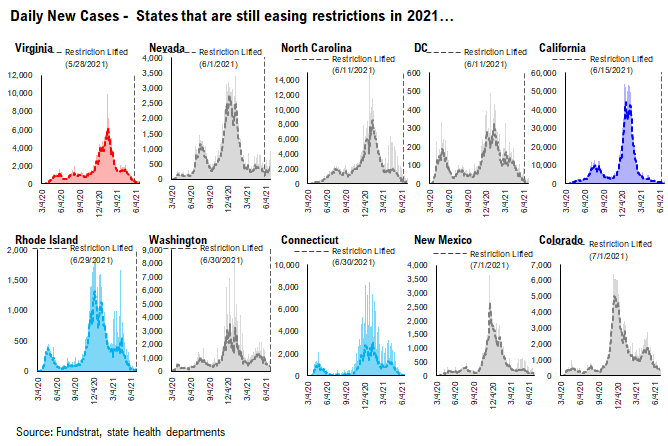
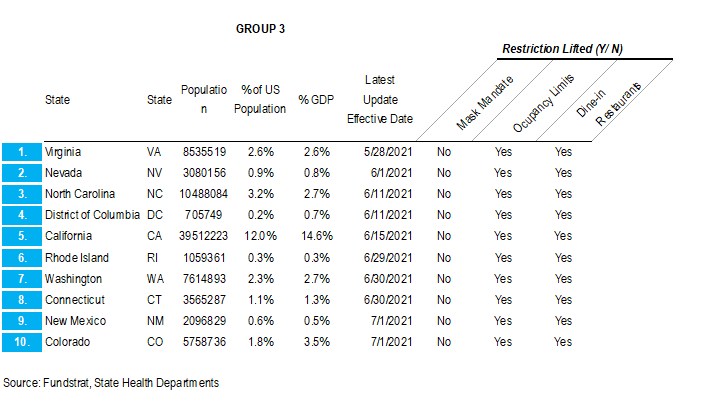
GROUP 3: States that are still easing restrictions in 2021…
These states have begun to lift restrictions, but have yet to ease all restrictions. The date of each state’s most recent restrictions lifting is indicated on each chart. The case trends in these states have been mostly positive.
– Easing restrictions appears to have contributed to an increase in cases in several of these states, most drastically in OR, ME, WA, and MN