

COVID-19 UPDATE: Death rates collapse when state vaccine penetration >33%. Even as equities favor "quality" trade, credit sticks with "cyclical" trade (hint, credit usually wins). Implies IWM $239

Click HERE to access the FSInsight COVID-19 Daily Chartbook.
We are shifting to a 4-day a week publication schedule:
- Monday
- Tuesday
- Wednesday
- SKIP THURSDAY
- Friday
STRATEGY: While equities do “quality” trade, credit stick with “cyclicals” (credit usually wins) and implies IWM should be $239 vs $223 currently…
COVID-19 trends have been fairly stable in the past few weeks (vs the sharper declines in cases seen earlier in the year) but as we wrote about in recent weeks, daily cases is not necessarily the important benchmark. Vaccinations are increasing and averaged 3.0 million this week. And many states are moving forward with re-openings. And as we noted earlier this week, it was a milestone to see CA announces a full re-opening by June 15th. Given that state has been so conservative, essentially the entire US will be open by mid-June.
_____________________________
Current Trends — COVID-19 cases:
– Daily cases 73,907 vs 71,277 7D ago, up +2,630
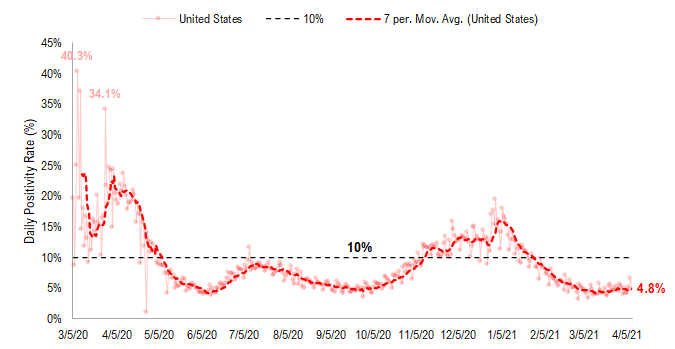
– 7D positivity rate 4.8% vs 5.0% 7D ago
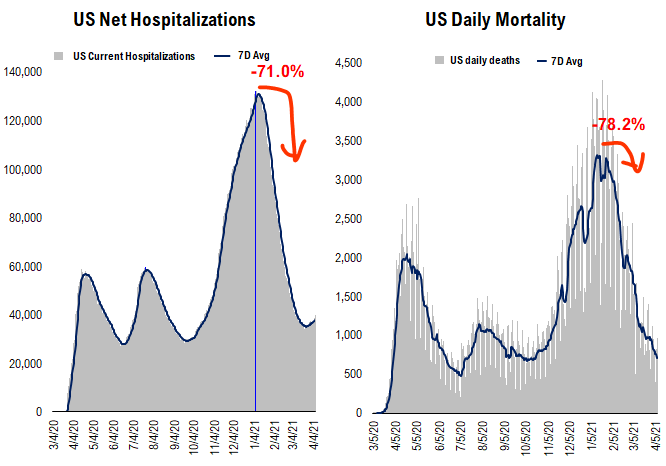
– Hospitalized patients 39,840 up +7.2% vs 7D ago
– Daily deaths 722, down -18% vs 7D ago
Vaccinations ramping steadily
– avg 3.0 million this past week vs 2.9 million last week
– overall, 19.8% fully vaccinated, 33.5% 1-dose+ received
_____________________________
A positive recent development is that patients who have chronic (“long haul”) COVID-19 symptoms seem to benefit from the vaccines. Multiple stories have emerged of formerly recovered, with severe symptoms, suddenly seeing an easing of their symptoms. This includes the disappearance of fatigue, brain fog and even loss of smell. While the mechanism is not entirely clear, scientists think this might be the result of the vaccine assisting the body in ridding itself of any lingering virus.
– this is a support for vaccinating all Americans, including those who already have been infected.
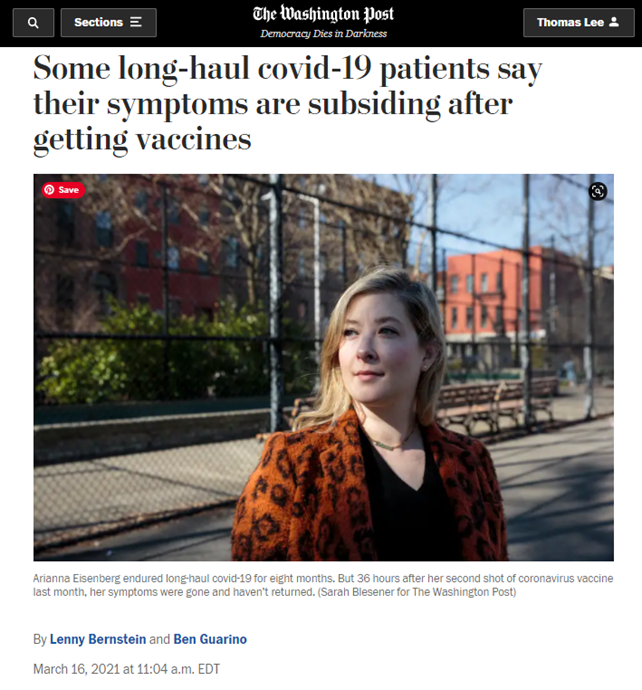
Source: https://www.washingtonpost.com/health/long-haul-covid-vaccine/2021/03/16/6effcb28-859e-11eb-82bc-e58213caa38e_story.html
Death rate (~death to cases) might be a better way to see vaccine effectiveness
One of our long-time clients (thanks RJ+AR) asked us to look at COVID-19 death rate trends. And we realized this was actually an important metric to measure progress, particularly given vaccinations:
– as older cohorts get vaccinated, risk of infection lower (lower death rate)
– vaccine has been shown to limit severity of disease (lower death rate)
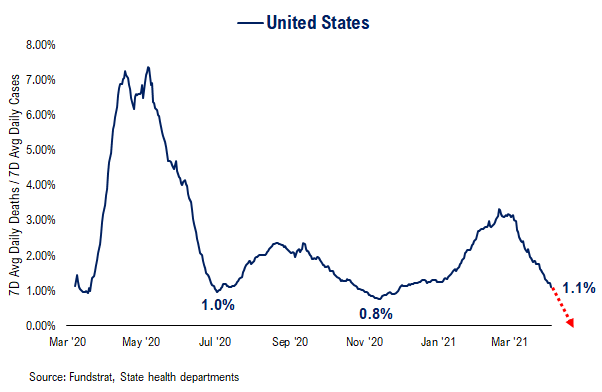
So naturally, death rates should be falling and presumably fall eventually to 0%. The death rate from COVID-19 has been steadily declining and is now touching 1.1%. The 1.1% figure is progress from 3% in mid-Feb but it is also not as low as the 0.8% and 1.0% seen at the nadirs after Wave 1 and Wave 2. And it means that roughly 1 in 100 confirmed COVID-19 cases leads to death. So this figure is low but really not low enough.
– there are reasons to expect this figure to drop below 1.0% as vaccination penetration grows
– state-level data shows there is an exponential drop in death rates as vaccine penetration grows
US death rates collapse when state vaccine penetration exceeds 33%
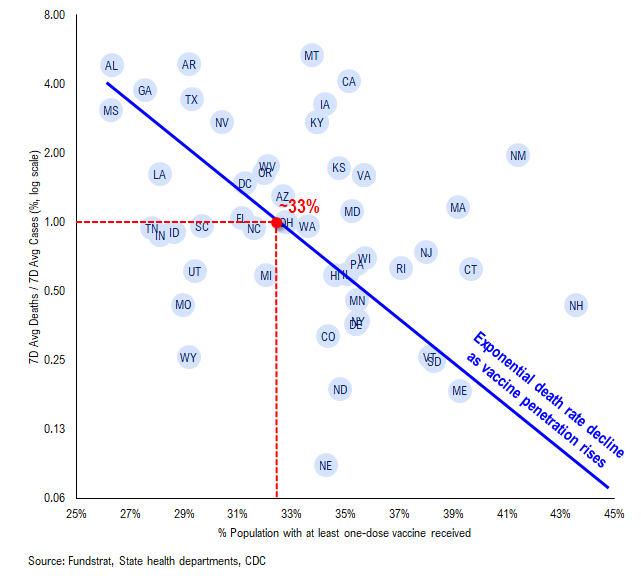
Take a look at the comparative ratio of vaccine penetration (x-axis) and death rates (y-axis). The key to understanding the chart below is to realize the Y-axis is log scale. Thus, if this chart is true, as vaccine penetration rises, the death rate should be exponentially collapsing:
– indeed, this seems to be the case
– death rates collapse when vaccine penetration reaches 33%, roughly
– states with higher vaccine penetration have seen death rates drop to 0.05%, or 1/20th the US levels
So, it does seem to be true that vaccinations are leading to a drop in mortality rates in the real world. This is a good thing.
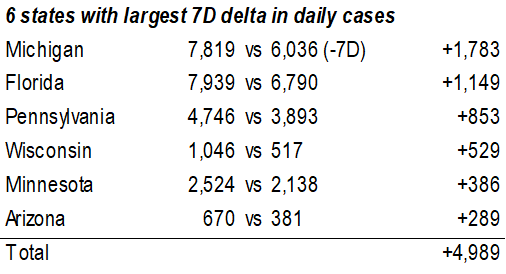
Hospitalizations rising in 6 states, but not really elsewhere…
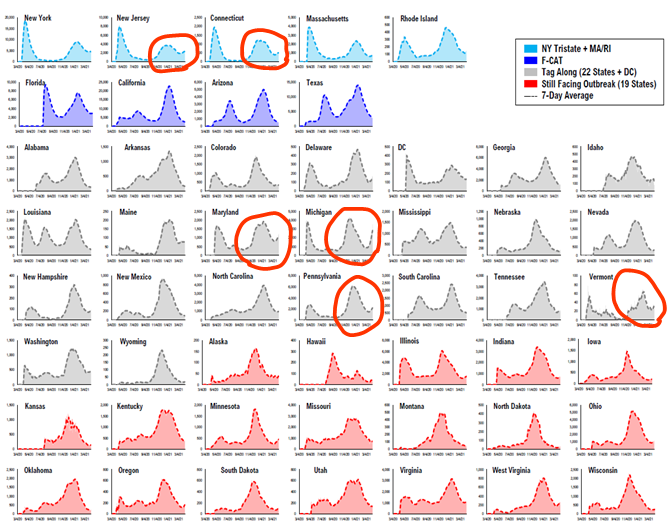
We have shown total hospitalized patients, by state, in this chart matrix below. And we have circled in red where there seems to be a pronounced rise in hospitalizations. There are 6 states where this seems to be the case:
– CT
– NJ
– PA
– MD
– MI
– VT
These are mostly on the East Coast, with the exception of Michigan. And as the chart below highlights, MI situation actually looks the most severe and troublesome. Again, I cannot fully explain why cases and hospitalizations are surging. Clearly it is some combination of variants, holidays, etc.
– but mutations are seen in CA and FL and hospitalizations are not rising in those states.
Source: Fundstrat and state healthcare websites
STRATEGY: Equities are acting defensive, even as VIX and high-yield say risk on…
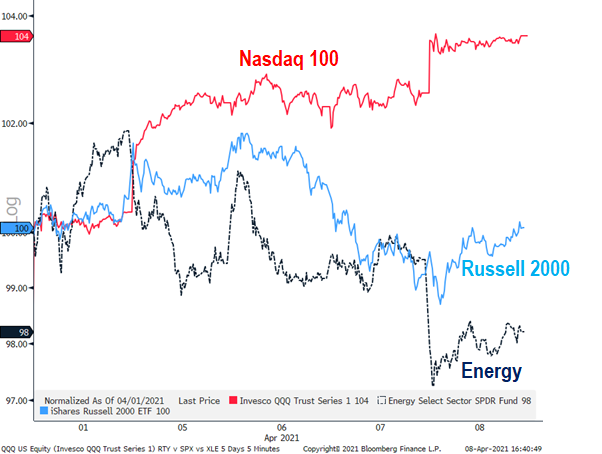
Since the start of 2Q2021 (April 1), equity markets have taken on a somewhat defensive tone. We expected a “face ripper” rally this month:
– so far, the S&P 500 is up 3.1% (qualifies as face ripping)
– but it is strikingly Defensive, evidenced by the leadership of Nasdaq 100 (was 2020’s defensive trade)
– clients have told us they are shifting to a “quality bias” because economic momentum has peaked
– and others worry that a market top is near given the warnings from technicians and also the specter of tax hikes
In any case, while equities are doing very well in April, there is a marked “defensive” aka ‘quality” tone to leadership.
Source: Fundstrat and Bloomberg
DIVERGENCE: Equities shift to “quality” while credit favors “cyclical” = divergence
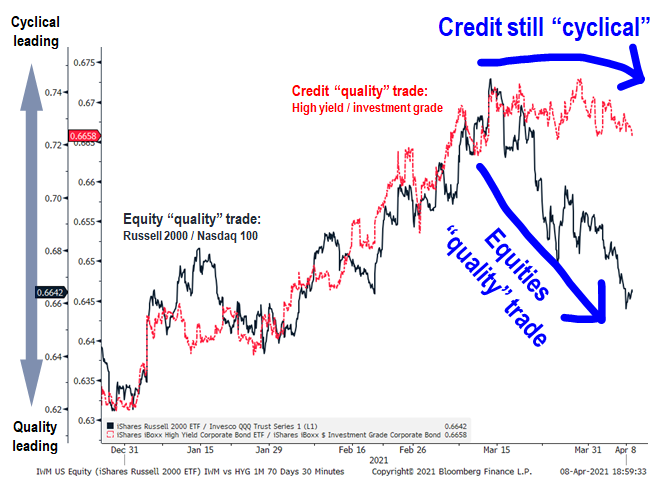
Many of our clients have been saying that they are shifting into “quality” stocks away from cyclicals, because we are peaking in economic momentum. However, a curious thing is happening.
– while stocks are shifting to “quality” (Nasdaq 100 vs Russell 2000)
– credit markets still favor “cyclical” (high-yield beating investment grade)
In other words, this quality shift is seen in stocks is not showing up in credit markets. Credit markets are very much “risk-on” and buying “lower quality.” Logically, quality in credit and equities have moved in lockstep. Below is a comparison of two “quality” indices that should be moving in lockstep:
– Red credit “quality” index: high-yield bonds to investment grade bonds
– Blue equity “quality” index: small-caps to NASDAQ 100
The last two weeks has seen the divergence, while credit has bid “high-yield” (low quality/cyclical), small-caps have dramatically underperformed Nasdaq 100 (equities shifted to quality).
Source: Bloomberg and Fundstrat
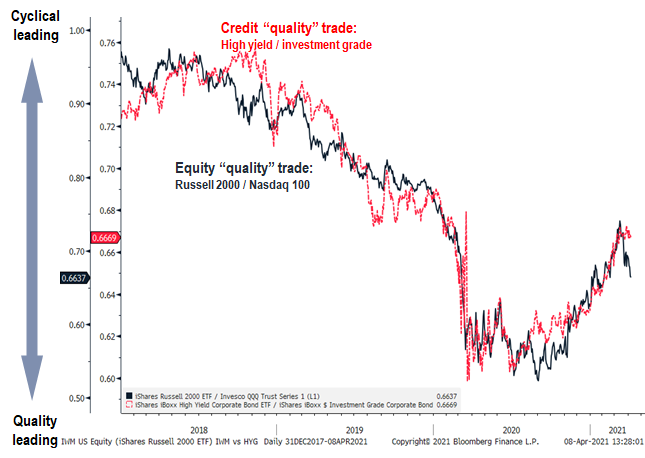
In fact, credit and equity have usually moved in lockstep in terms of quality. So these two indices have moved in tandem for many years. Below is the last 4 years and it is evident, “quality” moves in tandem. For the past 3 years, the correlation of these two indices is:
– R-squared since 2018 is 94%, meaning, they have moved closely together
Source: Bloomberg and Fundstrat
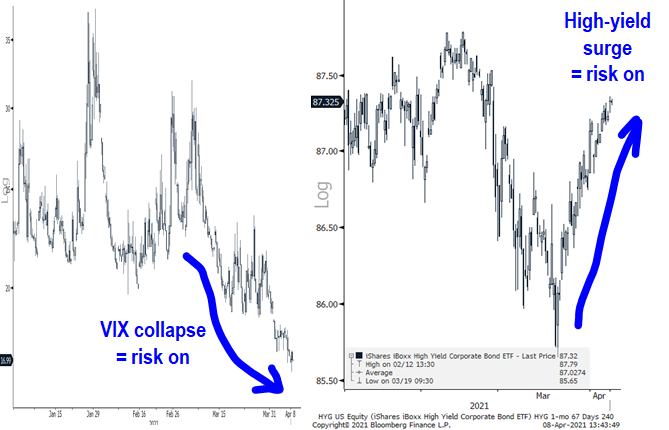
Take a look at the YTD charts for VIX and high-yield bonds (HYG ETF as a proxy).
– VIX continues to sink and is below 17
– HYG surging dramatically since mid-March
Recall, surging VIX is usually a sign of a market nervous. Similarly, High-yield does not rally when the macro environment is shaky. Thus, we have strong risk-on signals from VIX and credit.
Source: Bloomberg and Fundstrat
…94% correlation between credit and equity “quality” indices and implies IWM should be at $239
The natural question is what does this imply for “small-cap” stocks if equities catch up to the “quality” trade in credit. Foremost, we view small-caps as a good proxy for “epicenter” aka Cyclicals because of their higher composition of Cyclical stocks.
– 94% correlation between equity and credit “quality” indices
– we usually view credit as “leading”
– coupled with VIX saying “risk-on”
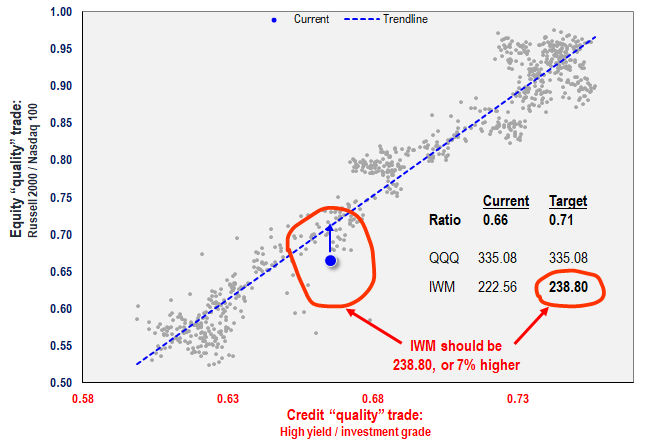
Check out the scatter chart below, which plots both indices (x-axis is credit, y-axis equities). And you can see that the current ratio is below the regression line. The regression says that at current credit levels:
– Equity quality ratio should be 0.71
– QQQ is $335.08
– Implies IWM should be at $238.80 (all-time high)
IWM is currently at $222.56, so this implies a +7% catch-up move coming for small-cap stocks. The catalyst could be 1Q2021 EPS season.
Source: Fundstrat and Bloomberg
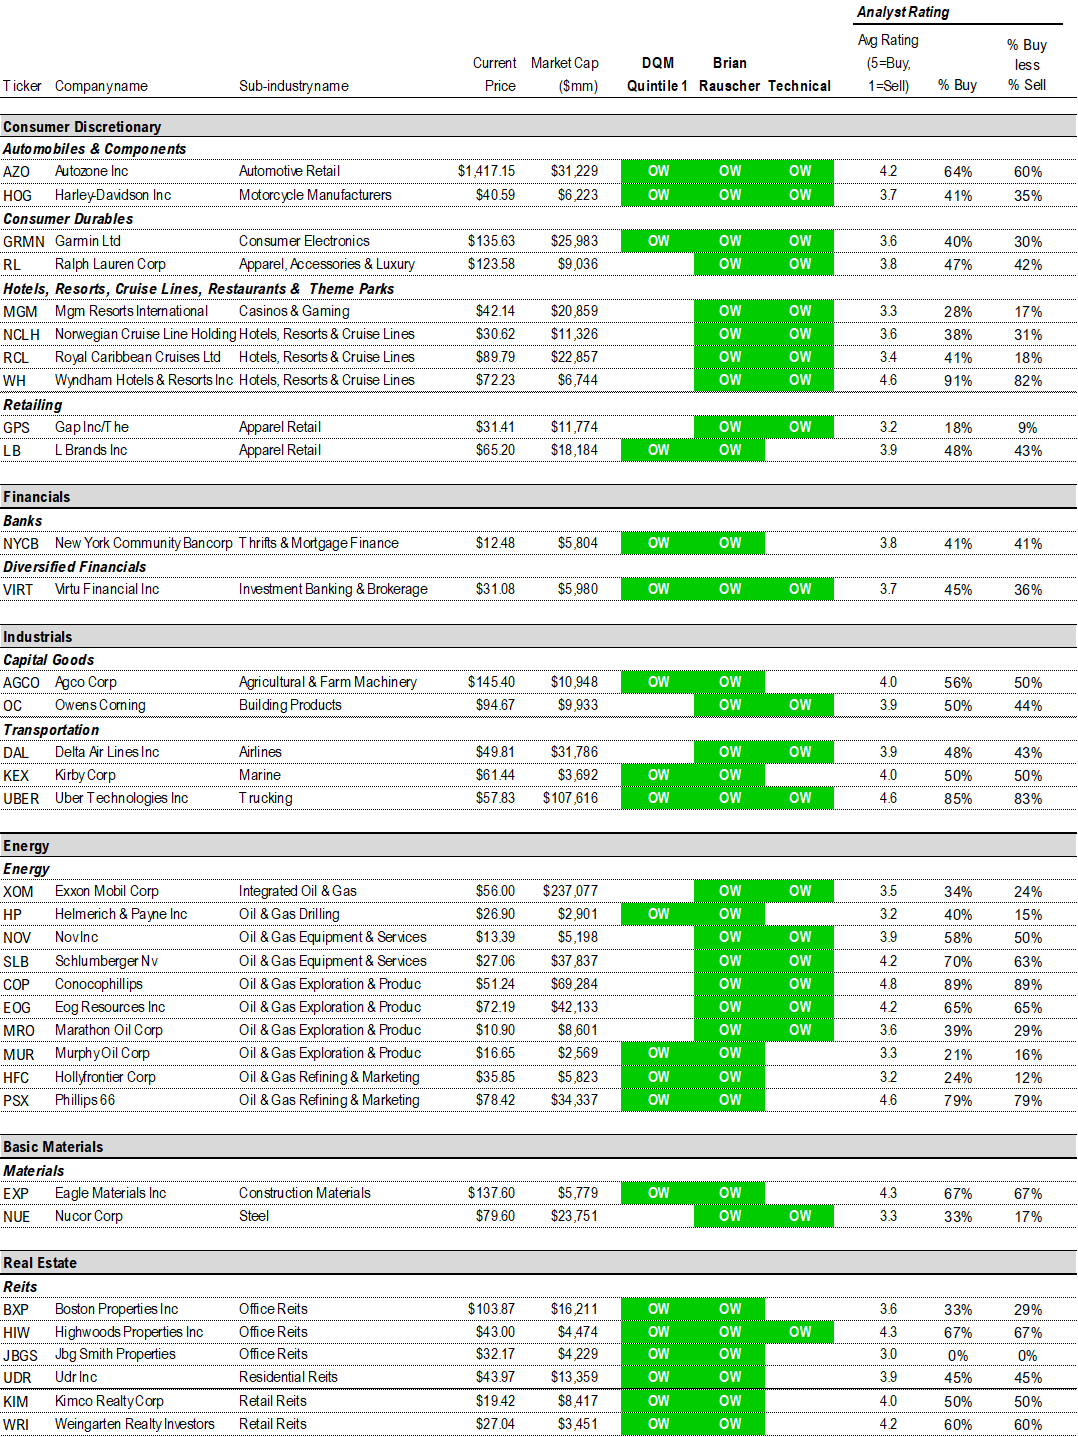
STRATEGY: Updating our Power Trifecta, adding net 10 stocks, now Power Trifecta 35 (*)
We are updating our Power Trifecta list. In this rebalance, 3 stocks are deleted and 13 stocks are added. Thus, the total number of stocks has risen by 10 to 35. This makes sense given the recent pullback in the Epicenter names (more stocks are attractive).
3 Deletions:
PBCT, NVT0.13% , VNO
13 Additions:
AZO0.42% , HOG0.56% , GRMN-0.85% , MGM0.90% , WH0.88% , GPS-1.28% , LB, VIRT2.38% , AGCO1.73% , OC-0.26% , UBER-2.95% . EXP-1.73% , NUE0.35%
35 “Power Trifecta” Stocks Ideas:
Consumer Discretionary:
AZO0.42% , HOG0.56% , GRMN-0.85% , RL0.72% , MGM0.90% , NCLH0.50% , RCL1.61% , WH0.88% , GPS-1.28% , LB
Financials:
NYCB0.34% , VIRT2.38%
Industrials:
AGCO1.73% , OC-0.26% , DAL-0.54% , KEX0.88% , UBER-2.95%
Energy:
XOM, HP1.92% , NOV1.35% , SLB-2.14% , COP1.23% , EOG1.07% , MRO0.33% , MUR1.77% , HFC, PSX0.91%
Materials:
EXP-1.73% , NUE0.35%
Real Estate:
BXP2.57% , HIW0.92% , JBGS1.44% , UDR1.73% , KIM2.59% , WRI
Source: Fundstrat, Bloomberg
(*) the 35 “Power Epicenter Trifecta” stock ideas are the subset of the original 108 “Epicenter Trifecta” stock list. For the full list of our original “Epicenter Trifecta” stock list, please click the link below. Please note that the stocks rated OW on this list meet the requirements of our investment theme as of the publication date. We do not monitor this list day by day. A stock taken off this list means it no longer meets our investment criteria, but not necessarily that it is neutral rated or should be sold. Please consult your financial advisor to discuss your risk tolerance and other factors that characterize your unique investment profile.
For the full list of the 108 “Epicenter Trifecta” stock ideas, please click here
ADDENDUM: We are attaching the stock lists for our 3 portfolios:
We get several requests to give the updated list for our stock portfolios. We are including the links here:
– Granny Shots –> core stocks, based on 6 thematic/tactical portfolios
– Trifecta epicenter –> based on the convergence of Quant (tireless Ken), Rauscher (Global strategy), Technicals
– Violence in USA –> companies that are involved in some aspect of home or personal security. We are not “recommending” these stocks, but rather, bringing these stocks to your attention.
Granny Shots:
Full stock list here –> Click here
Tickers: AAPL, CSCO, INTC, MXIM, NVDA, EBAY, KLAC, GRMN, GOOG, MNST, MSFT, AMZN, QCOM, TSLA, PYPL, AXP, BF/B, PM, XLNX, TGT, PG, XOM, VLO, GL, RF, ATVI, BBY, GE, AMAT, LRCX, MU, HPQ
Trifecta Epicenter (*):
Full stock list here –> Click here
Tickers: AAP, AN, AZO, F, GM, HOG, BBY, GRMN, GPC, LEG, TPX, PHM, NWL, MAT, PII, RL, MGM, HLT, MAR, NCLH, RCL, WH, TNL, SIX, FL, GPS, KSS, LB, VFC, WTFC, ASB, FNB, PB, TFC, WBS, PACW, NYCB, MTG, EVR, IBKR, VIRT, BK, STT, BHF, AGCO, OC, ACM, WAB, GNRC, CSL, GE, GGG, IEX, PNR, CFX, DOV, MIDD, SNA, XYL, FLS, EAF, ITT, ALK, DAL, JBLU, LUV, MIC, KEX, JBHT, R, UBER, UHAL, MAN, XOM, HP, BKR, HAL, NOV, SLB, COP, EOG, FANG, HES, MRO, MUR, PXD, XEC, HFC, MPC, PSX, EXP, CF, NEU, NUE, RS, SON, IP, ARE, BXP, HIW, JBGS, ESS, UDR, KIM, NNN, O, WRI, PSA
Violence in USA:
Full stock list here –> Click here
(*) Please note that the stocks rated OW on this list meet the requirements of our investment theme as of the publication date. We do not monitor this list day by day. A stock taken off this list means it no longer meets our investment criteria, but not necessarily that it is neutral rated or should be sold. Please consult your financial advisor to discuss your risk tolerance and other factors that characterize your unique investment profile.
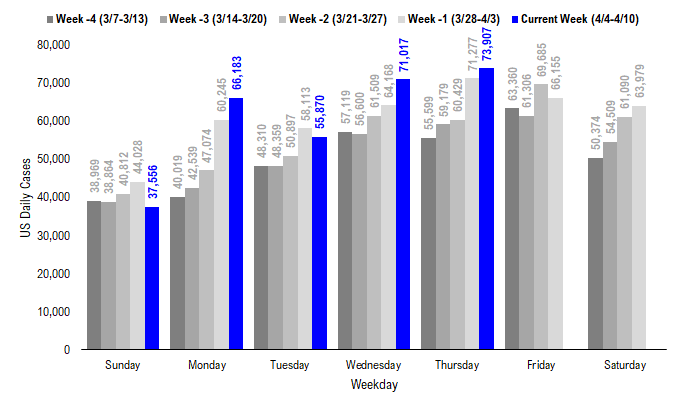
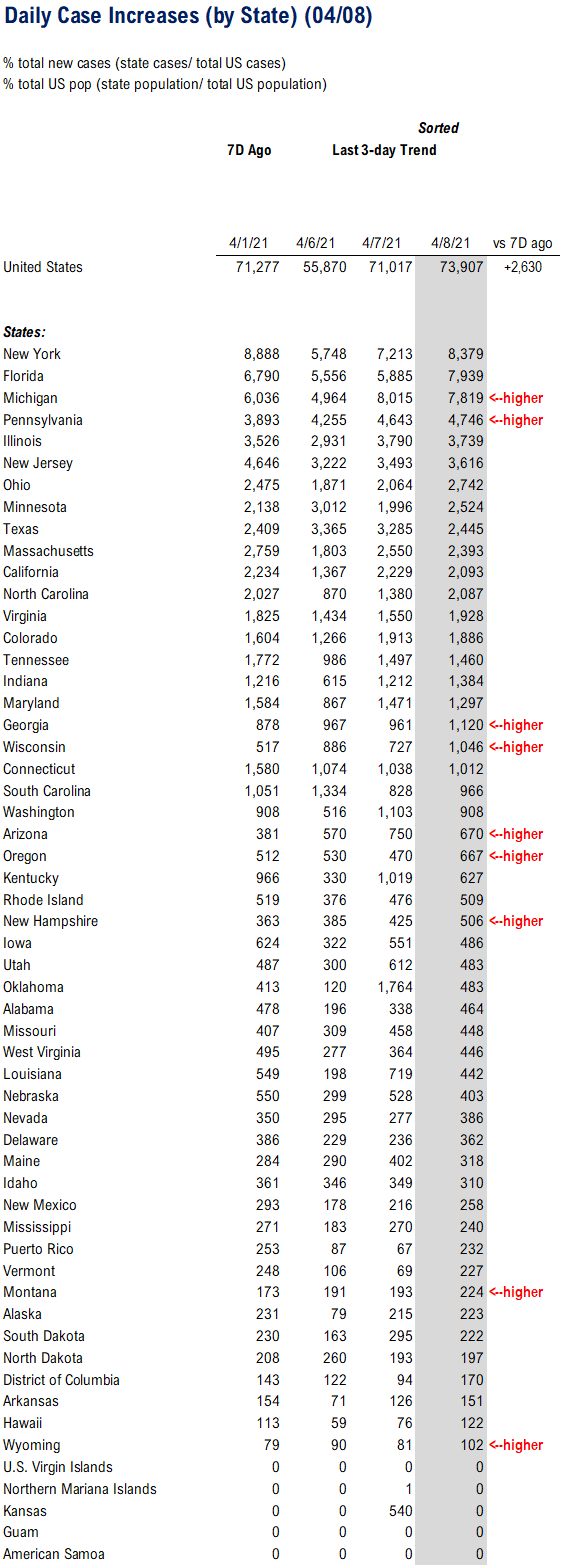
POINT 1: Daily COVID-19 cases 73,907, +2,630 vs 7D ago…
_____________________________
Current Trends — COVID-19 cases:
– Daily cases 73,907 vs 71,277 7D ago, up +2,630
– 7D positivity rate 4.8% vs 5.0% 7D ago
– Hospitalized patients 39,840 up +7.2% vs 7D ago
– Daily deaths 722, down -18% vs 7D ago
_____________________________
– The latest COVID-19 daily cases came in at 73,907, up +2,630 vs 7D ago.
– 7D delta in daily cases has been flat-lined for the past 3-4 weeks. As we wrote above, even if the daily confirmed case figures have been stalled, the number of daily deaths and the death rate continue to trend downward. The rollout of COVID vaccines could be the reason of this development.
– Also, at this stage of pandemic, vaccinations might matter more than daily case trends. As long as vaccinations work, eventually the rollout of the vaccines will lead to a decline in the pervasiveness of the COVID pandemic.
Source: Fundstrat and state health departments
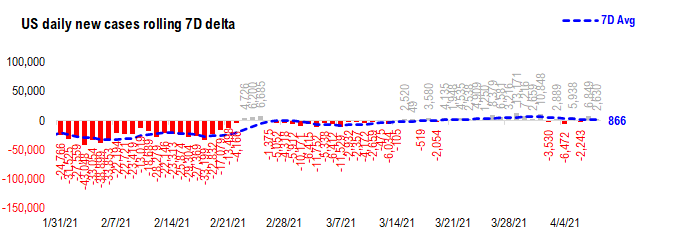
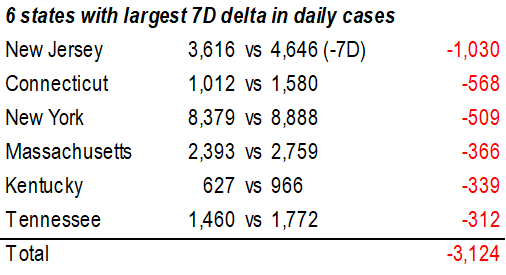
7D delta in daily cases has been flat-lined over the past 3-4 weeks…
7D delta in daily cases has been flat-lined for the past 3-4 weeks. As we wrote above, even if the daily confirmed case figures have been stalled, the number of daily deaths and the death rate continue to trend downward. The rollout of COVID vaccines could be the reason of this development.
Source: Fundstrat and state health departments
US hospitalization still rolling over … and even US deaths seem to be rolling over…
Below we show the aggregate patients who are currently hospitalized due to COVID. It has fallen significantly from the wave 3 peak.
Source: Fundstrat and state health departments
Source: Fundstrat and state health departments
Source: Fundstrat and state health departments
Source: Fundstrat and state health departments
POINT 2: VACCINE: 46 states (+1 from Tuesday) near ~60% infected + vaccinated…
_____________________________
Current Trends — Vaccinations:
Vaccinations ramping steadily
– avg 3.0 million this past week vs 2.9 million last week
– overall, 19.8% fully vaccinated, 33.5% 1-dose+ received
_____________________________
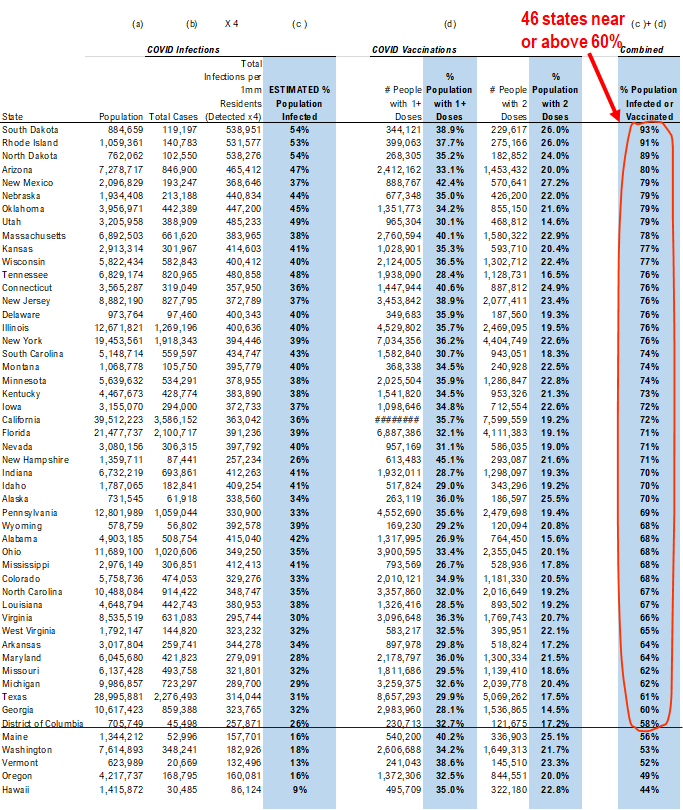
Vaccination frontier update –> 46 states now near or above 60% combined penetration (vaccines + infections)
Below we sorted the states by the combined penetration (vaccinations + infections). As we commented in the past, the key figure is the combined value >60%, which is presumably near herd immunity. That is, the combined value of infections + vaccinations as % population > 60%.
– Currently, 46 states (see below) are basically all at this level
– SD, ND and RI are now above or near 90% combined penetration (vaccines + infections)
– So slowly, the US is getting to that threshold of presumable herd immunity
Source: CDC and Fundstrat
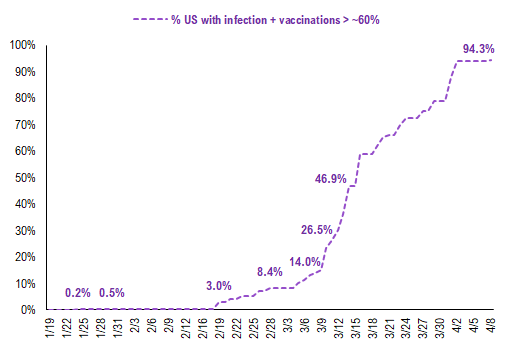
Collectively, these 46 states represent about 94.3% of the US population. As the chart below highlights, the US is seeing steady forward progress and this figure continues to rise steadily.
Source: CDC and Fundstrat
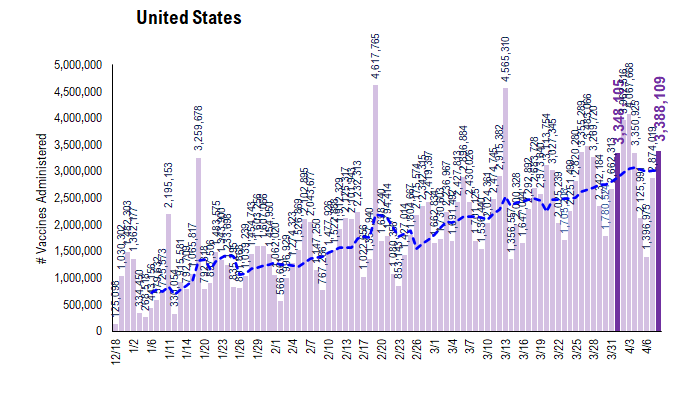
There were a total of 3,388109 doses administered on Thursday, flat from 7D ago. However, the pace is steadily rising, as evidenced by the 7D moving average (see blue line).
Source: CDC and Fundstrat
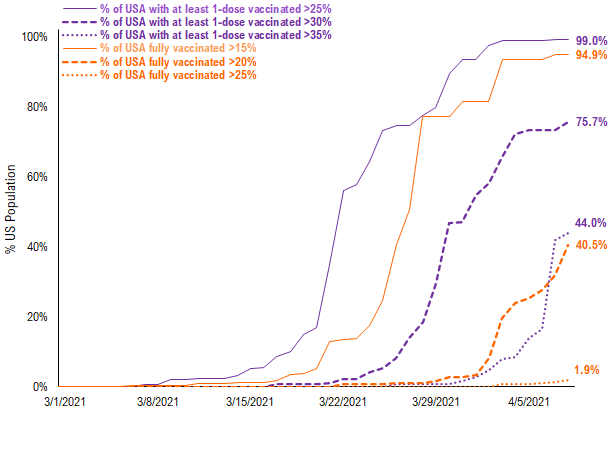
~75.7% of the US has seen 1-dose penetration >30%…
To better illustrate the actual footprint of the US vaccination effort, we have a time series showing the percent of the US with at least 15%/20%/25% of its residents fully vaccinated, displayed as the orange line on the chart. Currently, almost all US states have seen 15% of their residents fully vaccinated. However, when looking at the percentage of the US with at least 20% of its residents fully vaccinated, this figure is 40.5%. And only NM, SD, RI, AK and ME have seen 25% of its residents fully vaccinated – 1.9% of US population.
– While almost all US states have seen vaccine penetration >25%, 75.7% of them have seen 1 dose penetration >30% and only 44.0% of them have seen 1 dose penetration > 35%.
– Almost all of the US has at least 15% of its residents fully vaccinated, However, only 40.5% of US has fully vaccinated >20%
– This is still a small figure (15%/20% of residents fully vaccinated) but this figure is rising sharply now. This figure could rise even more rapidly after the JNJ’s 1-dose vaccines roll out.
Source: CDC and Fundstrat
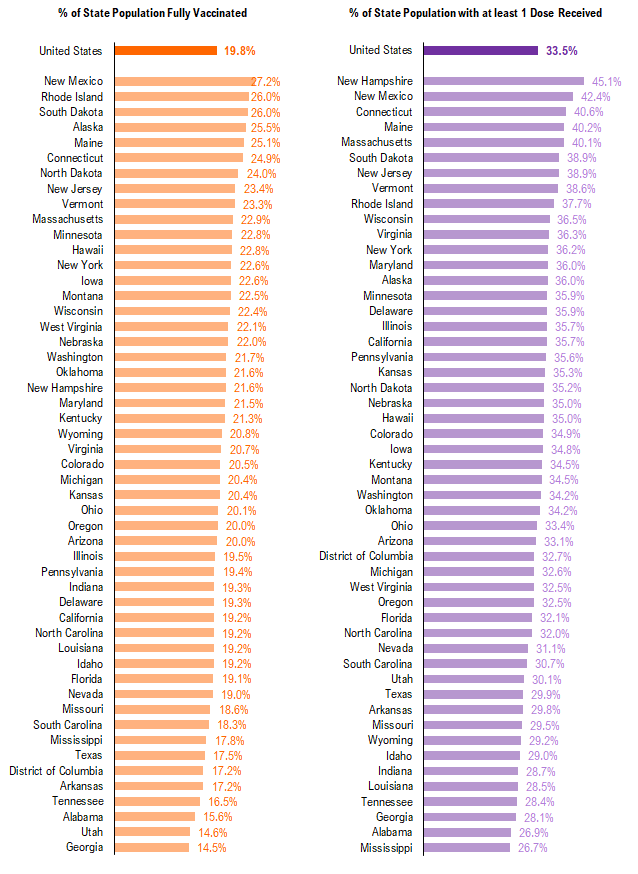
This is the state by state data below, showing information for states with one dose and for those with two doses.
Source: CDC and Fundstrat
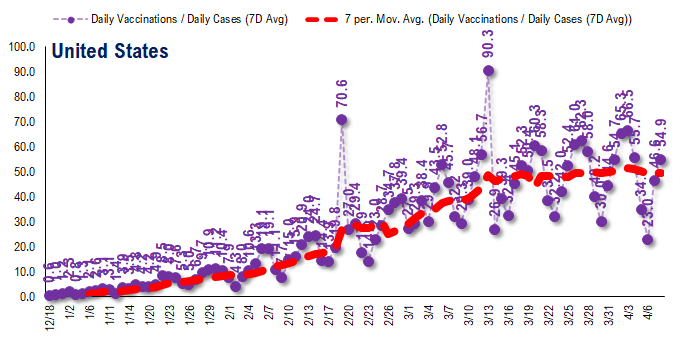
The ratio of vaccinations/ daily confirmed cases is generally trending higher (red line is 7D moving avg) and this is the most encouraging statistic.
– the 7D moving average is about ~45 for the past few days
– this means 45 vaccines dosed for every 1 confirmed case
This figure is rising nicely and likely surges in the coming weeks
Source: CD and Fundstrat
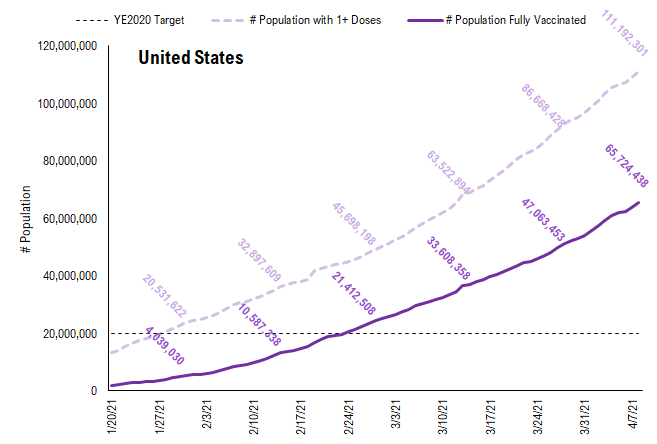
In total, about 111 million Americans have received at least 1 dose of a vaccine. This is a good pace and as we noted previously, implies 50% of the population by May.
Source: CDC and Fundstrat
POINT 3:Tracking “un-restricted” and “restriction-lifted” states
We are changing Point #3 to focus primarily on tracking the lifting of restrictions, as states begin to ease various mandates. Keep in mind, easing/lifting restrictions can take multiple forms:
– easing indoor capacity
– opening theaters, gyms, salons, saloons
– eliminating capacity restrictions
– eliminating mask mandates
So there is a spectrum of approaches. Our team is listing 3 tiers of states and these are shown below.
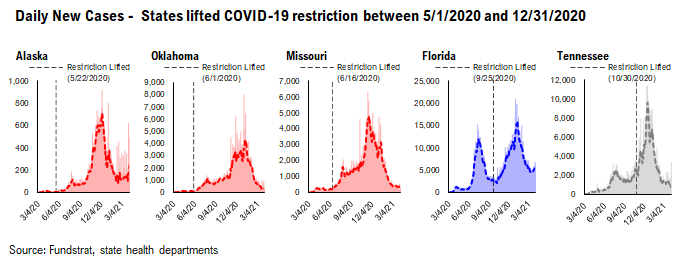
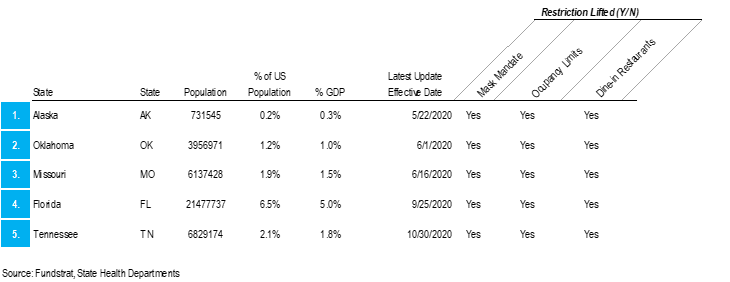
– states that eased in 2020: AK, OK, MO, FL, TN
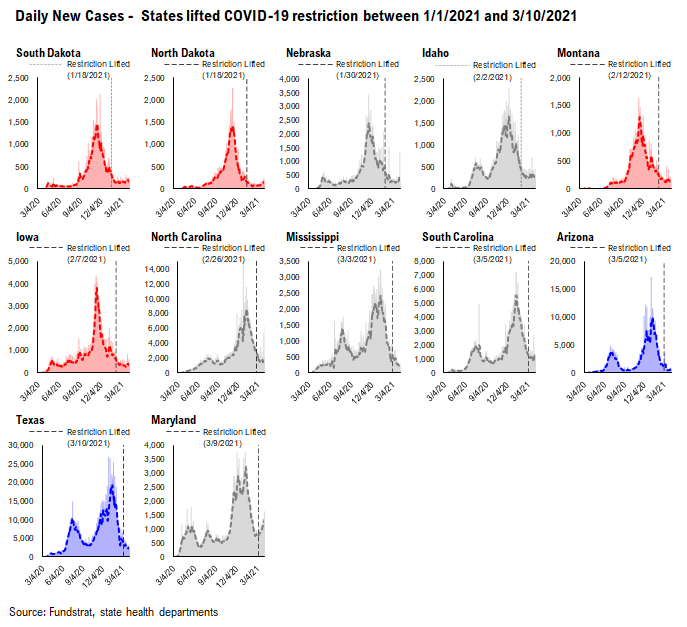
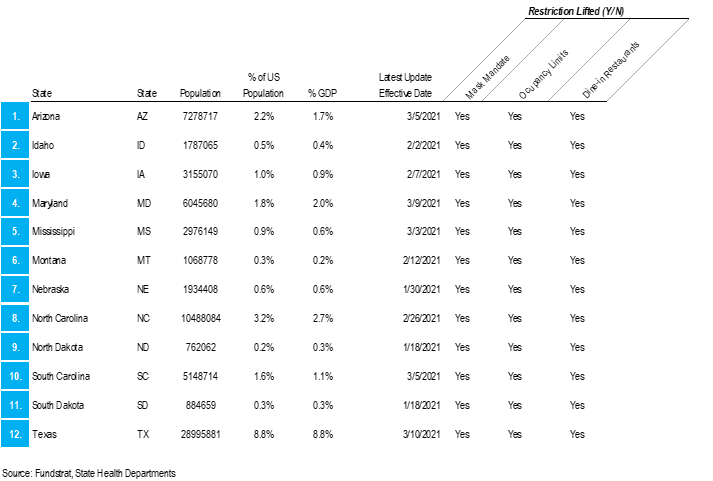
– states that eased start 2021 to now: SD, ND, NB, ID, MT, IA, NC, MS, SC, AZ, TX, MD
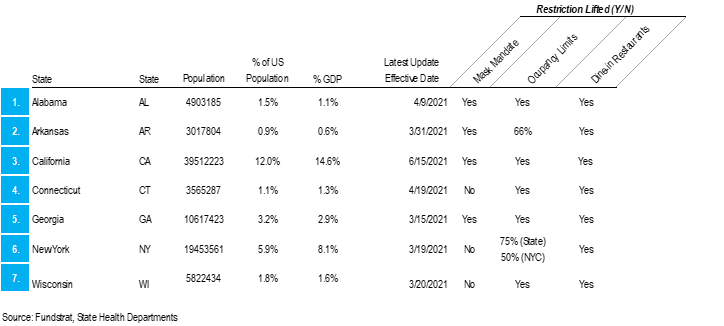
– states that announced future easing dates: GA, NY, WI, AR, CA, AL, CT
GROUP 1: States that eased restrictions in 2020…
The daily case trends in these states is impressive and it is difficult to say that lifting restrictions has actually caused a new wave of cases. Rather, the case trends in these states look like other states.
GROUP 2: States that eased restrictions in 2021 to now…
Similar to the list of states above, the daily case trends in these states are impressive and it is difficult to say that lifting restrictions has actually caused a new wave of cases.
– we have previously written about how ND and SD, in particular, have seen an utter obliteration of COVID-19 cases in those states
– that seems to be a function of vaccine penetration + infection penetration, leading to something akin to “herd immunity”
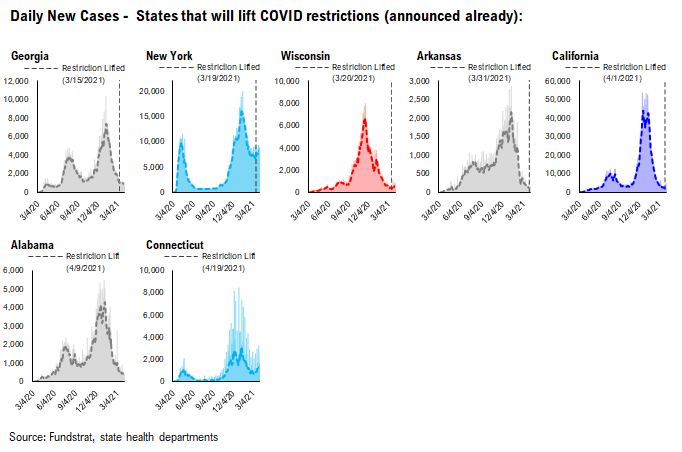
GROUP 3: States that announced plans ease restrictions in 2021…
These states have upcoming dates to ease restrictions. The dates are indicated on each chart. The cases trends in these states have been mostly positive, with perhaps the exception of NY state:
– NY state case levels seem awfully stubborn at these high levels
– weather is improving in NY area, so if weather has any effect on virus transmission, it should slow cases
More from the author
Articles Read 1/2
🎁 Unlock 1 extra article by joining our Community!
Stay up to date with the latest articles. You’ll even get special recommendations weekly.
Already have an account? Sign In fd71c6-afeaa0-6bb792-d22e8f-16b05f
Already have an account? Sign In fd71c6-afeaa0-6bb792-d22e8f-16b05f

