

Cases now rising in 16 states (+5 vs last week) but this is our baseline. While incoming inflation is "hot," financial markets (breakevens) see "cooling" of risk

Click HERE to access the FSInsight COVID-19 Daily Chartbook.
We publish on a 4-day a week schedule:
Monday
Tuesday
Wednesday
SKIP THURSDAY
Friday
REGISTER NOW: Exclusive Virtual Conference on Market Strategy into the Year-end and Beyond – Thursday (11/18) at 10am ET…
Please join us on Thursday November 18 at 10:00am ET for our annual virtual conference as the leading strategists at FSInsight provide their insights to help you navigate the markets into year-end and beyond. We are also pleased to announce that Michael Saylor (Chairman and CEO of MicroStrategy) will be joining the conference for a fireside chat with Tom Lee. Please find the details of the conference agenda below.

Link –> Click here to register
STRATEGY: While incoming inflation is “hot,” financial markets (breakevens) see “cooling” of risk
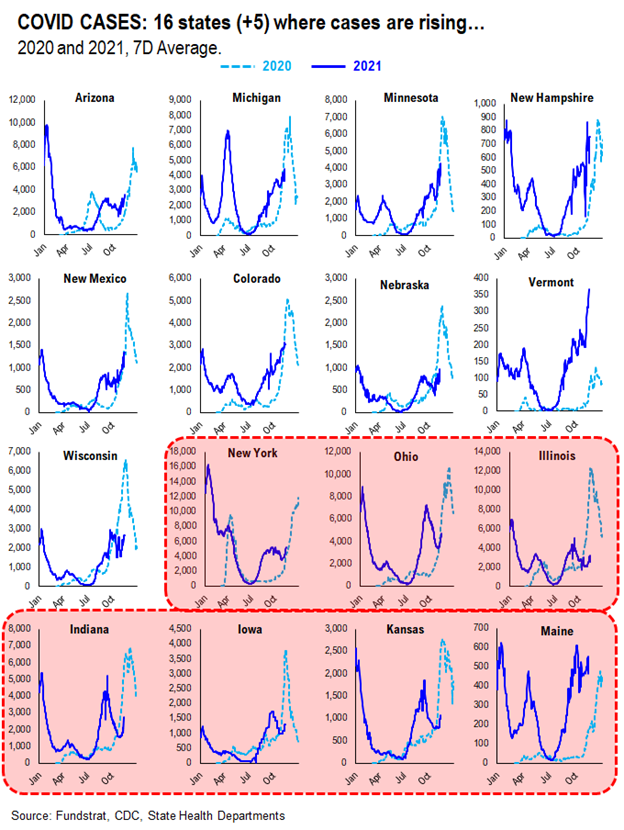
COVID-19 cases are essentially rising in 16 states (+5 net vs last week) Policymakers are increasingly shifting to the “endemic” view of COVID-19, meaning the high transmissibility of COVID-19 means achieving herd immunity and zero cases might be difficult. Seasonal flu and other diseases are also endemic. And the test of this framework will be coming to the US, as COVID-19 cases are starting to trend higher:
– the 7-day moving average, after flattening for several weeks
– is now curling higher

16 states (+5 versus last week) are seeing higher cases
The number of states with rising cases is now reaching +16:
– this week, there are 16 states with rising cases
– last week, there were 11 states, or +5 net
– Nevada and Utah were removed (see below)
– 7 states added: NY, OH, IL, IN, IA, KS, ME
These are not southern states seeing a rise in cases. It is basically states that are starting to see colder weather. And with less sun, and colder weather, immune systems are weakened.
…Policymakers are warning about a rise in US cases in coming weeks
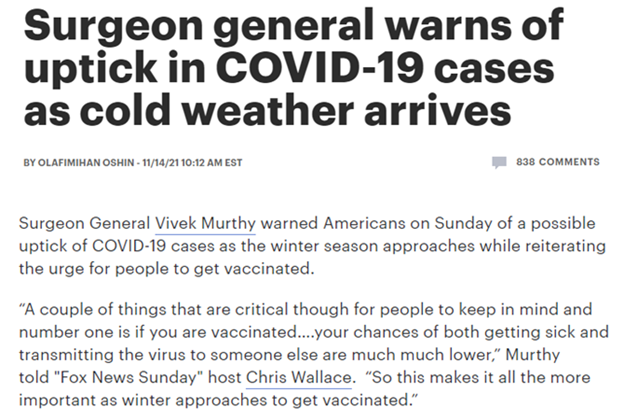
This is consistent with the Surgeon General warning. On Sunday, Surgeon General Vivek Murthy warned that an uptick of cases is likely as the winter season approaches. This is not a surprise, as many of you are aware, as this is also the baseline forecast of the IHME (Institute for Health Metrics).
– the rise in cases in the Winter is not expected to surpass summer (Wave 4) peak of 300,000
– but instead peak around daily cases of 150,000 or so
– daily cases are sub-100,000 currently
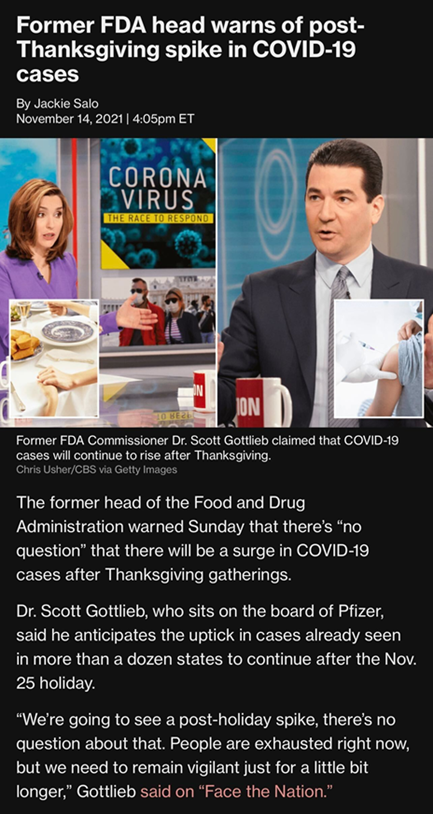
Dr. Scott Gottlieb also warned on CBS Face the Nation (Sunday) that he expects a spike in cases post-Thanksgiving. Similar to the advice of the Surgeon General, Gottlieb advocates Americans to get vaccinated or the booster, to mitigate the risks.
– But unlike 2020, we think there is far less stigma for those getting infected
– Delta variant is highly contagious
– we expect Americans to be looking forward to holiday gatherings this year
In the UK, policymakers did not take any mitigating steps as cases surged. And UK cases eventually apexed and began to slow down. We believe the US is watching this closely.
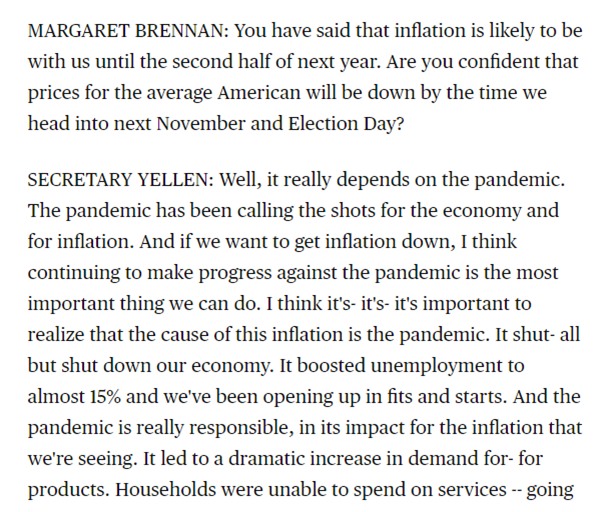
Treasury Secretary Yellen asserts COVID-19 pandemic is cause of inflation… a “transitory” view
Treasury Secretary Yellen was on CBS Face the Nation on Sunday and the entire interview focused on inflation. When mainstream media reports on it (granted it’s a Sunday morning, more serious show), we know that this is also what is gripping the public. We have attached the link to the transcript here, in case that is of interest.
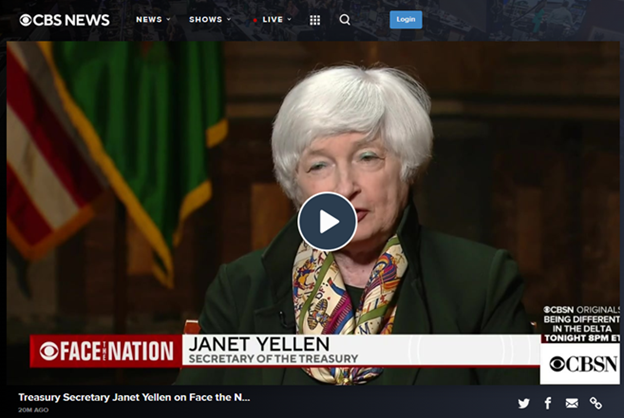
The very first question hits at the heart of the issue. When will inflation end?
And Yellen gives 4 reasons she sees COVID-19 at the heart of the inflation issue:
– it shut down the US economy (and re-opening is never smooth)
– boosted unemployment and now creates imbalances in labor markets (shortages)
– dramatic increase in demand for (some) products
– supply chain disruptions (leading to price increases)
These are obviously reasonable arguments. And the key question is whether markets and the public will tolerate these arguments.
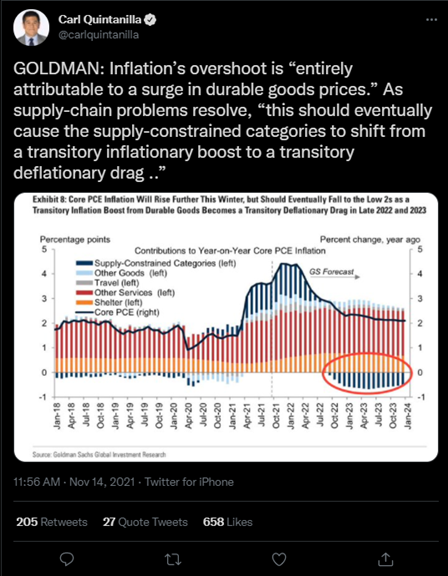
Goldman Sachs Economics team also have suggested the same. Below are abstracts posted on twitter by CNBC’s Carl Quintinilla over the weekend and GS notes:
– GS notes the “overshoot” is entirely attributable to goods prices
– at this “vintages” it will become a source of deflationary drag
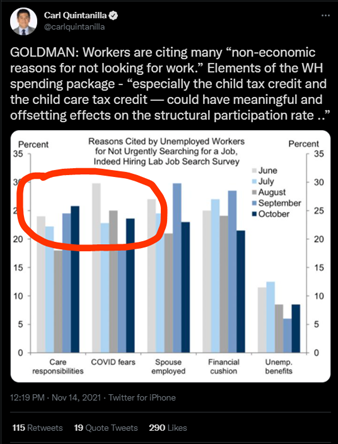
– GS also cites that nearly 49% cite “non-economic reasons for not looking for work”
– including COVID-19 fears and “care responsibilities”
– This is consistent with the BLS Pulse Surveys, showing this as well
…If inflation pressures are due to COVID-19, Fed tightening is not necessarily the solution
If inflationary pressures are building, the reflexive expectation is for Central Banks to tackle this issue. But if inflationary pressures stem from:
– Supply chain glitches
– Shortages stemming from “pandemic over-ordering”
– Labor shortages stemming from “COVID-19 fears”
– Shortages stemming from lack of capex (housing, oil)
– many of these inflationary pressures are transitory, not structural
How does tightening monetary policy solve this? Aren’t many of these fiscal issues?
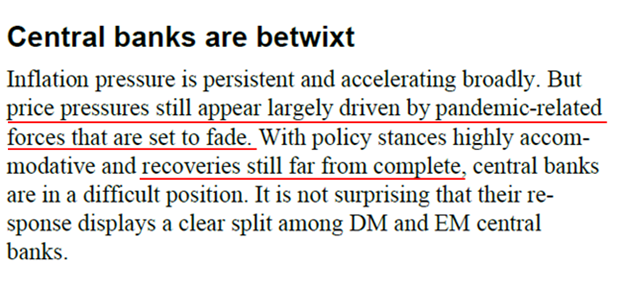
– In fact, that is what Bruce Kasman, Chief Economist at JPMorgan and team posit. They see Central bankers as split on this issue:
– economic recovery is far from complete
– price pressures from the pandemic will fade
– but the timing is unknown
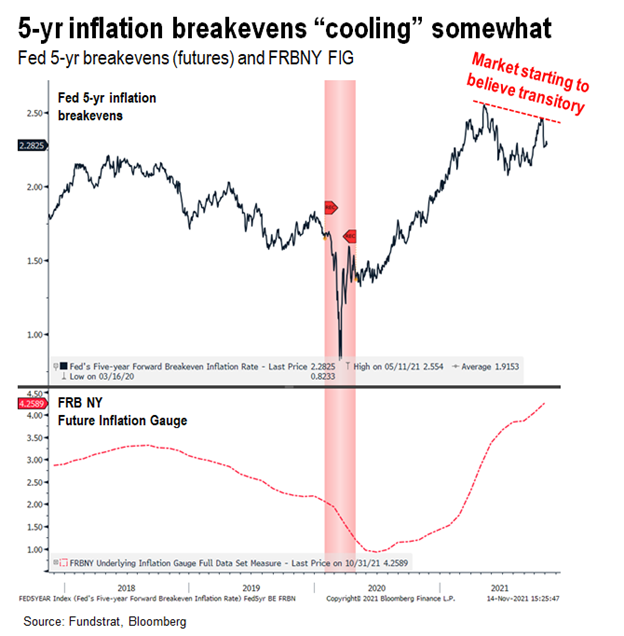
…Inflation breakevens slightly cooling, suggesting financial markets beginning to believe “transitory”
The 5-year inflation breakevens started to cool off a bit, as shown below:
– from a market’s perspective, inflation fears peaked May 2021
– and have since failed to surge to new highs
– thus, even as contemperaneous inflation readings have been “hot”
– the market’s fear of these current readings seems cooling
In other words, it looks like the market is increasingly shifting towards “transitory”
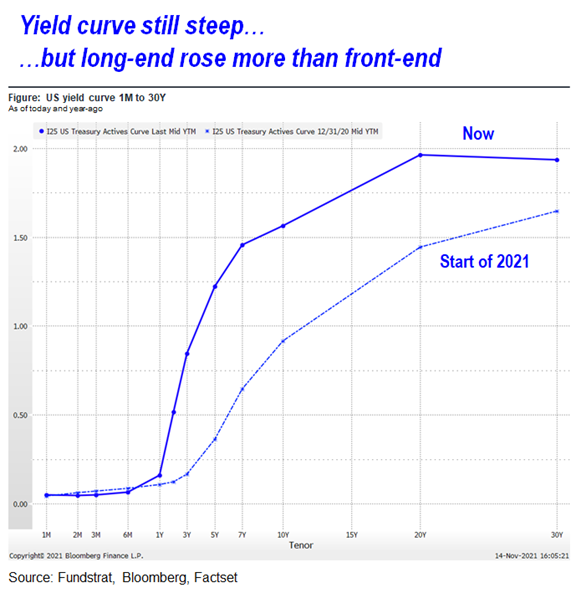
Yield curve is actually steeper now than versus start of 2021 = cyclically stronger
Taking a step back, take a look at the yield curve now compared to the curve at the start of 2021:
– at all the maturities, rates are higher
– and it moved higher at the longer maturities
– so compared to the start of the year, growth expectations are stronger
This is a pro-cyclical sign as long term rates generally reflect a view on nominal growth –> the higher the nominal growth expected, the higher the longer-term rates should be expected. In other words, the implication from the rates market is future growth is expected to be stronger.
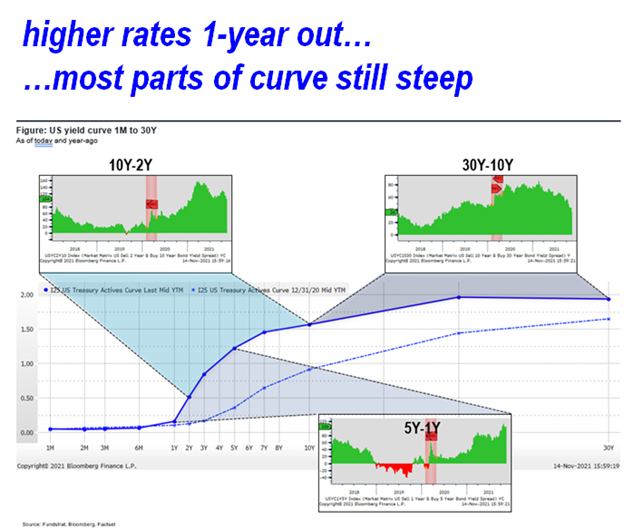
We have mapped the various spreads below, reflecting different parts of the yield curve:
– 5Y-1Y is steep, showing markets seeing “liftoff” by Fed in future years = healthy
– 10Y-2Y is still relatively steep = good
– 30Y-10Y has flattened, but it is still relatively steep
The latter portion of the curve is sending the least “positive” signal, but at this moment, I don’t view it as negative. Yet.
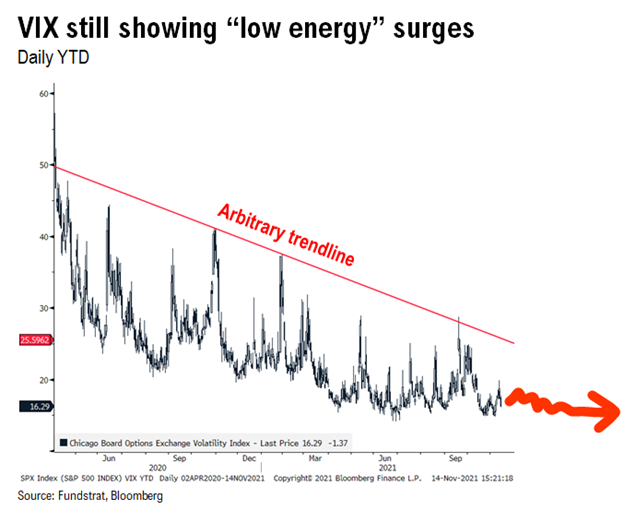
…VIX still trending lower = risk-on
This chart is something we refer to periodically and it is showing that VIX is still trending lower.
– lower highs = good
– lower VIX = CTA (commodity trading advisors) and Quants adding leverage (value-at-risk)
– lower VIX also means fewer investors seeking protection
Thus, trending lower is a low-grade tailwind for stocks.
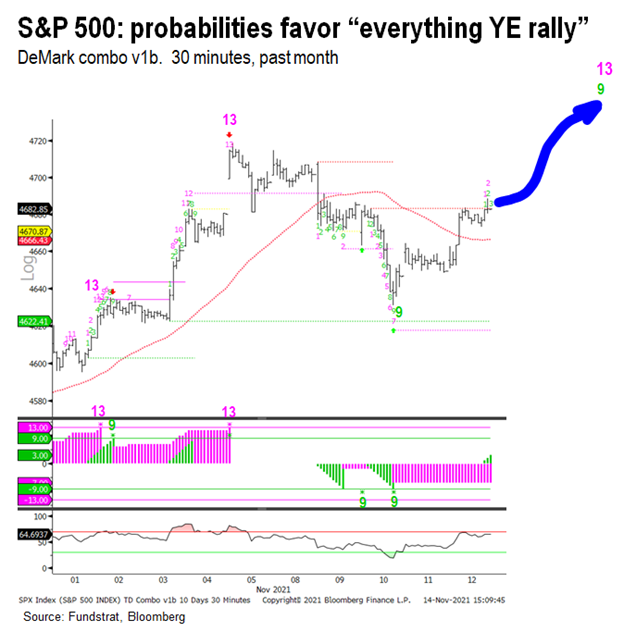
YE EVERYTHING RALLY: Still seems intact
Last week’s market tumult looks like a consolidation for stocks. Consolidating gains after a relentless gain. And we believe stocks still have positive risk/reward into YE:
– a key pivot remains how markets reaction to inflation risk
– incoming inflation readings have been stronger than expected
– yet, inflation breakevens have cooled
– thus, one could suggest markets are shifting increasingly to the “transitory” camp
If so, this supports the risk-on into YE.
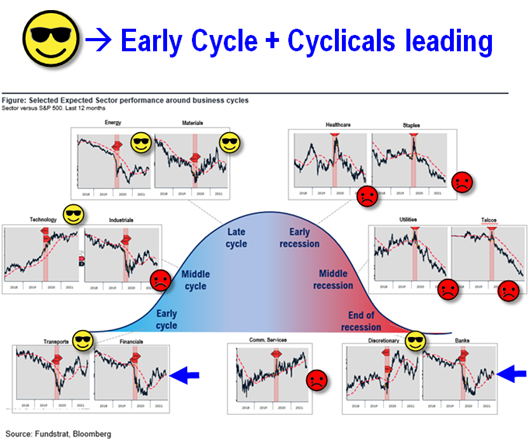
SECTORS: Leadership still Cyclicals/Early-cycle aka Epicenter
Relative sector performance is shown below and as we can see, 5 sectors are showing positive relative trend:
– Energy
– Basic Materials
– Technology
– Transports
– Discretionary
– sort of Financials/Banks
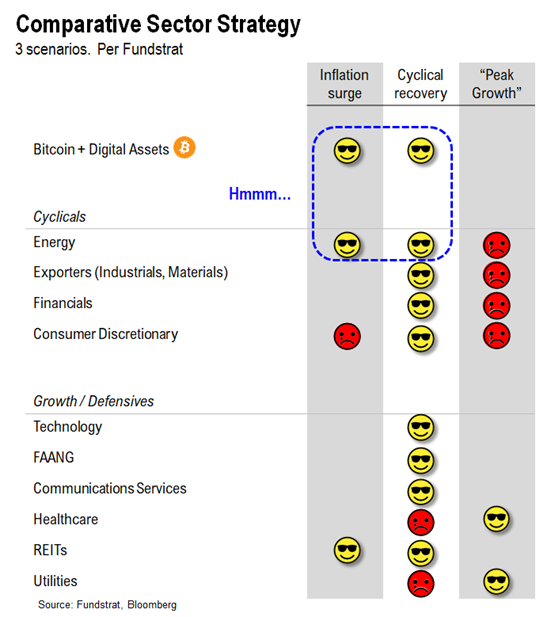
These are all cyclical groups. And also have general positive exposure to reflationary trends. Inflation, incidentally, in isolation is not a bad word. The real risk to markets is:
– too much inflation hurting consumer confidence
– or unanchored inflation expectations, fear of uncontained inflation
This is not necessarily what markets seem to be pricing. If markets were worried about either of the above, Defensive stocks or Growth stocks would be leading. Instead, we are seeing Cyclicals lead.
Into YE, our recommended strategies are:
– Energy
– Homebuilders (Golden 6 months): XHB
– Small-caps: IWM0.22%
– Epicenter: XLI-0.18% XLF1.38% XLB-0.08% RCD
– Crypto equities: BITO1.04% GBTC1.04% BITW1.27%
Into 2022…
– Industrials
30 Granny Shot Ideas: We performed our quarterly rebalance on 10/25. Full stock list here –> Click here
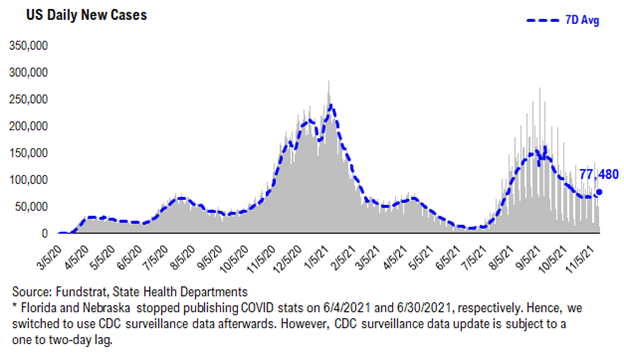
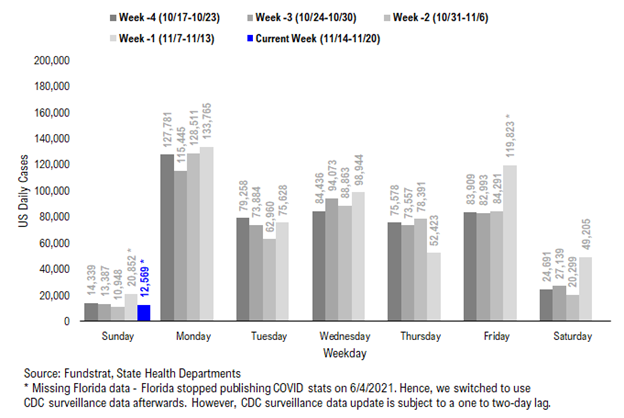
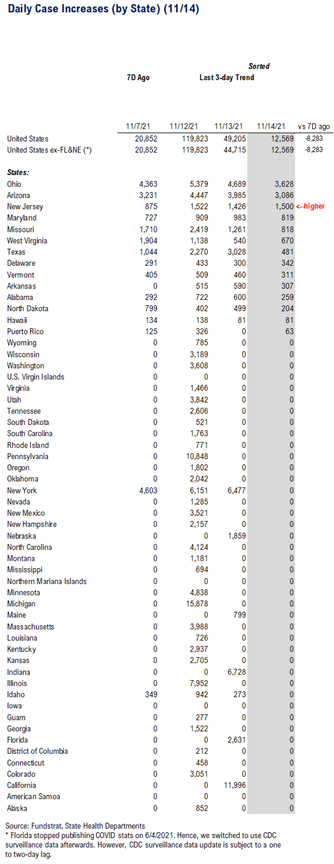
POINT 1: Daily COVID-19 cases 12,569, down -8,283 vs 7D ago…
Current Trends — COVID-19 cases:
– Daily cases 12,569 vs 20,852 7D ago, down -8,283
– Daily cases ex-FL&NE 12,569 vs 20,852 7D ago, down -8,283
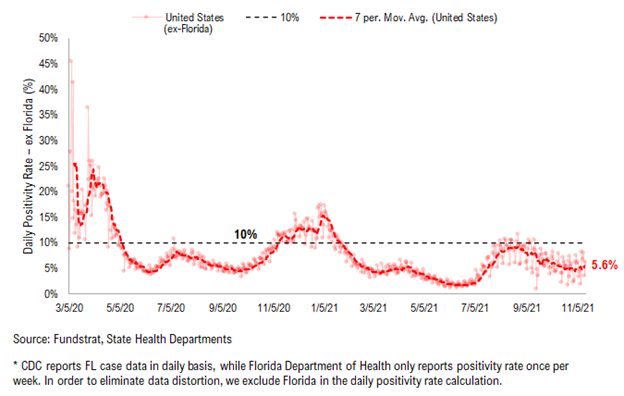
– 7D positivity rate 5.6% vs 5.1% 7D ago
– Hospitalized patients 43,418 , up +2.4% vs 7D ago
– Daily deaths 1,056, down -1.1% vs 7D ago
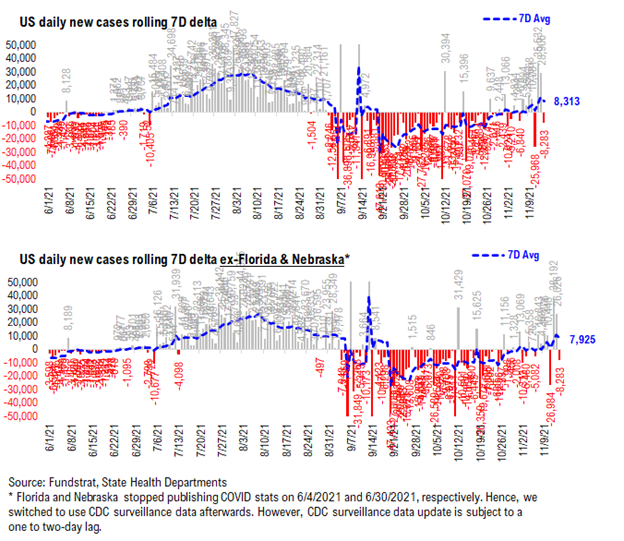
*** Florida and Nebraska stopped publishing daily COVID stats updates on 6/4 and 6/30, respectively. We switched to use CDC surveillance data as the substitute. However, since CDC surveillance data is subject to a one-to-two day lag, we added a “US ex-FL&NE” in our daily cases and 7D delta sections in order to demonstrate a more comparable COVID development.
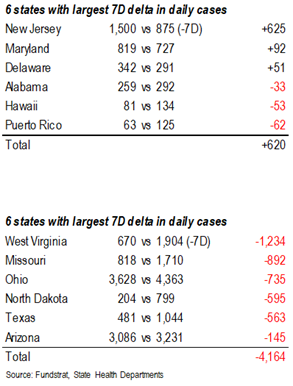
The latest COVID daily cases came in at 12,569, down -8,283 vs 7D ago. Many states didn’t report COVID data on Thursday in observance of Veteran’s Day. As such, the data is currently distorted as evident by the recent fluctuating 7D deltas.
Rolling 7D delta distorted due to observance of Veteran’s Day…
The rolling 7D delta is currently distorted due to the underreporting resulting from the observance of Veteran’s Day.
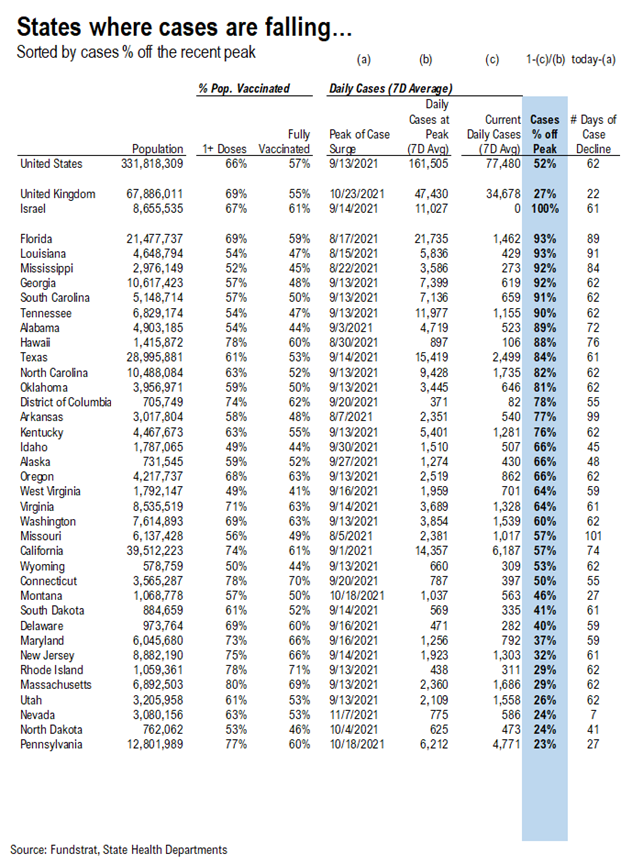
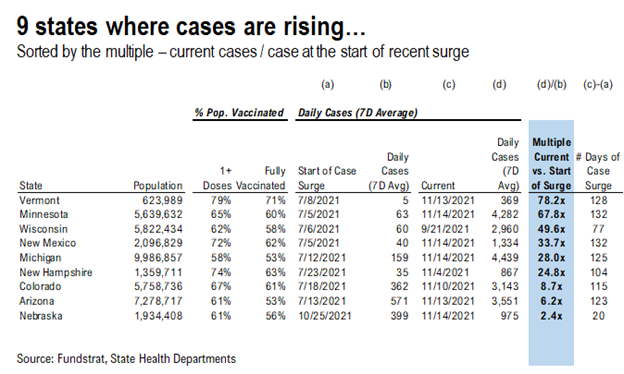
9 states are seeing a rise in cases while cases continue to decline in the remaining states…
*** We’ve split the “Parabolic Case Tracker” into 2 tables: one where cases are falling, and the other where cases are rising
In these tables, we’ve included the vaccine penetration, case peak information, and the current case trend for 50 US states + DC. The table for states where cases are declining is sorted by case % off of their recent peak, while the table for states where cases are rising is sorted by the current daily cases to pre-surge daily cases multiple.
– The states with higher ranks are the states that have seen a more significant decline / rise in daily cases
– We also calculated the number of days during the recent case surge
– The US as a whole, UK, and Israel are also shown at the top as a reference
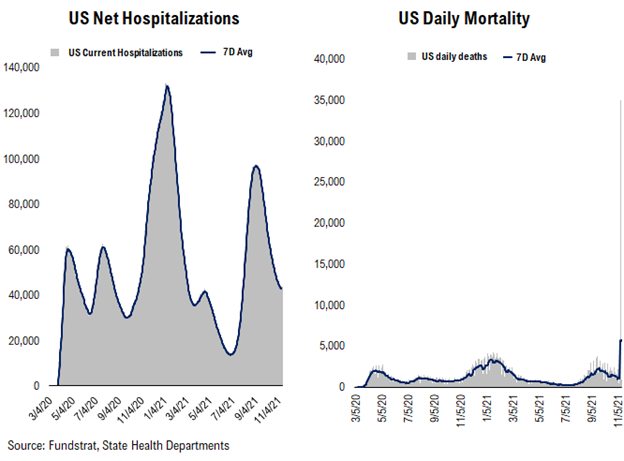
Hospitalizations, deaths, and positivity rates are rolling over amidst case rollover…
Below we show the aggregate number of patients hospitalized due to COVID, daily mortality associated with COVID, and the daily positivity rate for COVID.
– Net hospitalizations peaked below the Wave 3 peak and are currently rolling over
– Daily death peaked slightly above the Wave 2 peak and are currently rolling over
– As per the decline in daily cases, the positivity rate is currently rolling over
POINT 2: VACCINE: vaccination pace accelerates as boosters become more widely available...
Current Trends — Vaccinations:
– avg 1.4 million this past week vs 1.2 million last week
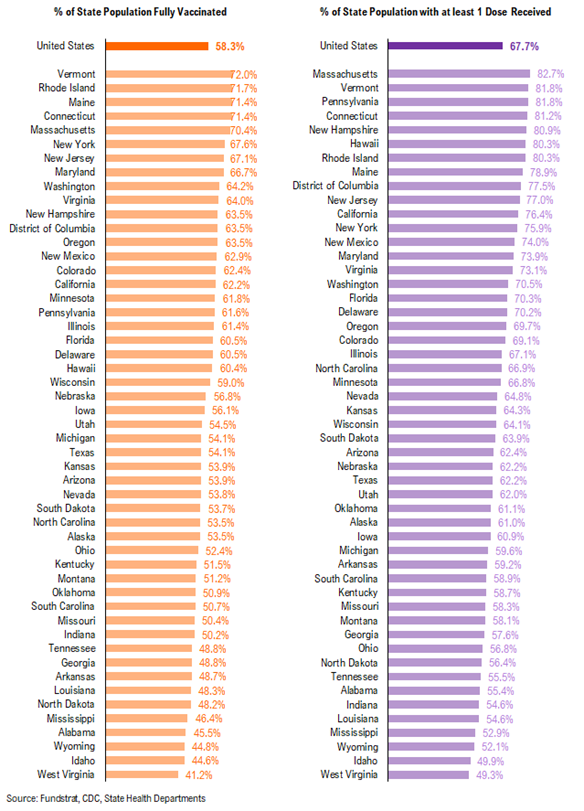
– overall, 58.3% fully vaccinated, 67.7% 1-dose+ received
Vaccination frontier update –> all states now near or above 80% combined penetration (vaccines + infections)
*** We’ve updated the total detected infections multiplier from 4.0x to 2.5x. The CDC changed the estimate multiplier because testing has become much better and more prevalent.
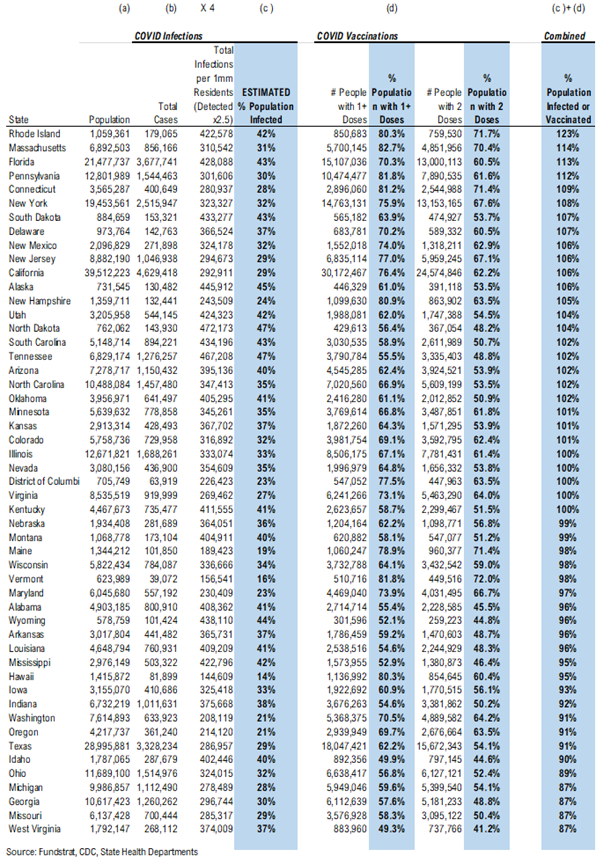
Below we sorted the states by the combined penetration (vaccinations + infections). The assumption is that a state with higher combined penetration is likely to be closer to herd immunity, and therefore, less likely to see a parabolic surge in daily cases and deaths. Please note that this “combined penetration” metric can be over 100%, as infected people could also be vaccinated (actually recommended by CDC).
– Currently, all states are near or above 80% combined penetration
– Given the new multiplier. only RI, FL, MA, CT, NM, NY, NJ, IL, CA, PA, DE, SD, KY, UT, OK, ND, NH, AZ, SC, TN, AK, NC, CO, KS, MN, and NV are now above 100% combined penetration (vaccines + infections). Again, this metric can be over 100%, as infected people could also be vaccinated. But 100% combined penetration does not mean that the entire population within each state is either infected or vaccinated
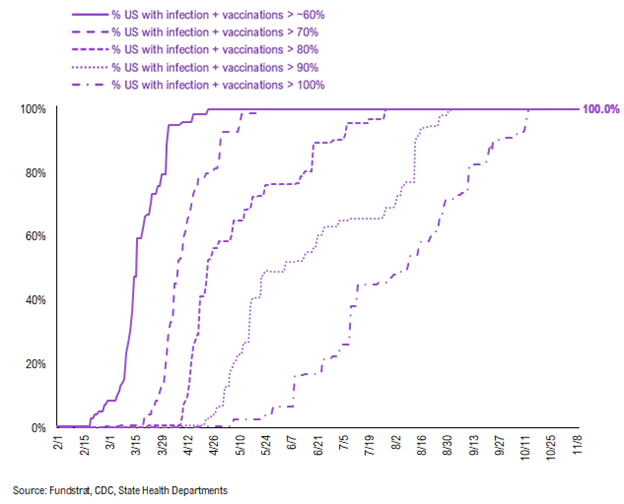
Below is a diffusion chart that shows the % of US states (based on state population) that have reached the combined penetration >60%/70%/80%/90%/100%. As you can see, all states have reached combined infection & vaccination >100% (Reminder: this metric can be over 100%, as infected people could also be vaccinated. But 100% combined penetration does not mean that the entire population within the state is either infected or vaccinated).
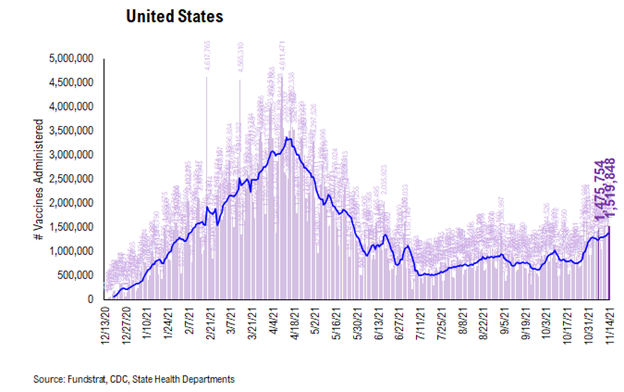
There were a total of 1,519,848 doses administered reported on Sunday, up 2% vs. 7D ago. We are seeing the vaccination pace accelerate as booster shots are becoming more widely available. Also, the same catalysts remain in place:
– Proof of vaccination required by many US cities and venues
– Booster shots
– Full FDA approval of Pfizer COVID vaccines (hopefully it could help overcome vaccine hesitancy)
– Biden’s vaccination plan
The daily number of vaccines administered remains the most important metric to track this progress and we will be closely watching the relevant data.
74.9% of the US has seen 1-dose penetration >60%…
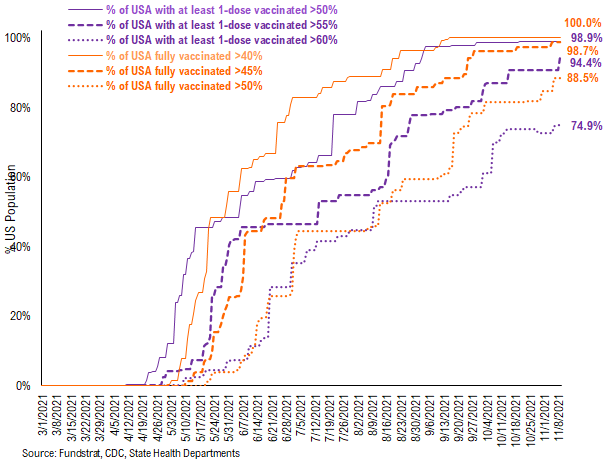
To better illustrate the actual footprint of the US vaccination effort, we have a time series showing the percent of the US with at least 45%/45%/50% of its residents fully vaccinated, displayed as the orange lines on the chart. Currently, 100% of US states have seen 40% of their residents fully vaccinated. However, when looking at the percentage of the US with at least 45% of its residents fully vaccinated, this figure is 98.7%. And only 88.5% of US (by state population) have seen 50% of its residents fully vaccinated.
We have done similarly for residents with at least 1-dose of the vaccination, denoted by the purple lines on the chart. While 98.9% of US states have seen 1 dose penetration >50%, 94.4% of them have seen 1 dose penetration >55% and 74.9% of them have seen 1 dose penetration > 60%.
This is the state by state data below, showing information for individuals with one dose and two doses.
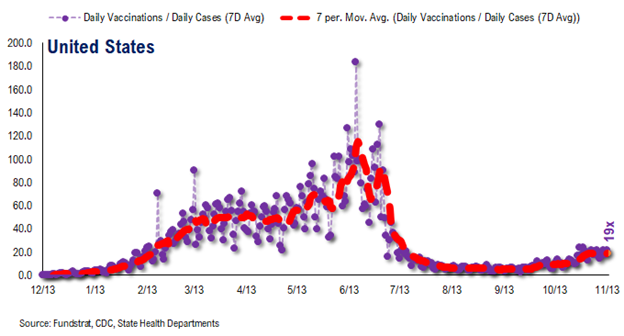
The ratio of vaccinations/ daily confirmed cases has been falling significantly (red line is 7D moving avg). Both the surge in daily cases and decrease in daily vaccines administered contributed to this.
– the 7D moving average is about ~19 for the past few days
– this means 19 vaccines dosed for every 1 confirmed case
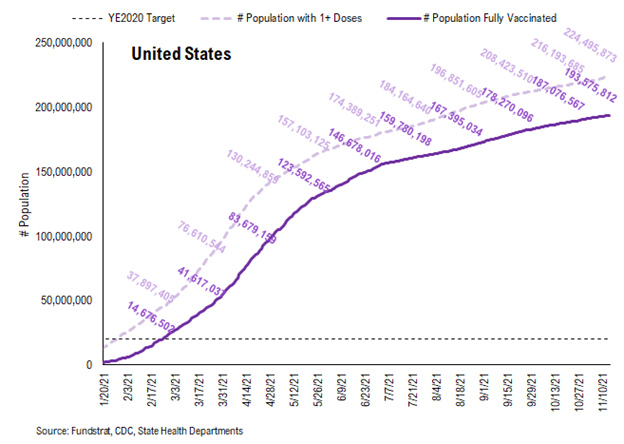
In total, 418 million vaccine doses have been administered across the country. Specifically, 224 million Americans (68% of US population) have received at least 1 dose of the vaccine. And 194 million Americans (59% of US population) are fully vaccinated.
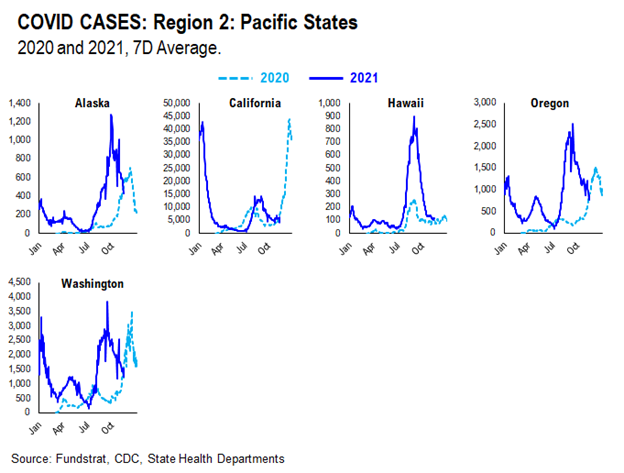
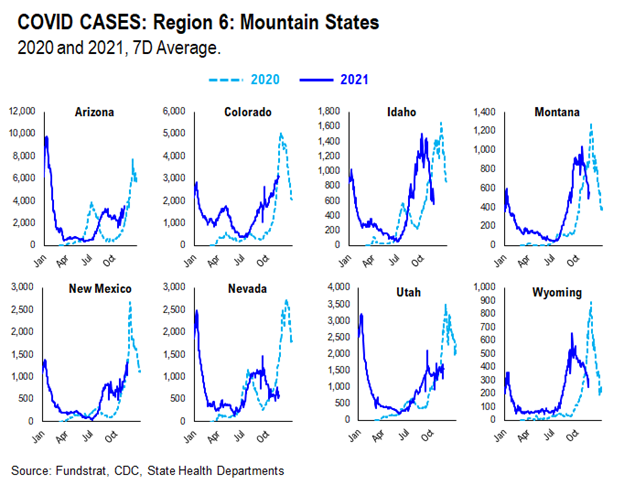
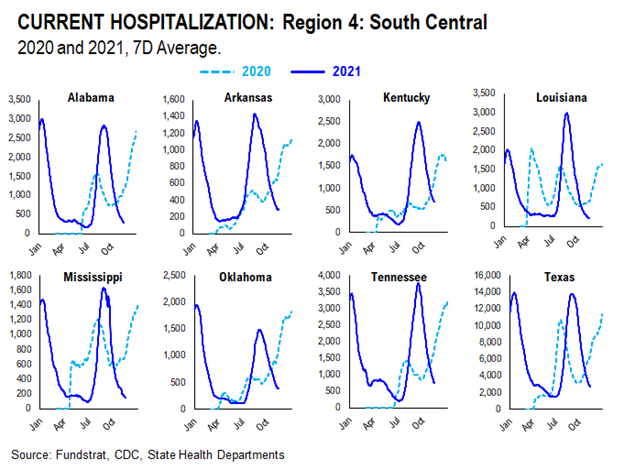
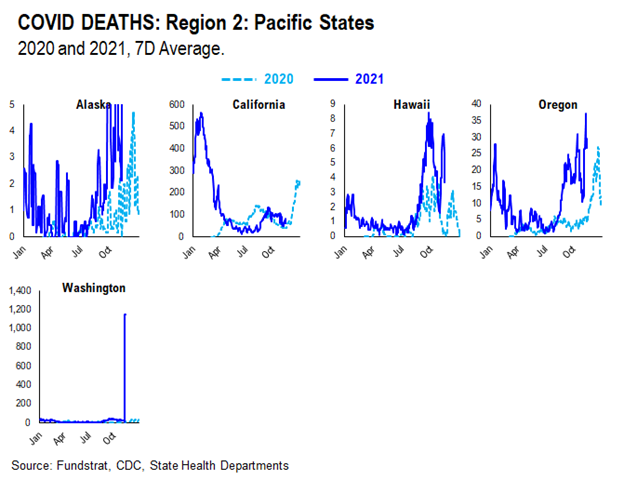
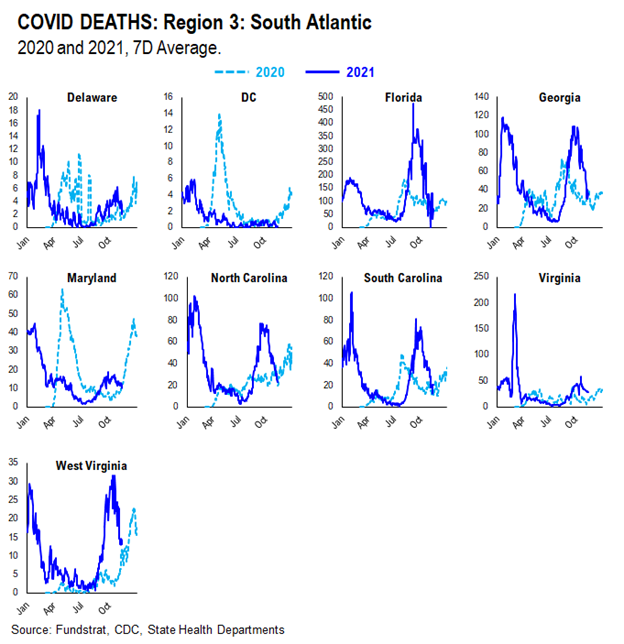
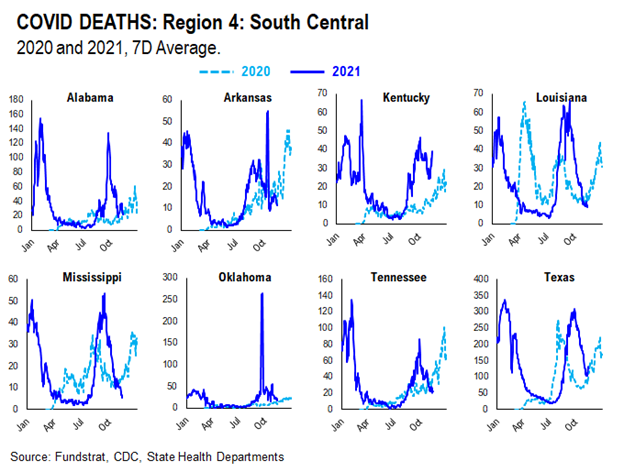
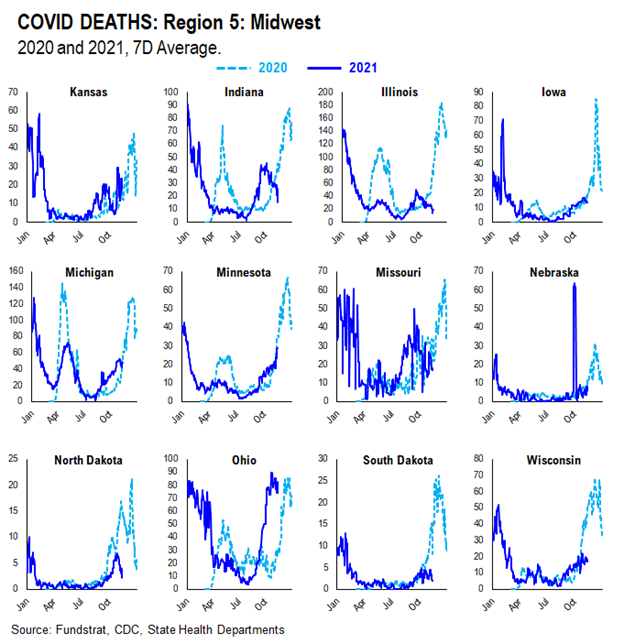
POINT 3: Tracking the seasonality of COVID-19
In July, we noted that many states experienced similar case surges in 2021 to the ones they experienced in 2020. As such, along with the introduction of the more transmissible Delta variant, seasonality also appears to play an important role in the recent surge in daily cases, hospitalization, and deaths. Therefore, we think there might be a strong argument that COVID-19 is poised to become a seasonal virus.
The possible explanations for the seasonality we observed are:
– Outdoor Temperature: increasing indoor activities in the South vs increasing outdoor activities in the northeast during the Summer
– “Air Conditioning” Season: similar to “outdoor temperature”, more “AC” usage might facilitate the spread of the virus indoors
If this holds true, seasonal analysis suggests that the Delta spike could roll over by following a similar pattern to 2020.
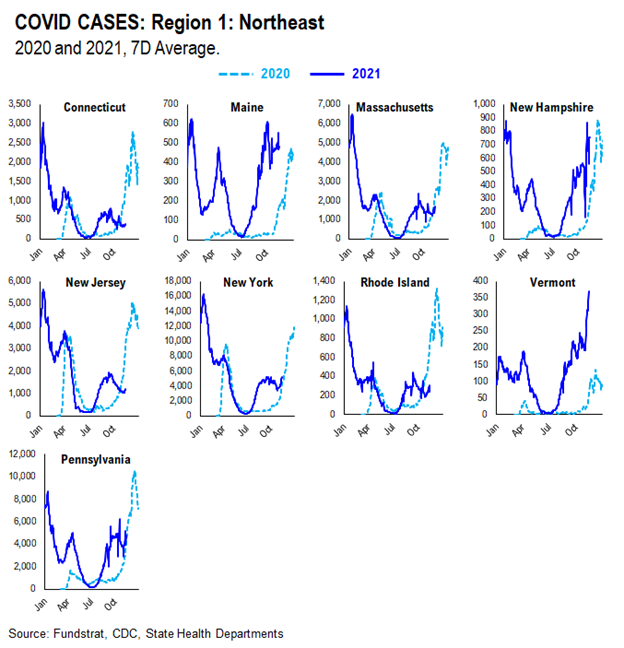
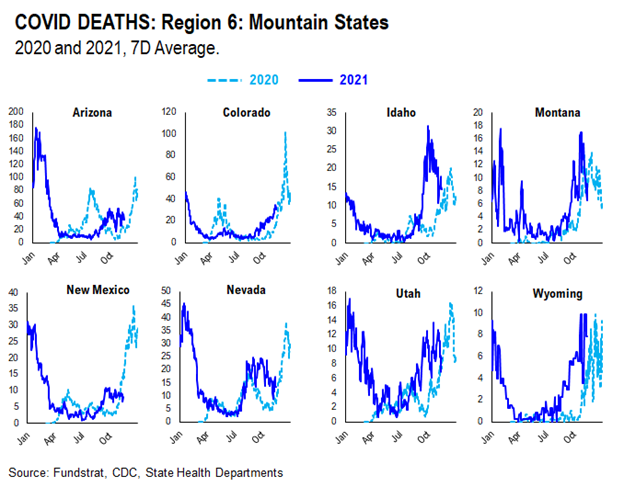
We created this section within our COVID update which tracks and compare the case, hospitalization, and death trends in both 2020 and 2021 at the state level. We grouped states geographically as they tend to trend similarly.
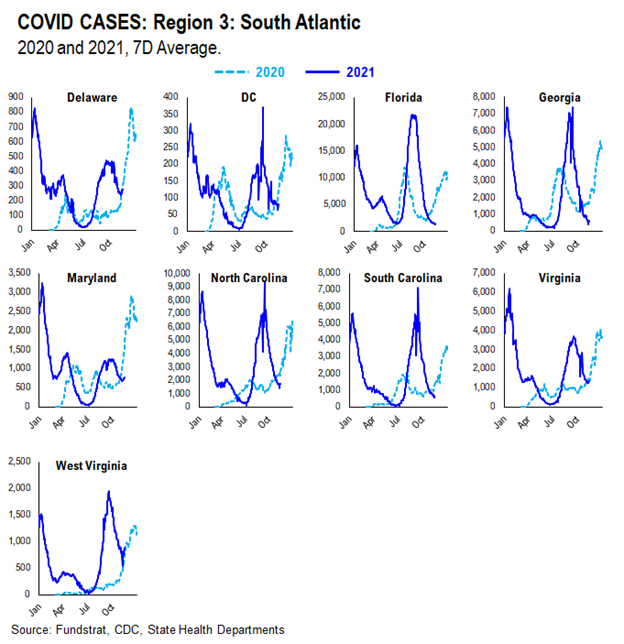
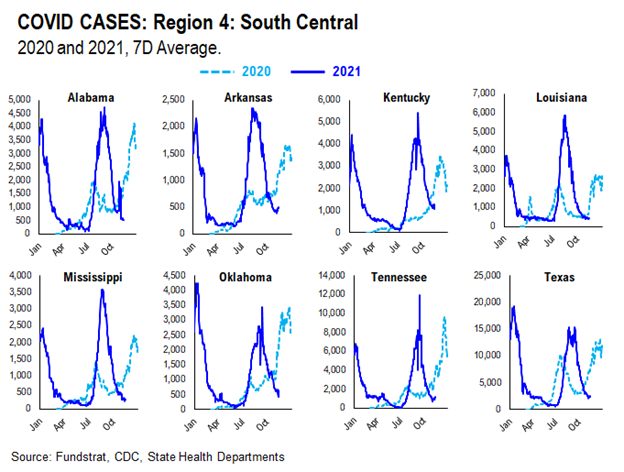
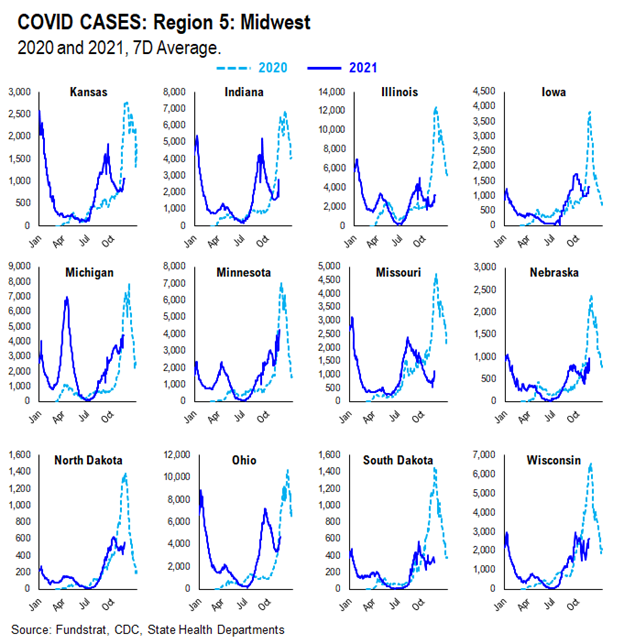
CASES
It seems as if the main factor contributing to current case trends right now is outdoor temperature. During the Summer, outdoor activities are generally increased in the northern states as the weather becomes nicer. In southern states, on the other hand, it becomes too hot and indoor activities are increased. As such, northern state cases didn’t spike much during Summer 2020 while southern state cases did. Currently, northern state cases are showing a slight spike, especially when compared to Summer 2020. This could be attributed to the introduction of the more transmissible Delta variant and the lifting of restrictions combined with pent up demand for indoor activities.
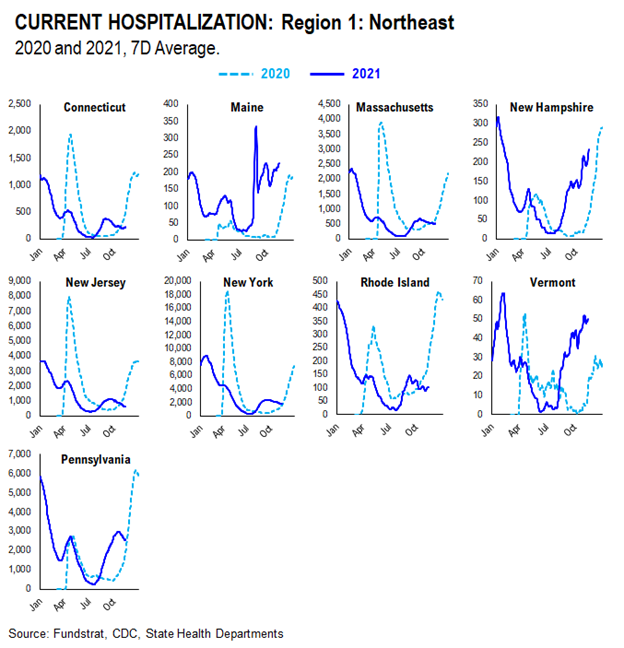
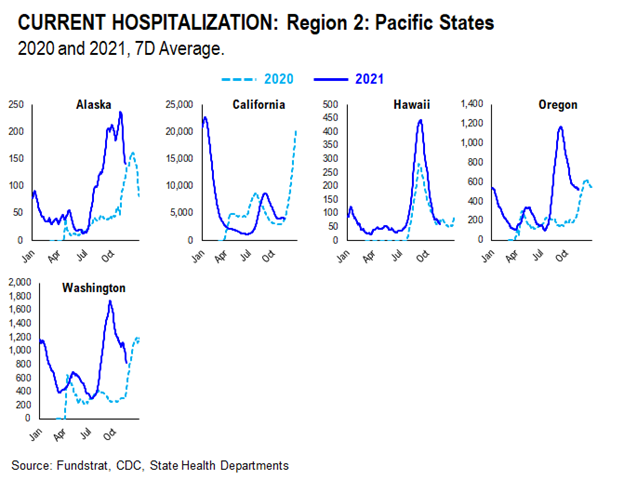
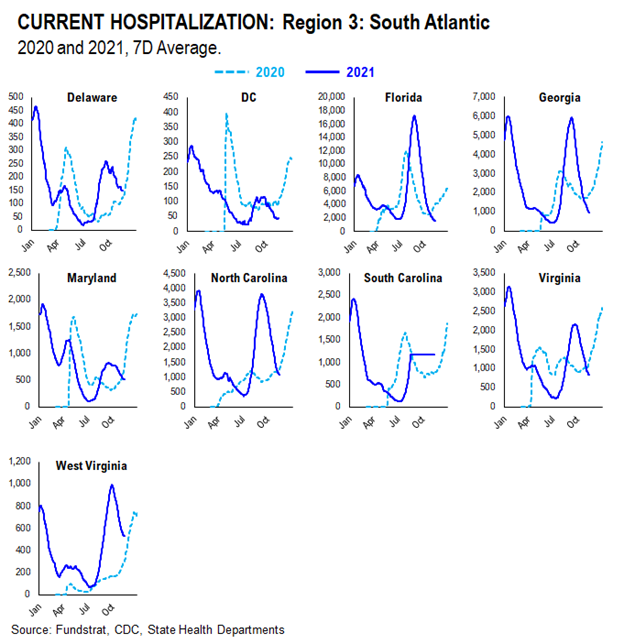
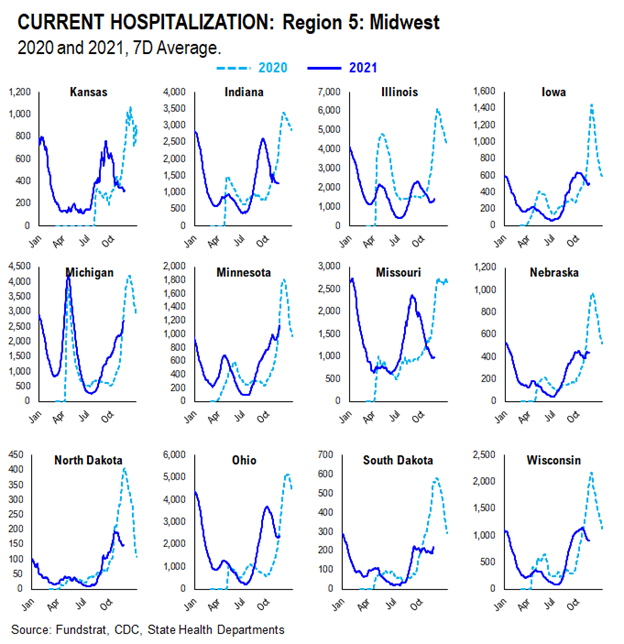
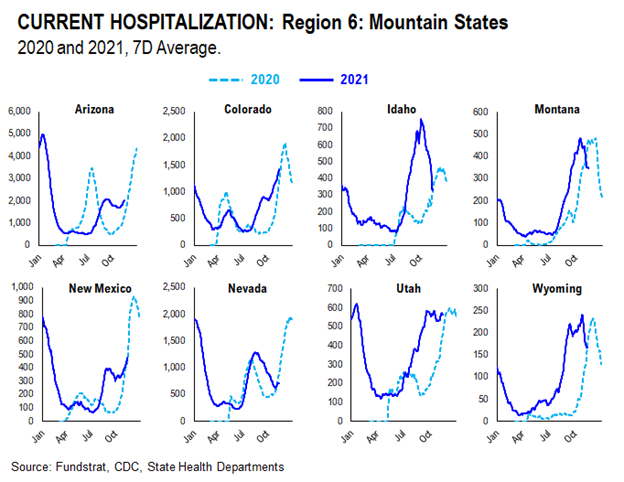
HOSPITALIZATION
Current hospitalizations appear to be similar or less than Summer 2020 rates in most states. This is likely due to increased vaccination rates and the vaccine’s ability to reduce the severity of the virus.
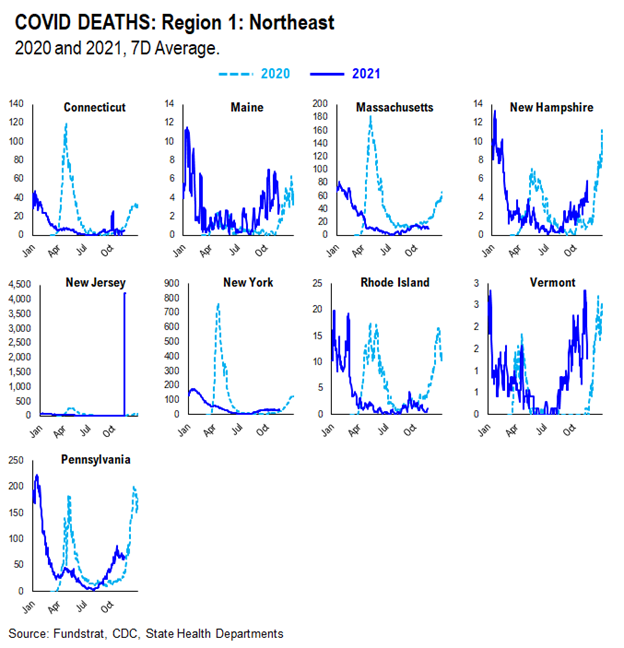
DEATHS
Current death rates appear to be scattered compared to 2020 rates. This is likely due to varying vaccination rates in each state. States with higher vaccination rates seem to have lower death rates given the vaccine’s ability to reduce the severity of the virus; states with lower vaccination rates seem to have higher death rates.
More from the author
Articles Read 1/2
🎁 Unlock 1 extra article by joining our Community!
Stay up to date with the latest articles. You’ll even get special recommendations weekly.
Already have an account? Sign In e69ed4-588217-88e2a0-e1f36d-8b7d9a
Already have an account? Sign In e69ed4-588217-88e2a0-e1f36d-8b7d9a

