As we exit the Labor Day/ Rosh Hashana distortion period, case trends emerging as good

Click HERE to access the FSInsight COVID-19 Daily Chartbook.
We are shifting to a 4-day a week publication schedule:
Monday
Tuesday
Wednesday
SKIP THURSDAY
Friday
STRATEGY: Still a question of Half-full or Half-empty
As we exit the Labor Day/ Rosh Hashana distortion period, case trends emerging as good
We are gradually exiting the distortion period stemming from Labor Day and to a lesser extent, Rosh Hashana/Yom Kippur. The distortion from Labor Day is the widespread closures leading to significant under-reporting and similarly Rosh Hashana. By the end of this week, we should be clear of most distortions:
– case trends, as highlighted, are generally improving
– Sunday case figures are generally light as 36 states did not report cases
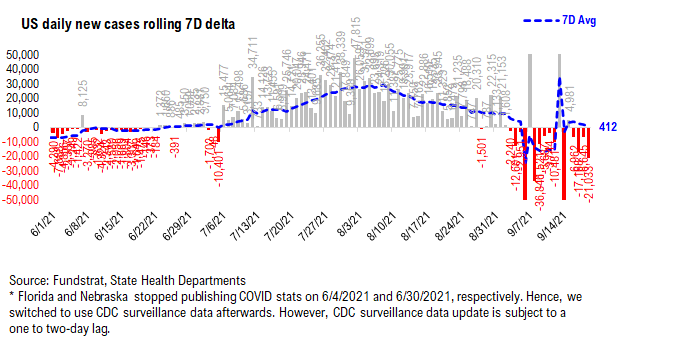
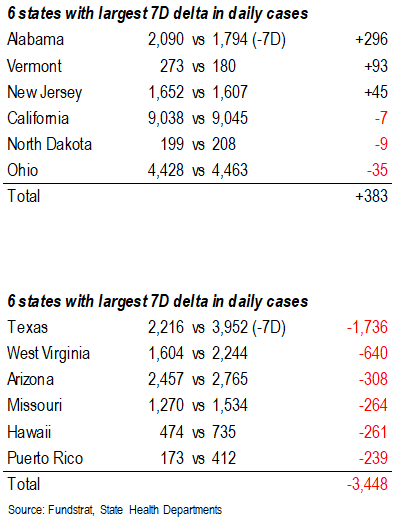
…7D delta shows that the Delta-variant parabolic rise seems to be ending
And as we look at the 7D trend, this distortion is more evident by the zig and zags. But as this chart shows, the last few days seem to be resuming the more normalized trend. And it paints a consistent picture that COVID-19 cases are no longer rising parabolically.
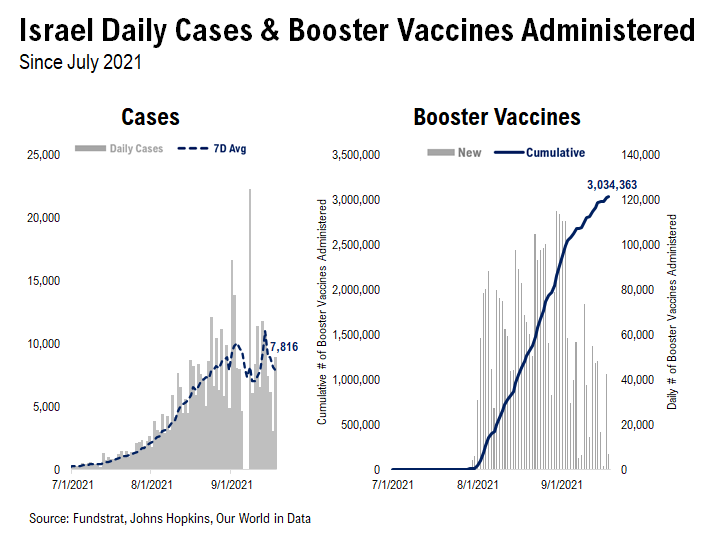
Similarly, the booster campaign in Israel seems to be defeating Delta variant. The case trends are generally looking improved in Israel. And the downturn seems to be gaining momentum. So this bears watching.
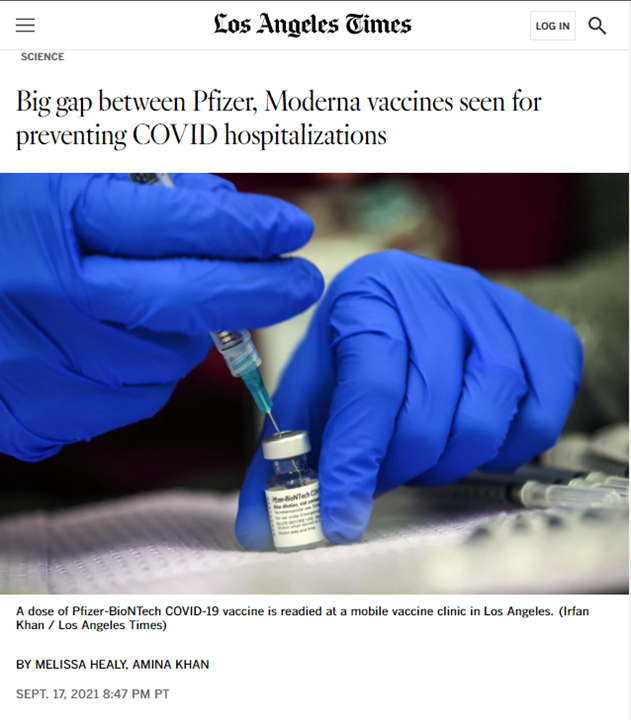
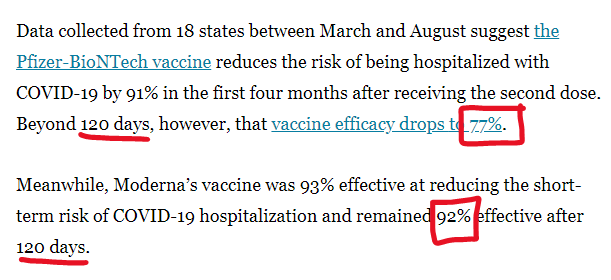
Latest CDC report shows after 120 days, Moderna reduces risk of hospitalizations by 92% vs 77% for Pfizer
The most recent report by the CDC shows that the gap between Moderna and Pfizer widens over time. The study collected data from 18 states and looked the risk of preventing hospitalizations:
– after 120 days
– Pfizer efficacy drops to 77% (vs 91% early)
– Moderna efficacy drops to 92% (vs 93% early)
As of the study date, 54% of vaccinated Americans received Pfizer’s vaccine. Given the debate around boosters for Americans, this is pertinent. At the moment, boosters for Americans > age 65 is approved. But experts believe the FDA will soon approve boosters for a broader set of Americans.
An optical illusion but applicable in the COVID-19 era…
I wanted to include in this Monday’s commentary a photo that sort of twisted my brain. This is titled “2011-07-12-Railway People” by Chuwa (Francis)”:
– at first glance, this photo appears to be in color
– it is actually a black and white photo
– but a grid of lines on top of the photo appear to give the photo color
Take a closer look, or zoom in, what appears to be a green shirt is actually grey, but with gridlines.

…Same “illusion” is taking place now and the feedback loop might amplify this effect
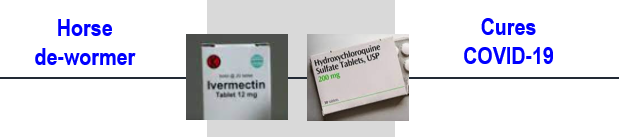
I am not a neuroscientist, but from what I read, the reason we perceive color, is our brain is essentially filling in the blanks. Or as many like to say, “connecting the dots” – but in the COVID-19 era – there remains a strong possibility that the dots connect on the opposite sides of the ledger. Perhaps the most striking example to me is the debate around Hydroxychloroquine and also Ivermectin.
– the media refers to Ivermectin as “horse de-wormer”
– by contrast, many believe it can be a COVID-19 therapeutic
I don’t have a view on this. There are many studies on both sides, so this one where one chooses to connect the dots.
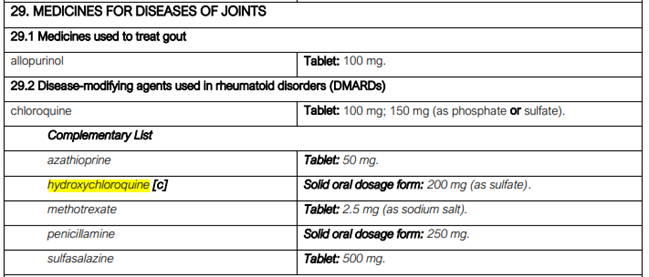
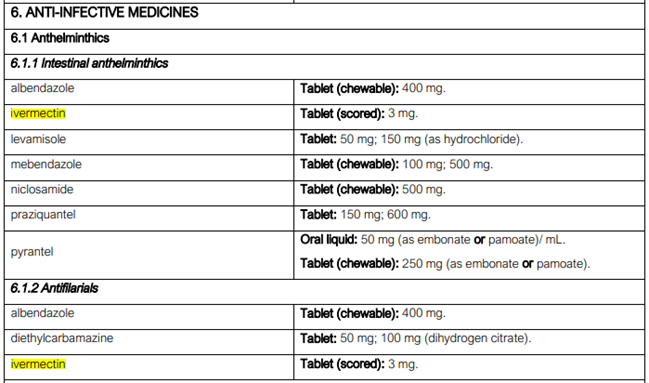
However, before someone starts maligning HCQ and Ivermectic as pure rubbish and dangerous, keep in mind that both are listed as “Essential medicines” by the WHO. Both on that list for more than 10 years.
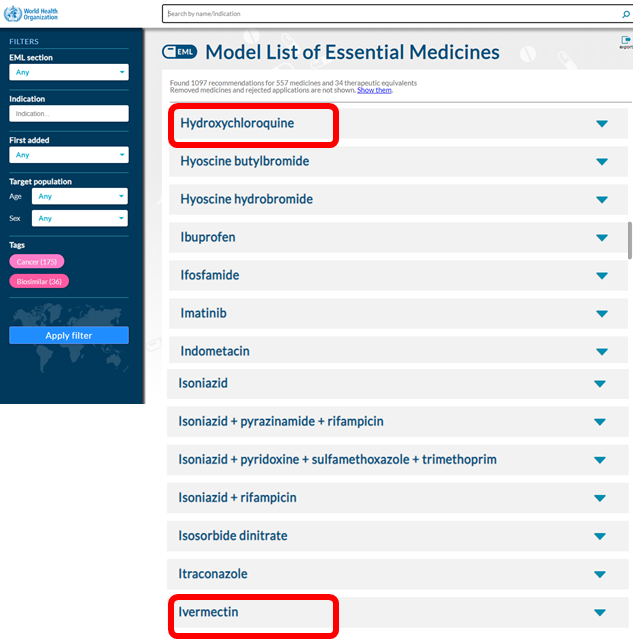
– HCQ is used as an anti-malarial and even considered for use against rheumatoid disorders.
– Ivermectin is considered an effective anti-viral
In other words, the characterizations of Ivermectin as “horse de-wormer” is not entirely appropriate. But at the same breath, this does not mean this is a proven therapeutic for COVID-19. See what I mean?
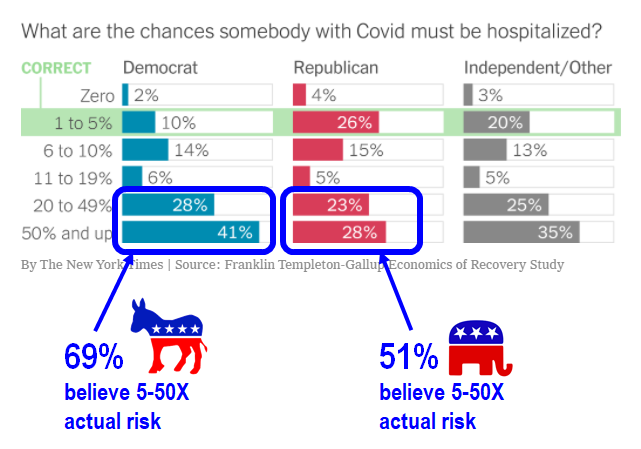
ILLUSION: Risk of being hospitalized from COVID-19 is 1%-5% of infected but majority Americans see 5-50X that
Another example of an extreme view, is the risk of being hospitalized once infected with COVID-19. Based on the cumulative data from CDC:
– once infected, risk of hospitalization <5%
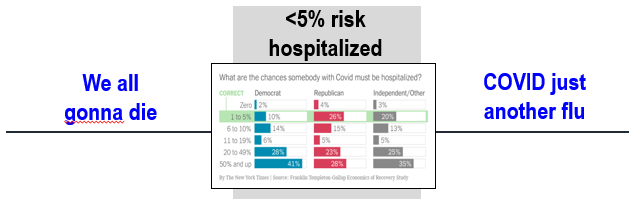
But the perception of the risk from COVID-19 is actually far different. The survey results below are taken from the NY Times and based on Gallup Poll results. This is looking at the results based upon political party affiliation:
– both Democrats and Republicans far over-estimate the risk from COVID-19
– 69% of Democrats believe risk of hospitalization is 5X-50X higher than true risk
– 51% of Republicans believe risk is 5X-50X higher than true risk
– both are wrong
– more Democrats are making this gross error
I have no idea why this is happening but it seems to me to be the combination of media coverage, social media misinformation, pandemic/horror films and perhaps the general disposition for Americans to be extreme.
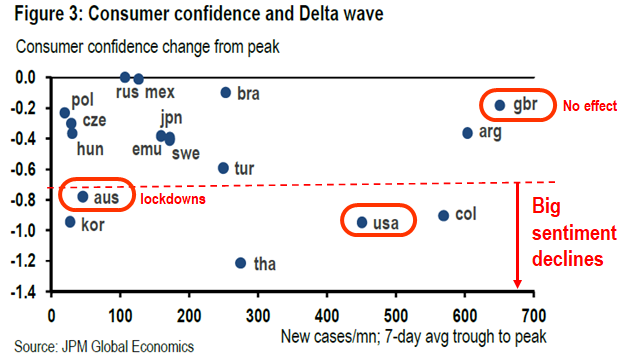
GLOBAL: Collapse in US consumer confidence disproportionate to COVID-19 case rise
A chart by JPMorgan Economists really helps illustrate this “seeing colors” might be more of an “American” thing. The chart below compares two things:
– rise in daily cases/1mm residents
– change in consumer confidence since peak
I have compared the 3 nations that speak native English and generally have cultures similar to the USA:
– UK saw drastic surge in cases, but essentially no change in consumer confidence
– USA case rise is lower, but has one of the worst global drops in consumer confidence
– Australia saw a disproportionate drop in confidence, but this is due to the severe lockdowns
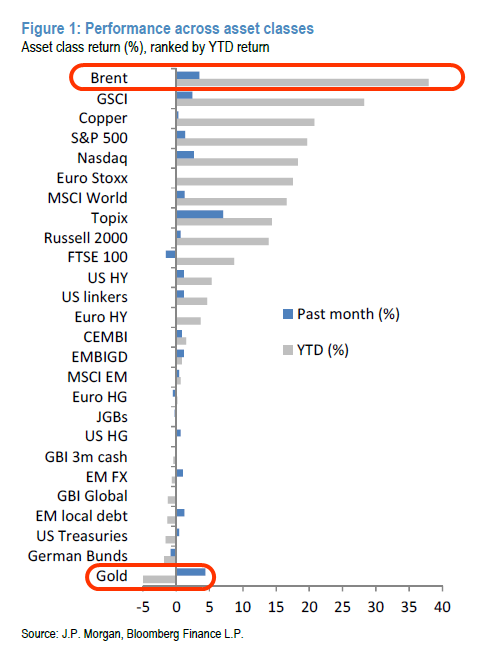
STRATEGY: Equity markets seem far more pessimistic than commodity or credit markets
Equities continue to be choppy and in our conversations with clients over the past week, we have noticed investors have become quite wary and hesitant. The turmoil in markets and the rise in the VIX are obvious contributing factors. But taking a step back, the rising apprehension certainly appears strong in equities than in credit or commodities:
– US 10-yr yield rose from 1.33% to 1.36% in the past 5 days
– WTI Crude oil from from $69.70 to $71.69 in the past 5 days
So, both markets seem to be pointing to a reflationary environment. And that suggests we should be taking a more “half-full” view on incoming economic data. And even taking a step back, we can see that YTD, oil remains the king and best performing asset class:
– Oil and copper are among the best performers YTD
– gold is worst performer –> underscores that calamity risk is diminished
Are the relatively more muted views – from equity markets – reflecting the bifurcation of how Americans feel about COVID-19 and the future? The intuitive answer is yes. And to the extent that consumers remain cautious, the key is differentiating how much of the consumer caution is a permanent versus a transitory impact:
– if these headwinds are transitory, then the rebound in sentiment will be strong
– stocks react to rate of change. So a recovery in confidence should positively impact stocks
Historically, markets anticipate these changes and inflections. But it seems like investors have become less willing recently.
BOTTOM LINE: We think stocks are washed out and emerging from “quad witching”
Our central view remains that stocks will exit the moth with gains. The S&P 500 has experienced a rough two weeks and is now down 2% for the month. While not a horrible month so far, with roughly 9 trading days left, the key divergence remains:
– bonds and oil are signaling economic strength
– equities have been weak
And in the larger fractal, the US is one-year into an expansion:
– There remains substantial pent-up consumer demand
– And strong corporate balance sheets and pent-up capex.
– Add in the tailwinds from fiscal support.
– And given the sizable consumer cash balances for consumers and the cash on sidelines for investors.
– And Fed remains dovish.
And this paints a constructive picture.
Granted, there are short term headwinds such as weak consumer confidence. And headwinds from Washington. But does it make sense to be bearish and cautious here? Especially with the S&P 500 touching its 50-day moving average?
__________________________
26 Granny Shot Ideas:
26 Granny Shot Ideas: We performed our quarterly rebalance on 07/30. Full stock list here –> Click here
___________________________
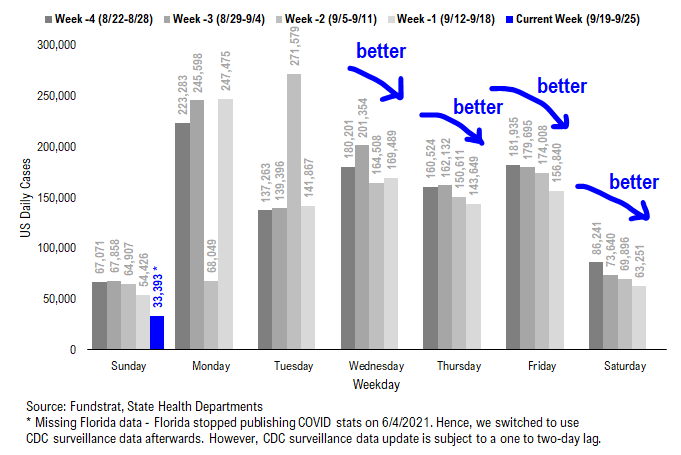
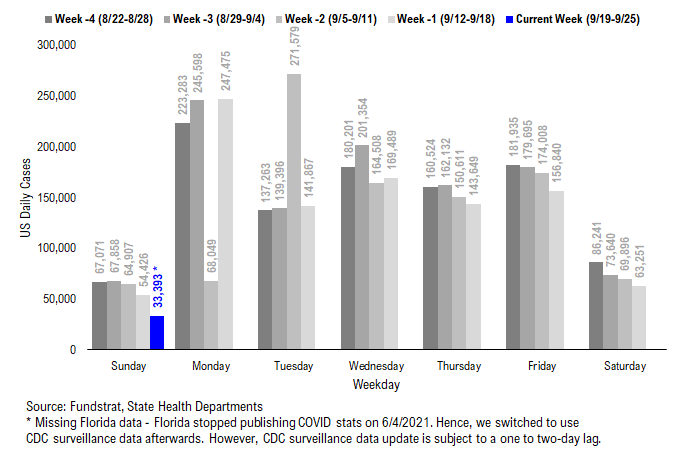
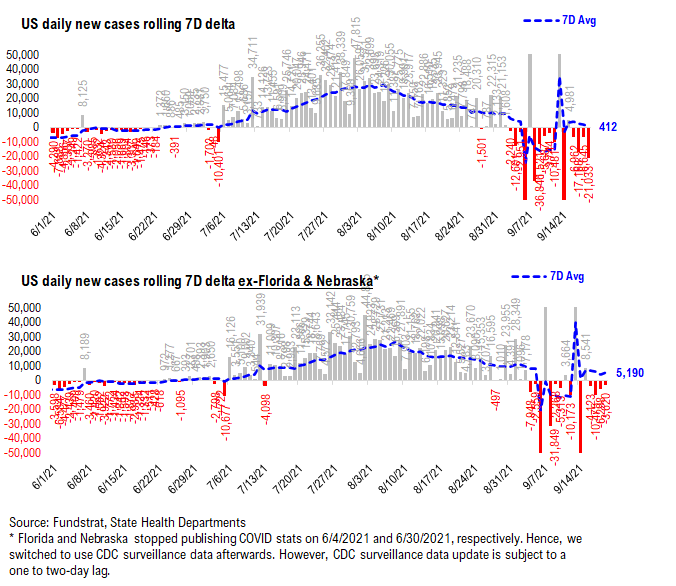
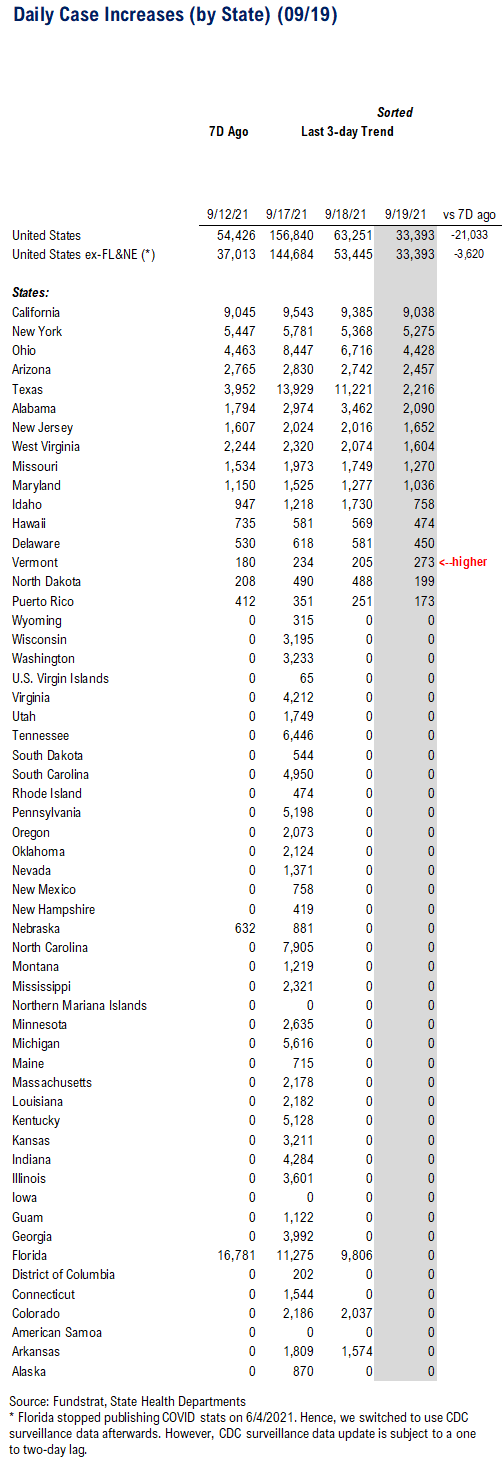
POINT 1: Daily COVID-19 cases 33,393, down -21,033 vs 7D ago…
_____________________________
Current Trends — COVID-19 cases:
– Daily cases 33,393 vs 54,426 7D ago, down -21,033
– Daily cases ex-FL&NE 33,393 vs 37,013 7D ago, down -3,620
– 7D positivity rate 7.3% vs 7.8% 7D ago
– Hospitalized patients 85,559, down -8.9% vs 7D ago
– Daily deaths 2,063, up +27.5% vs 7D ago
_____________________________
*** Florida and Nebraska stopped publishing daily COVID stats updates on 6/4 and 6/30, respectively. We switched to use CDC surveillance data as the substitute. However, since CDC surveillance data is subject to a one-to-two day lag, we added a “US ex-FL&NE” in our daily cases and 7D delta sections in order to demonstrate a more comparable COVID development.
The latest COVID daily cases came in at 33,393, down -21,033 vs 7D ago. This week’s data is still distorted due to Labor Day. We expect the distortion to clear out on Wednesday. Nonetheless, the average 7D delta since Labor Day is negative, suggesting that cases are rolling over.
We’ve recently been at the critical stage of case rollover for many states. All states that had been falsely rolling over are beginning to roll over again. We will continue to monitor all relevant data closely, but as long as 7D deltas remain negative, case rollover will continue.
Rolling 7D delta in daily cases is positive due to distortion…
As shown in the chart below, the rolling 7D delta in daily cases is currently positive due to Labor Day distortion. We expect the distortion to clear out and for the rolling 7D delta to turn consistently negative on Wednesday.
Tuesday’s negative rolling 7D delta suggests that cases appear to be rolling over despite the distortion. We will continue to monitor all relevant data closely, but as long as 7D deltas remain negative, case rollover will continue.
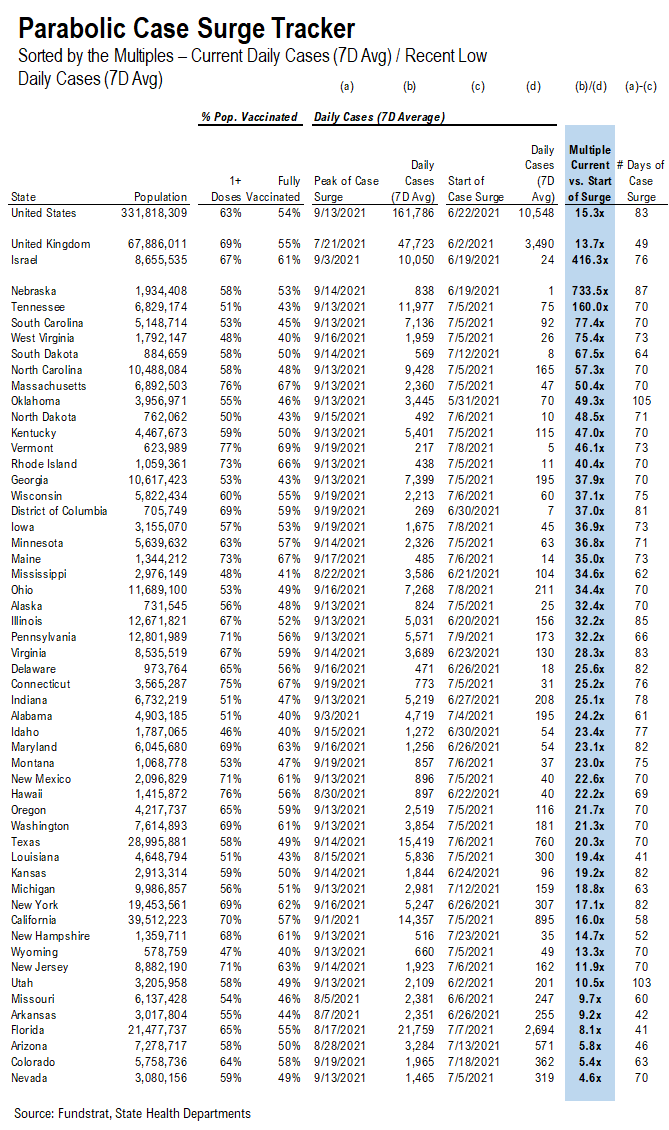
Low vaccinated states seem to have a larger increase in daily cases compared to their recent low…
The “Parabolic Case Surge Tracker” monitors the possible parabolic surge in daily case figures. In the table, we included both the vaccine penetration and the recent case trend for 50 US states + DC. The table is sorted by the multiple of their recent peak daily cases divided by the daily cases when their case surges started.
– The states with higher ranks are the states that have seen a more significant rise in daily cases
– We also calculated the number of days during the recent case surge; a state with a high multiple but low number of days since its low means the state is facing a relatively rapid surge in daily cases
– The US as a whole, UK, and Israel are also shown at the top as a reference
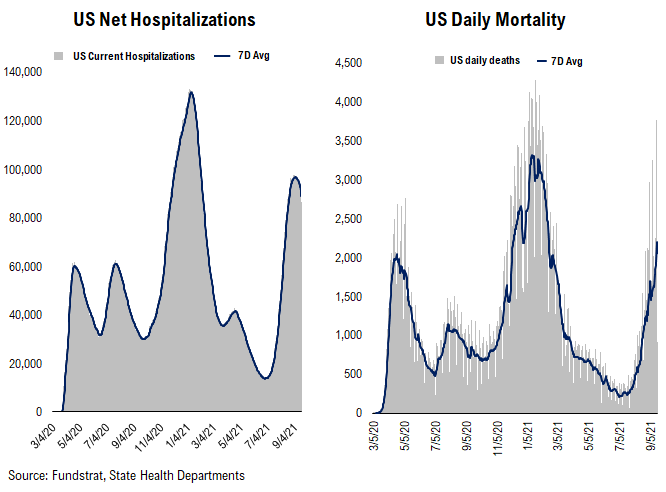
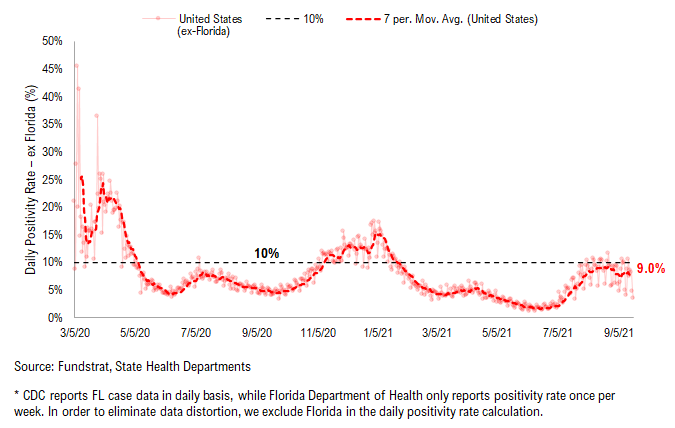
Hospitalization continues rising, while positivity rate has plateaued… Daily deaths also start to surge now…
Below we show the aggregate number of patients hospitalized due to COVID, daily mortality associated with COVID, and the daily positivity rate for COVID.
– Hospitalization has exceeded the peak level we’ve seen in Wave 1 and 2 in 2020 and continues surging.
– With the increasing number of daily tests, positivity rate has plateaued over the past week. As daily cases have already start to roll over in some states, the positivity rate could roll over soon.
– Daily deaths have been surging recently, but less “dramatic” than the cases or hospitalization trends. Currently, daily death has surpassed the peak we have seen in Wave 2.
POINT 2: VACCINE: vaccination pace has been steadily rising…
_____________________________
Current Trends — Vaccinations:
– avg 0.8 million this past week vs 0.7 million last week
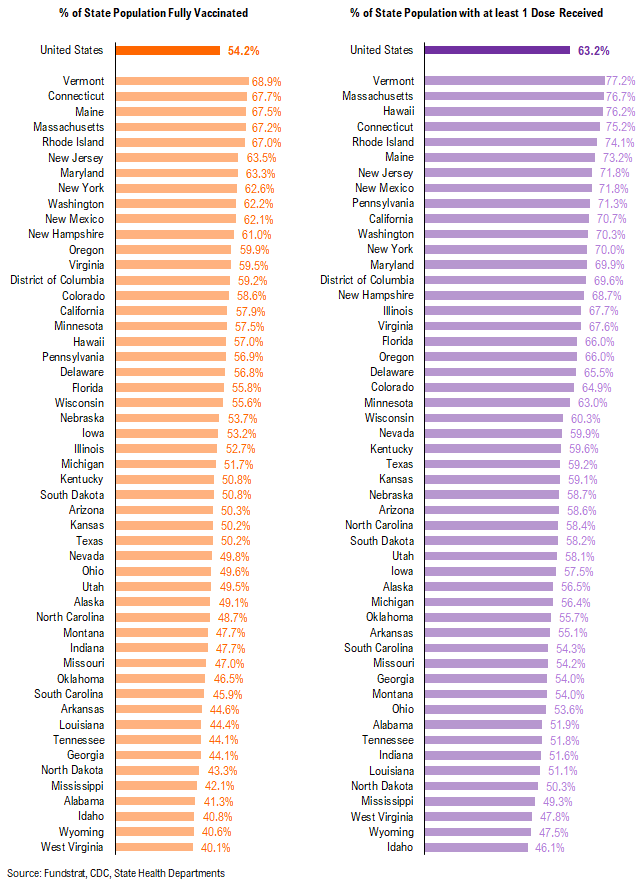
– overall, 54.2% fully vaccinated, 63.2% 1-dose+ received
_____________________________
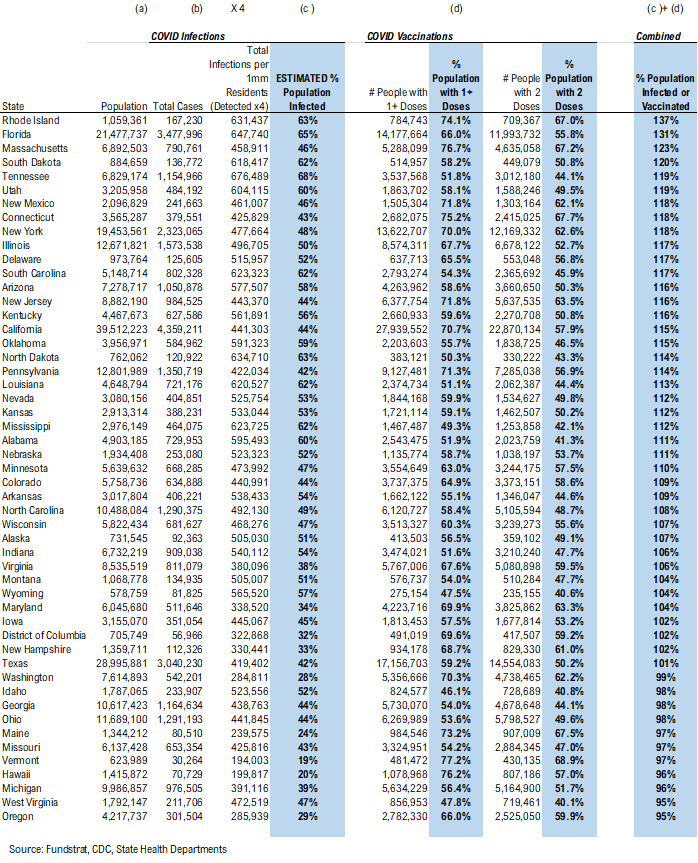
Vaccination frontier update –> all states now near or above 90% combined penetration (vaccines + infections)
Below we sorted the states by the combined penetration (vaccinations + infections). The assumption is that a state with higher combined penetration is likely to be closer to herd immunity, and therefore, less likely to see a parabolic surge in daily cases and deaths. Please note that this “combined penetration” metric can be over 100%, as infected people could also be vaccinated (actually recommended by CDC).
– Currently, all states are near or above 90% combined penetration
– RI, MA, FL, CT, SD, NJ, IL, NY, DE, NM, UT, PA, ND, NV, KY, ND, CO, KS, TN, OK, WI, SC, AZ, MN, CA, NE, LA, DC, MT, AK, MD, ID, VI, AR, AL, MS, and NC are now above 100% combined penetration (vaccines + infections). Again, this metric can be over 100%, as infected people could also be vaccinated. But 100% combined penetration does not mean that the entire population within each state is either infected or vaccinated.
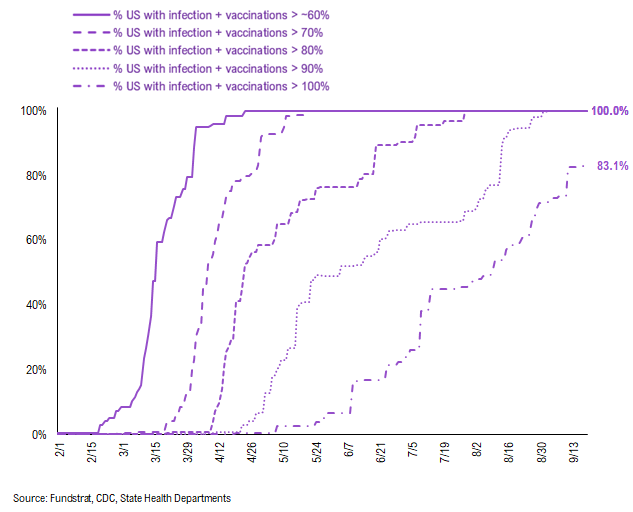
Below is a diffusion chart that shows the % of US states (based on state population) that have reached the combined penetration > 60%/70%/80%/90%/100%. As you can see, all states have reached 90% combined vaccination + infection. 83.1% of US states (based on state population) have seen combined infection & vaccination > 100% (Reminder: this metric can be over 100%, as infected people could also be vaccinated. But 100% combined penetration does not mean that the entire population within the state is either infected or vaccinated).
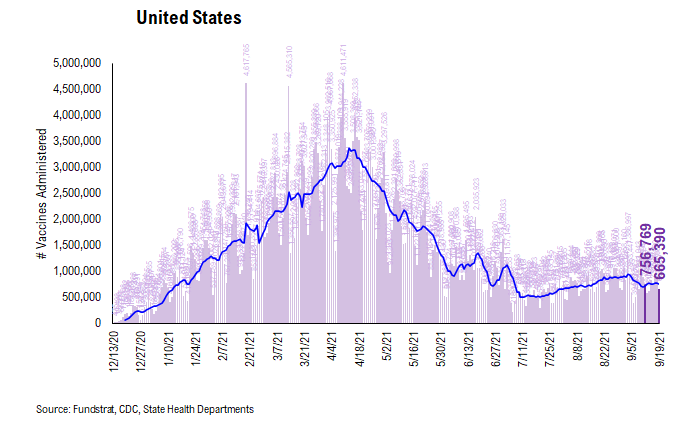
There were a total of 665,390 doses administered reported on Monday, down -14% vs. 7D ago. As more people are getting vaccinated, the vaccination trend is beginning to flatten out. Nonetheless, we believe many catalysts could push the vaccination pace even higher.
– Proof of vaccination required by many US cities and venues
– Booster shots
– Full FDA approval of Pfizer COVID vaccines (hopefully it could help overcome vaccine hesitancy)
– Biden’s vaccination plan
The daily number of vaccines administered remains the most important metric to track this progress and we will be closely watching the relevant data.
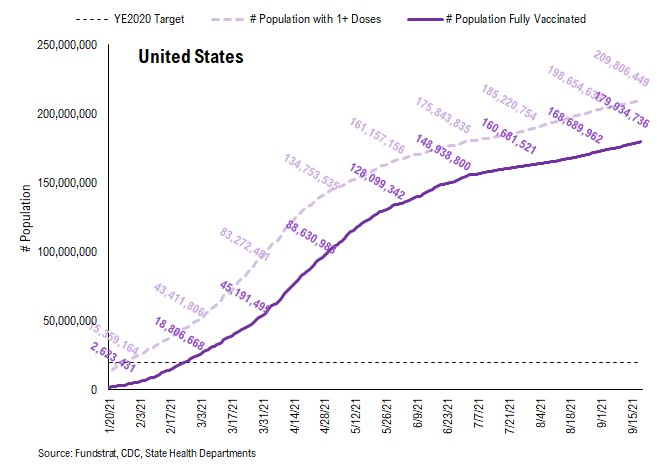
54.8% of the US has seen 1-dose penetration > 60%…
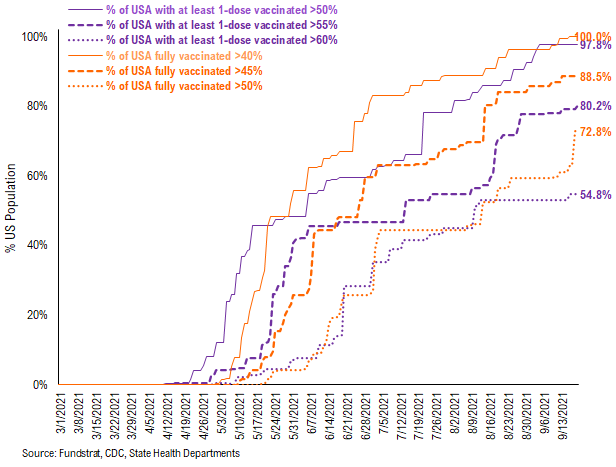
To better illustrate the actual footprint of the US vaccination effort, we have a time series showing the percent of the US with at least 45%/45%/50% of its residents fully vaccinated, displayed as the orange lines on the chart. Currently, 100% of US states have seen 40% of their residents fully vaccinated. However, when looking at the percentage of the US with at least 45% of its residents fully vaccinated, this figure is 88.5%. And only 72.8% of US (by state population) have seen 50% of its residents fully vaccinated.
We have done similarly for residents with at least 1-dose of the vaccination, denoted by the purple lines on the chart. While 97.8% of US states have seen 1 dose penetration > 50%, 80.2% of them have seen 1 dose penetration > 55% and 54.8% of them have seen 1 dose penetration > 60%.
This is the state by state data below, showing information for individuals with one dose and two doses.
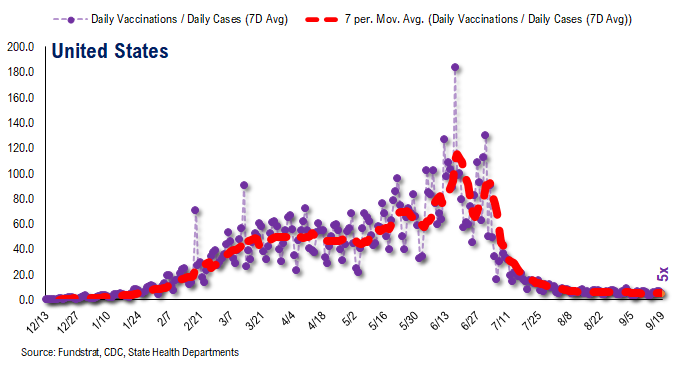
The ratio of vaccinations/ daily confirmed cases has been falling significantly (red line is 7D moving avg). Both the surge in daily cases and decrease in daily vaccines administered contributed to this.
– the 7D moving average is about ~5 for the past few days
– this means 6 vaccines dosed for every 1 confirmed case
In total, 390 million vaccine doses have been administered across the country. Specifically, 210 million Americans (64% of US population) have received at least 1 dose of the vaccine. And 180 million Americans (55% of US population) are fully vaccinated.
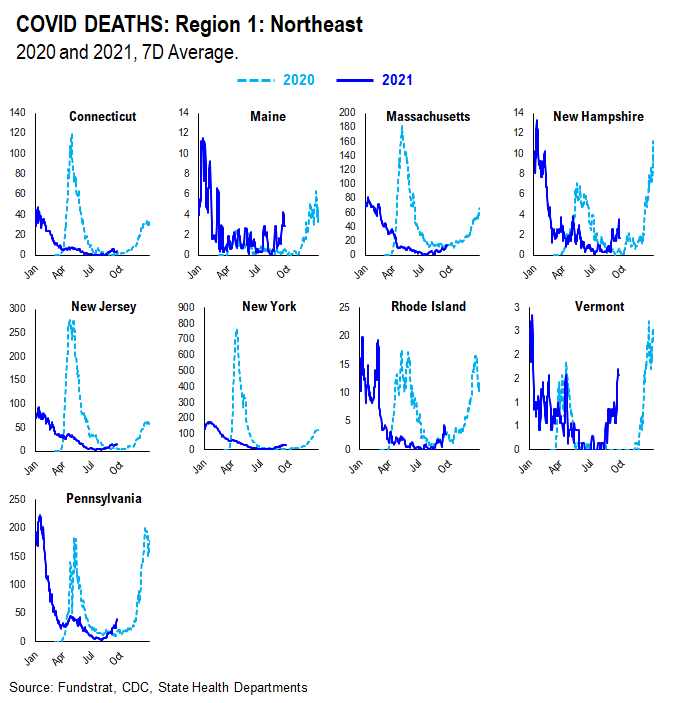
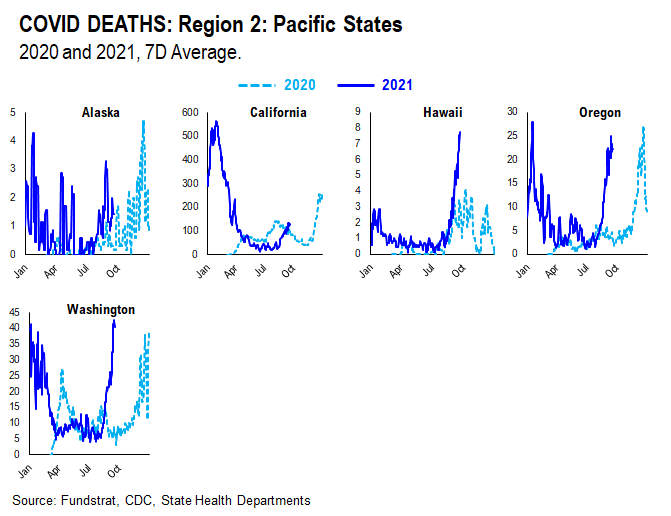
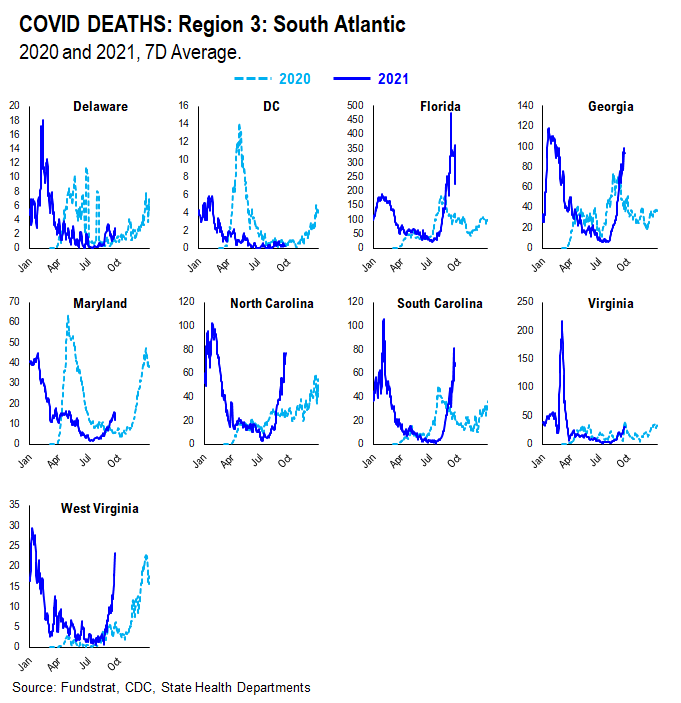
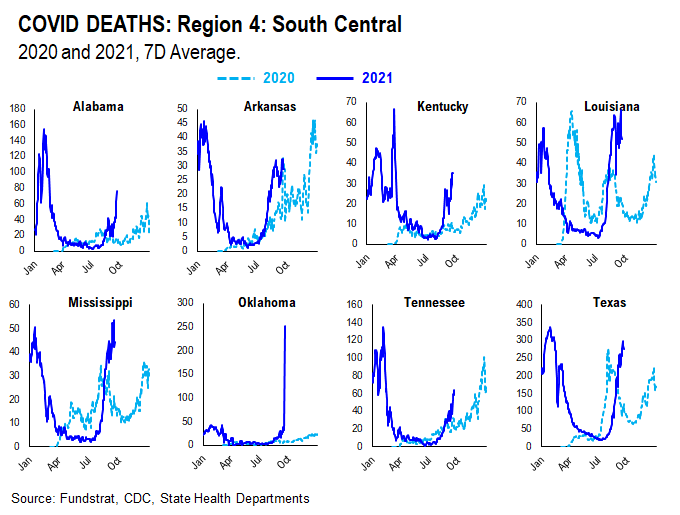
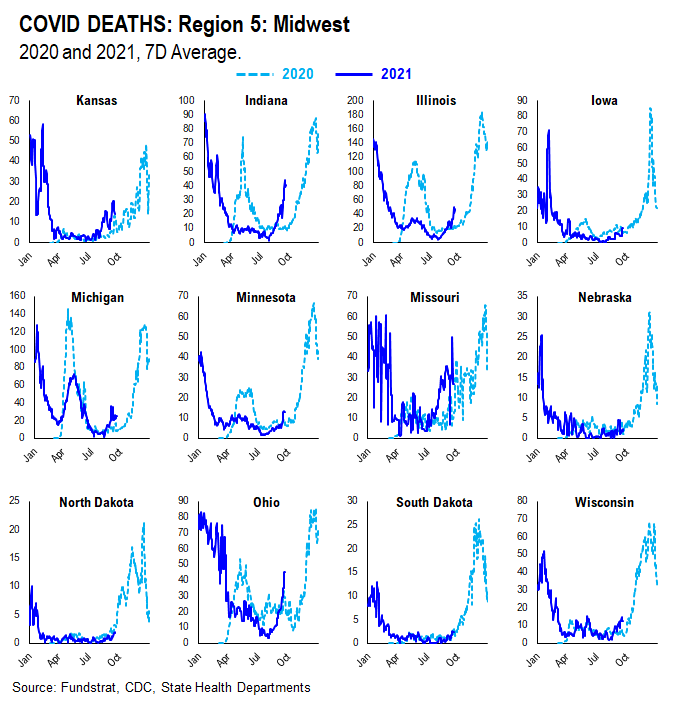
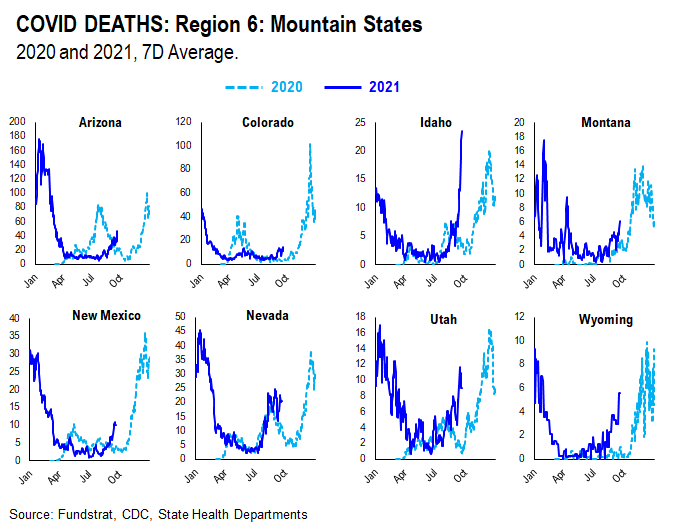
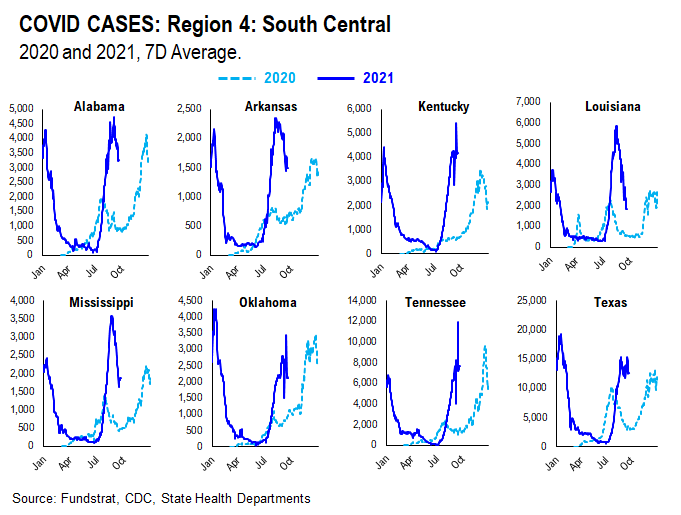
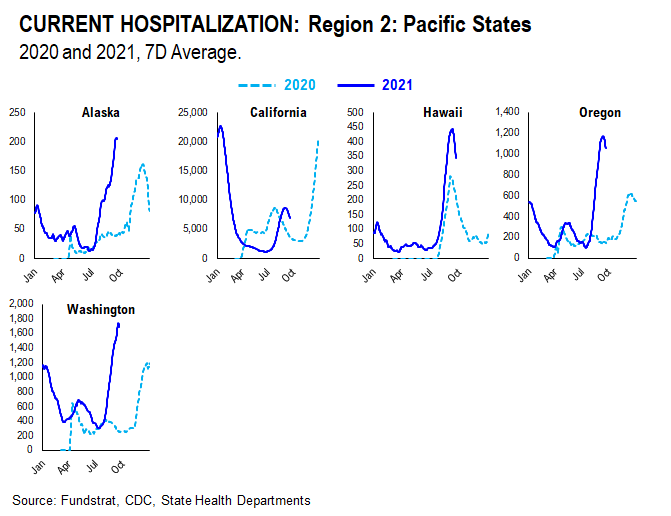
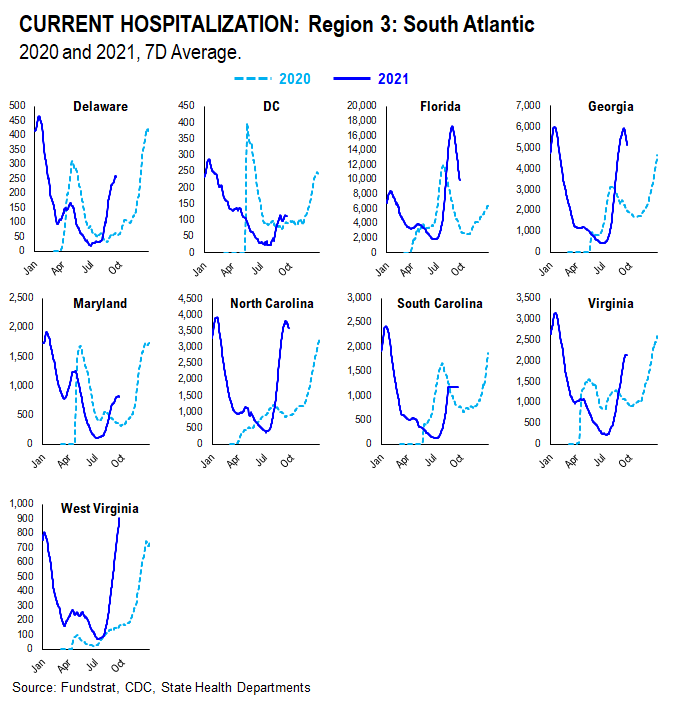
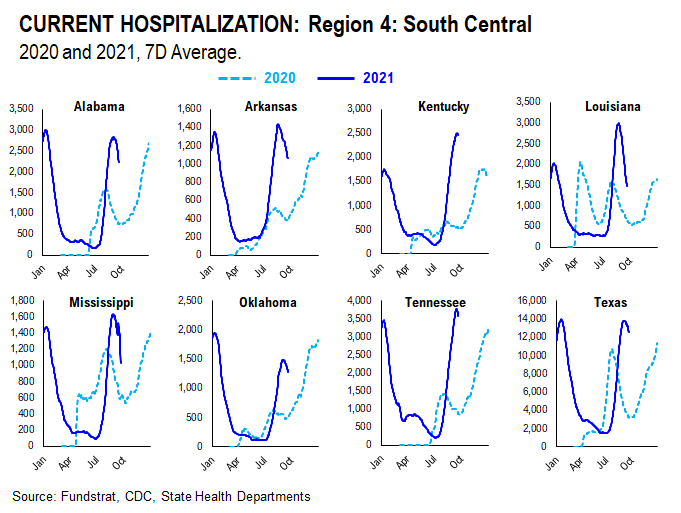
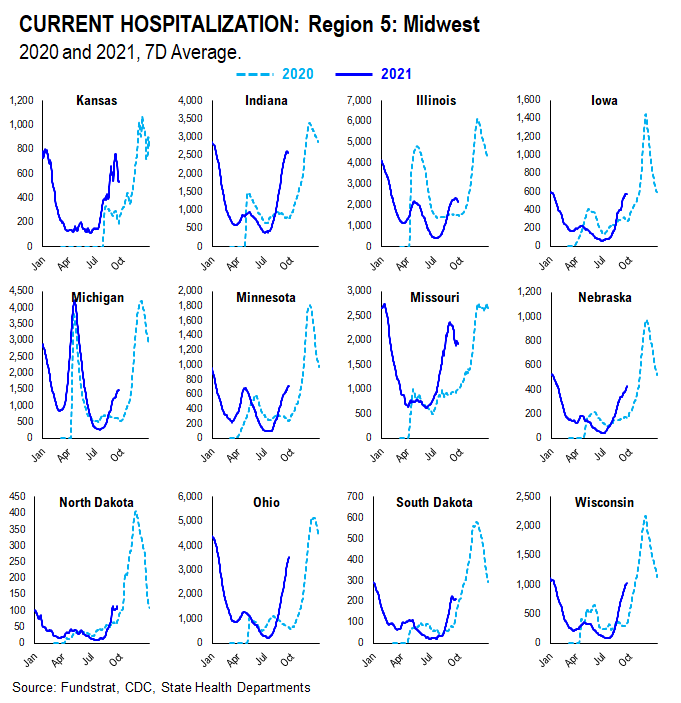
POINT 3: Tracking the seasonality of COVID-19
In July, we noted that many states experienced similar case surges in 2021 to the ones they experienced in 2020. As such, along with the introduction of the more transmissible Delta variant, seasonality also appears to play an important role in the recent surge in daily cases, hospitalization, and deaths. Therefore, we think there might be a strong argument that COVID-19 is poised to become a seasonal virus.
The possible explanations for the seasonality we observed are:
– Outdoor Temperature: increasing indoor activities in the South vs increasing outdoor activities in the northeast during the Summer
– “Air Conditioning” Season: similar to “outdoor temperature”, more “AC” usage might facilitate the spread of the virus indoors
If this holds true, seasonal analysis suggests that the Delta spike could roll over by following a similar pattern to 2020.
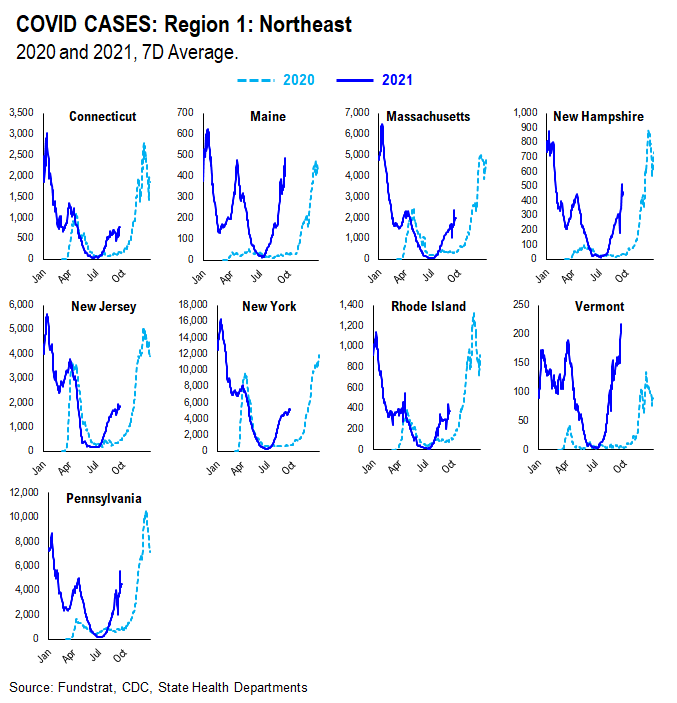
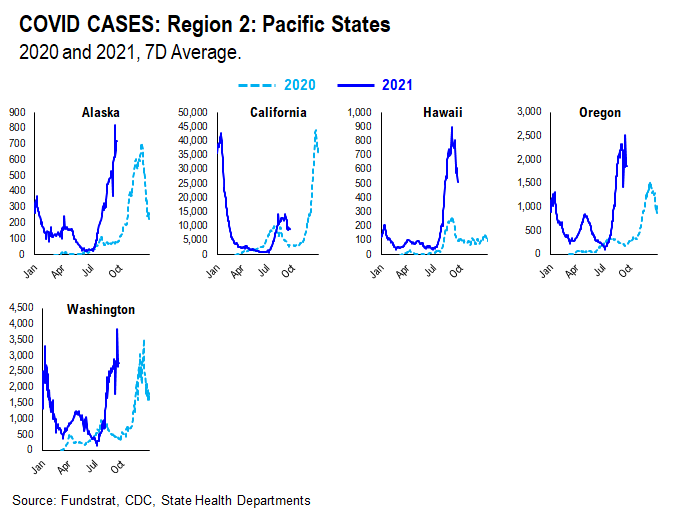
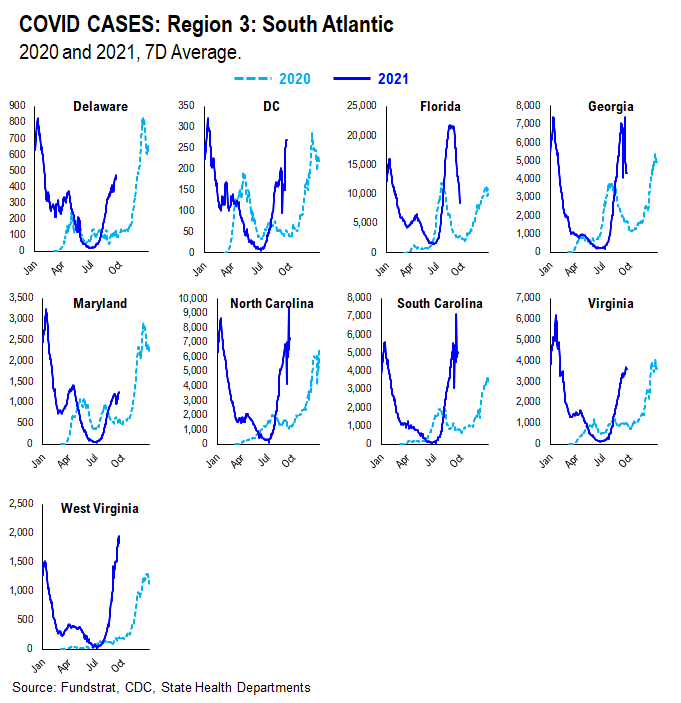
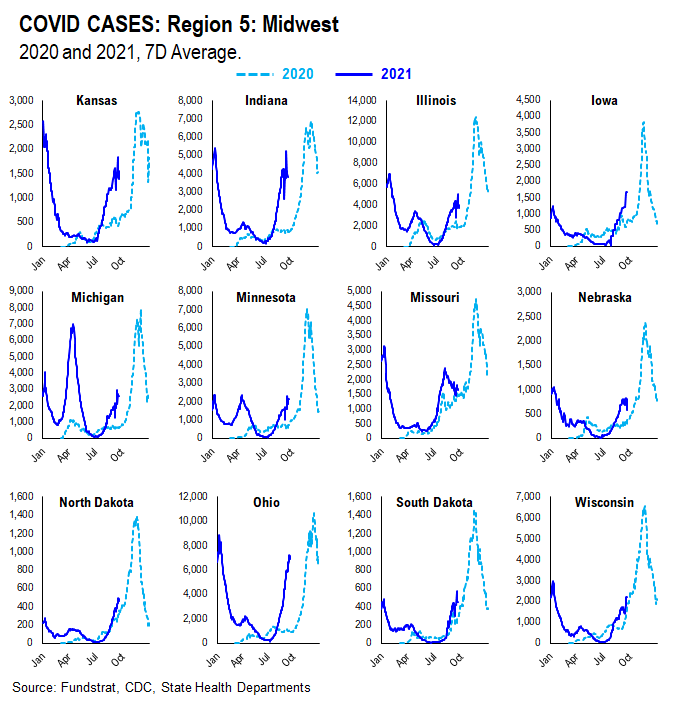
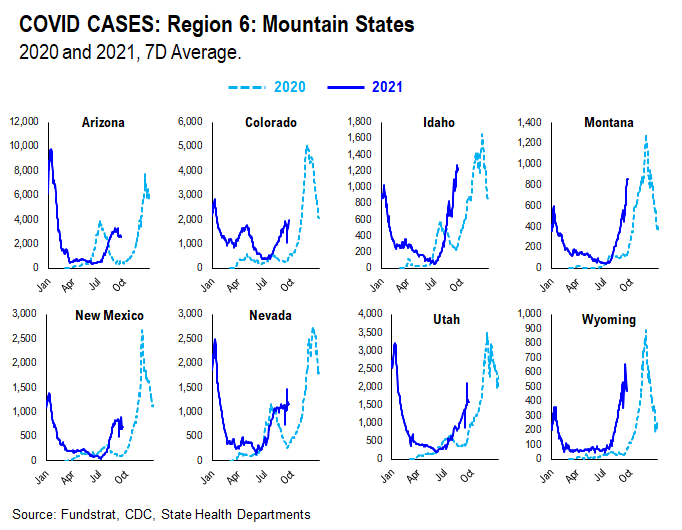
We created this section within our COVID update which tracks and compare the case, hospitalization, and death trends in both 2020 and 2021 at the state level. We grouped states geographically as they tend to trend similarly.
CASES
It seems as if the main factor contributing to current case trends right now is outdoor temperature. During the Summer, outdoor activities are generally increased in the northern states as the weather becomes nicer. In southern states, on the other hand, it becomes too hot and indoor activities are increased. As such, northern state cases didn’t spike much during Summer 2020 while southern state cases did. Currently, northern state cases are showing a slight spike, especially when compared to Summer 2020. This could be attributed to the introduction of the more transmissible Delta variant and the lifting of restrictions combined with pent up demand for indoor activities.
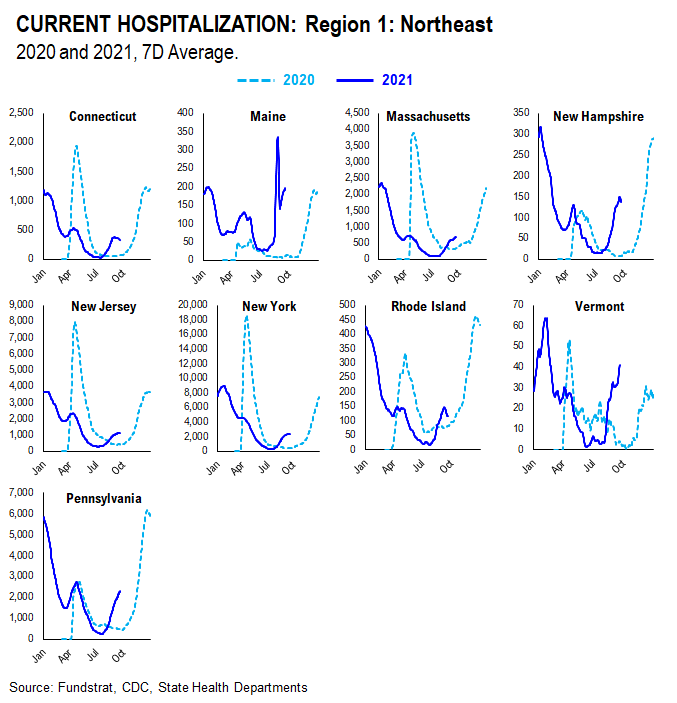
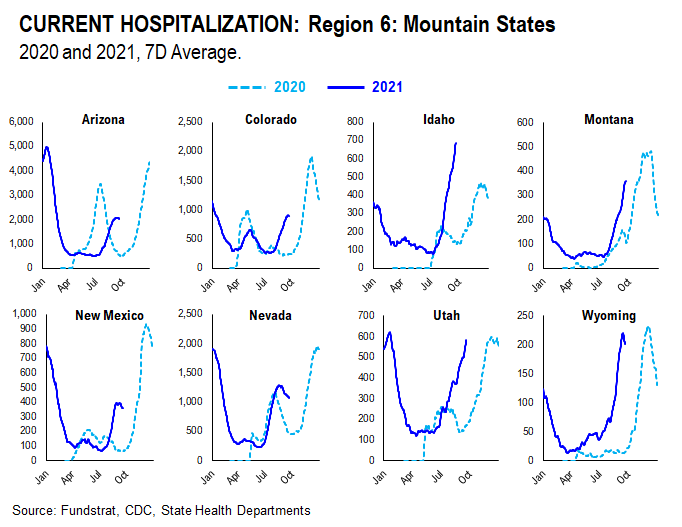
HOSPITALIZATION
Current hospitalizations appear to be similar or less than Summer 2020 rates in most states. This is likely due to increased vaccination rates and the vaccine’s ability to reduce the severity of the virus.
DEATHS
Current death rates appear to be scattered compared to 2020 rates. This is likely due to varying vaccination rates in each state. States with higher vaccination rates seem to have lower death rates given the vaccine’s ability to reduce the severity of the virus; states with lower vaccination rates seem to have higher death rates.