


An est. $800 billion capital gains taxes paid by 4/18/2022 = selling pressure alleviating later this week?

We publish on a 3-day a week schedule:
Monday
SKIP TUESDAY
Wednesday
SKIP THURSDAY
Friday
Monday April 18th is tax day, and for many investors, it is a painful day
Monday April 18th is the IRS regular tax filing deadline. And for those taxpayers with capital gains, a painful day for the wallet. We believe tax day this year could be particularly painful for most Americans, because of 3 factors:
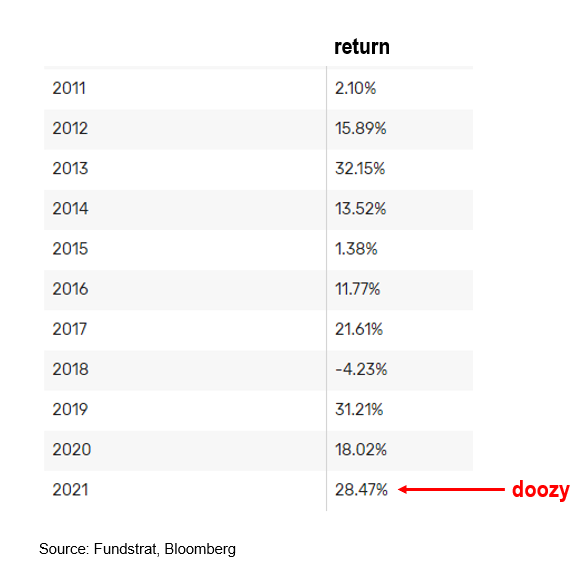
- 2021 equity returns were exceptional, with S&P 500 rising 29%, 3 consecutive years of ~20%-plus gains
- Equity ownership in USA is the among the highest ever
- Crypto taxable gains are being more carefully checked by IRS and crypto market grew by >$1 trillion in 2021 = big tax bite
On equity, returns up ~20%-plus for 3 consecutive years means investors have substantial capital gains and likely few capital losses. Thus the tax bite is higher. And the pain is wider spread because household ownership of equities is greater (more Americans) and the share of total wealth is high as well.
…IRS Statistics of Income shows capital gains (latest is tax year 2012)
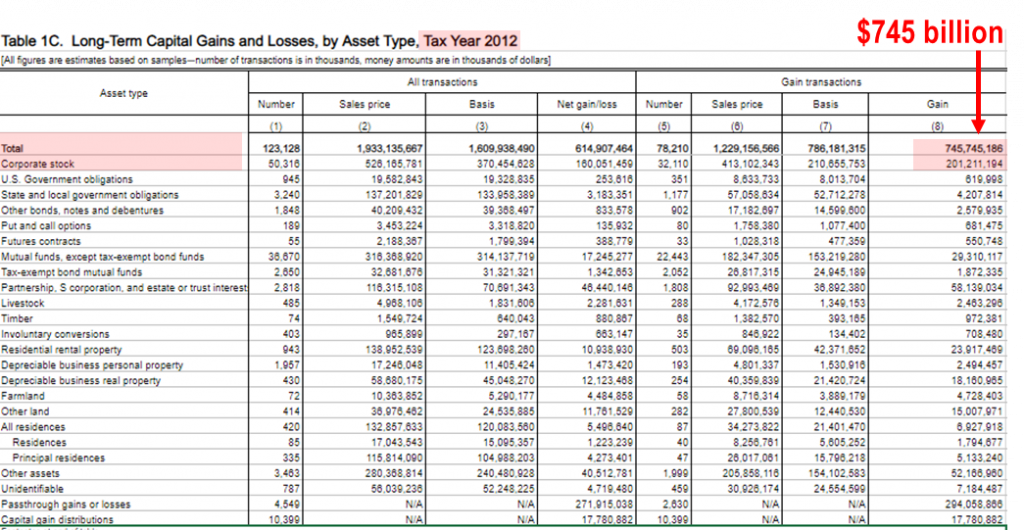
I was wondering how big a tax bite this might represent. The IRS publishes a report called SOI, of Statistics of Income, and this shows a detailed breakdown of aggregate capital gains. Unfortunately, the most recent year available in 2012, or 10 year lag:
- in 2012, the S&P 500 rose 16%
- total long-term capital gains generated in 2012 was $745 billion
- that is a huge figure
- the “total capital gains” matters, in our view, because this is the basis for the tax bill
- and thus, could give us a sense of selling pressure
If 2012 is a template, the 2021 capital gains will be >$4 trillion and tax bill ~$800 billion
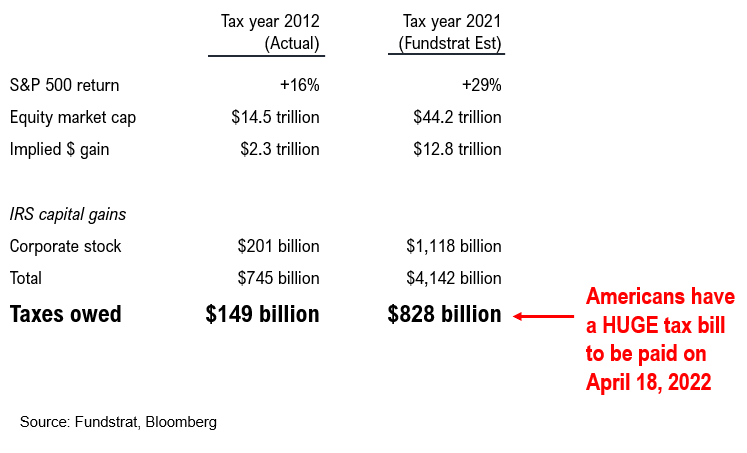
We took the 2012 data and applied this to 2021 to get an estimate of the possible capital gains and potential tax bill for Americans on 4/18:
- 2021 equity gains +29% vs +16% in 2012 = 2X gain
- Equity market cap is $44 trillion in 2021 vs $14.5 trillion = 3X size
- Implied dollar value of gain is $12.8 trillion for equities vs $2.3 trillion in 2012 = 6X
- Estimated equity capital gains is $1.1 trillion vs $201 billion 2021 vs 2012 = 6X
- Total capital gains estimated at $4 trillion vs $745 billion
- Taxes owed is estimated at $828 billion vs $149 billion in 2021 vs 2012
If this figure is remotely correct (it should be), Americans had a painful tax day. And this is being paid to the Treasury department.
- we have not incorporated the $1 trillion capital gain in Bitcoin and other crypto
- This would add further to taxes owed
The takeaway is that we believe many Americans have been raising cash over the last few weeks to fund their IRS payment. This is contributing, in our view, to the selling pressure seen in stocks in recent weeks.
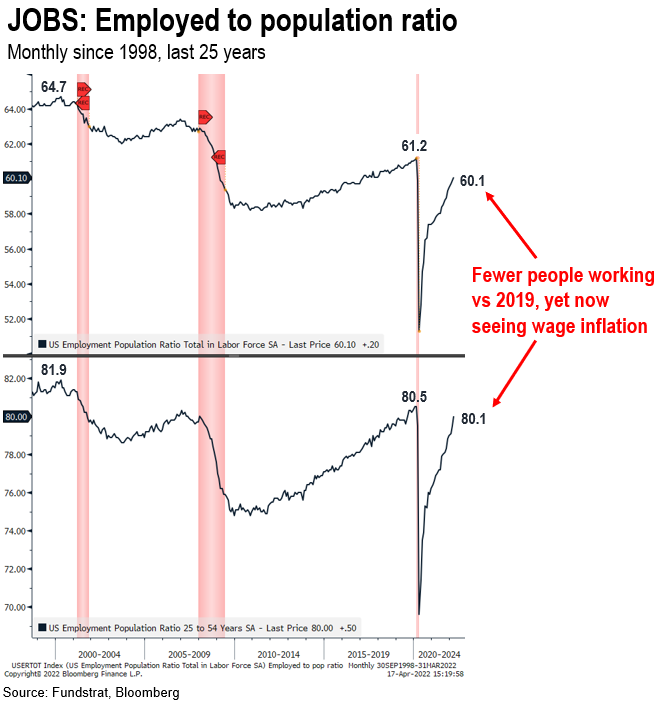
…Labor market are tight despite number of Americans working still well below pre-pandemic levels
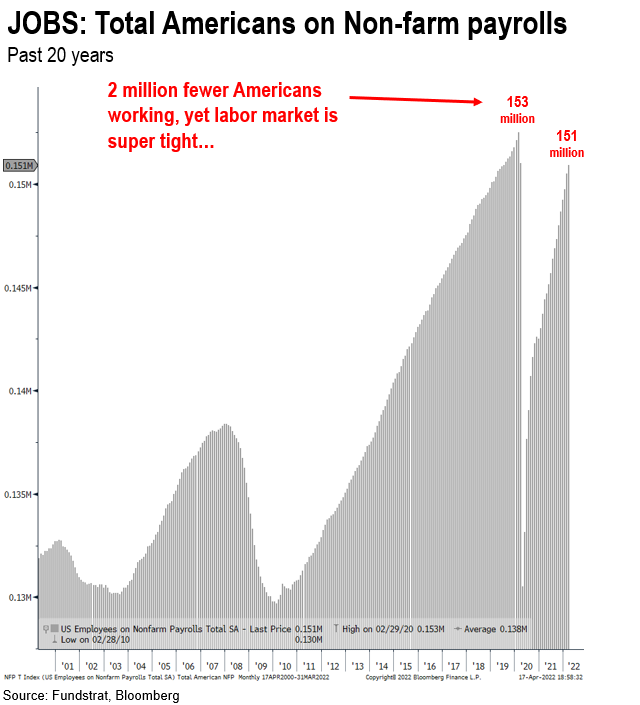
Signs of a tight labor market are prevalent, from rising wages to JOLTS data showing a record number of job openings. Yet, in aggregate, there are fewer Americans working today than in 2019:
- total non-farm employment today is 151 million
- it was 153 million in 2019
- or 2 million fewer people working today
Yet, curiously, there seems to be a major shortage of labor.
The is not a huge drop in the addressable labor market, if one is wondering if COVID-19 deaths reduced the labor pool. The figure below looks at employed to population:
- Employed to population ratio today is 60.1%
- It was 61.2% in 2019
- Even for 25-54 year olds, this figure is 80.1% today versus 80.5% in 2019
So, the total population size is not explaining this. There are actually fewer people working today than in 2019. Why?
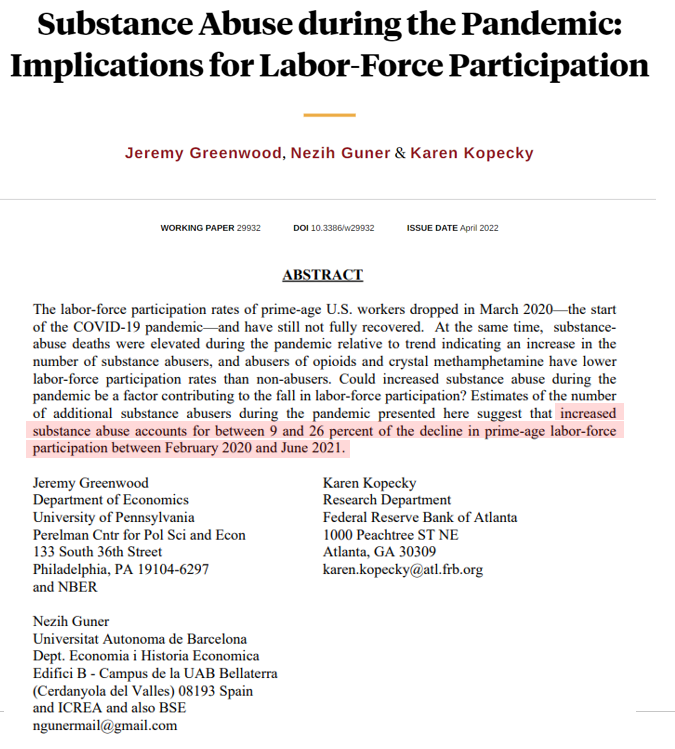
New Fed study suggests drug and alcohol abuse is explaining 9% to 26% of the drop in labor participation
A new Fed study (Atlanta Fed) suggest that drug and alcohol abuse might explain a large part of this drop.
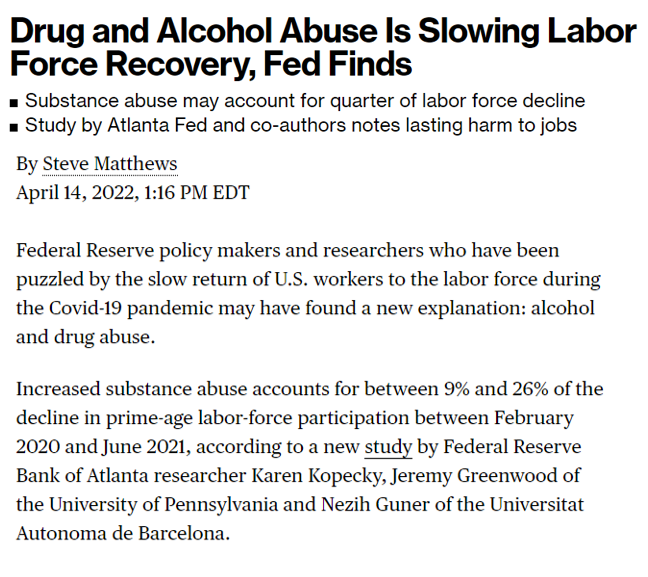
The link to the study is in the footnotes below and the abstract of the report is below.
- substance abuse could be accounting for the drop in participation rates
- this shows that COVID-19 and the associated policy response
- possibly contributed to a drop in the workforce
This raises the question. Does Fed hiking interest rates solve this?
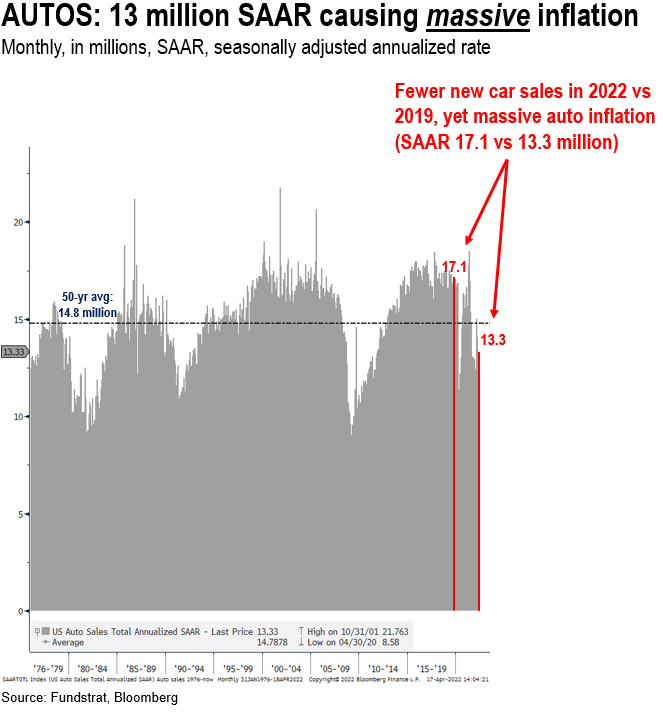
New and Used cars have seen massive inflation, yet new car sales of 13.1 million still below 17.1 million in 2019
The same math comes up with auto sales. We all know the anecdotes about how difficult it is to find a new or even a used car. And used car prices surged 44% last year. The chip shortages and supply chain glitches and pandemic shutdowns were all contributing factors:
- new car sales are running at 13.3 million in March 2022
- new car sales were 17.1 million in 2019
- 50-yr average is 14.8 million new cars
- So why is automobile prices exploding when new car sales are still low?
This hardly seems like an economy MAXING out in production. Rather, this really highlights that pandemic driven shortages are really distorting prices. And this “goods inflation” should become disinflation/deflation when supply chains normalize.
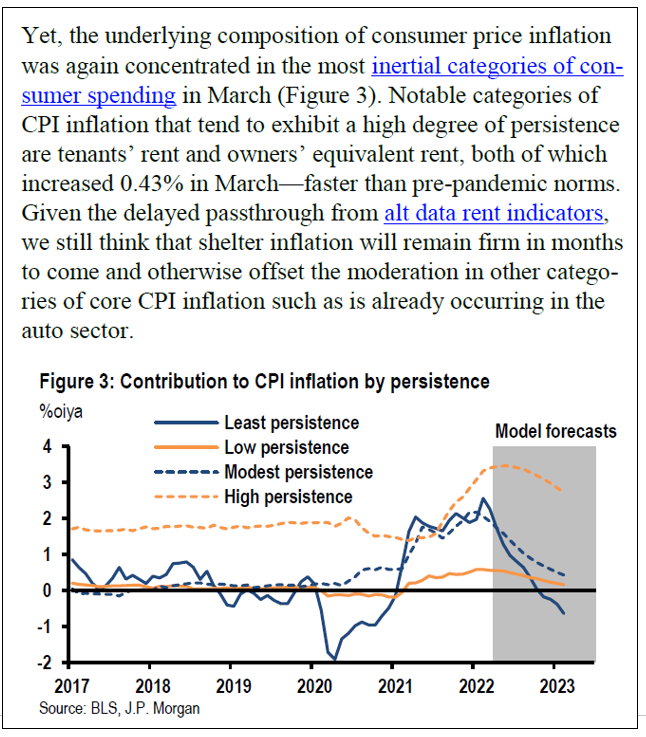
…JPMorgan Economists show that even “persistent categories of inflation” could be peaking
JPMorgan economists talk about different persistent/inertia levels of inflation (least to highest) and this chart they produced is interesting:
- least persistence CPI contributors likely already peaked (autos, etc)
- high persistence, like shelter, while “firming” are likely peaking in aggregate
- overall, inflation, if this is correct, should also be peaking soon
This is quite interesting, because if their models are directionally correct, inflation will be peaking in aggregate in the US soon.
STRATEGY: We still view consensus as too bearish, even as we still see 1H as treacherous
Bottom line, there are still significant challenges to the US and global economy ahead. There are the obvious and knowns:
- inflationary pressures
- supply chain shortages
- China COVID-19 surge
- Russia-Ukraine war
- midterm elections
- Fed hawkish
And yet, even in the face of this, we believe a lot of bad news is priced in. Hence, we think stocks have already made their 1H22 low (on 2/24) and very likely the 2022 low. That said, we don’t think stocks have to go straight up.
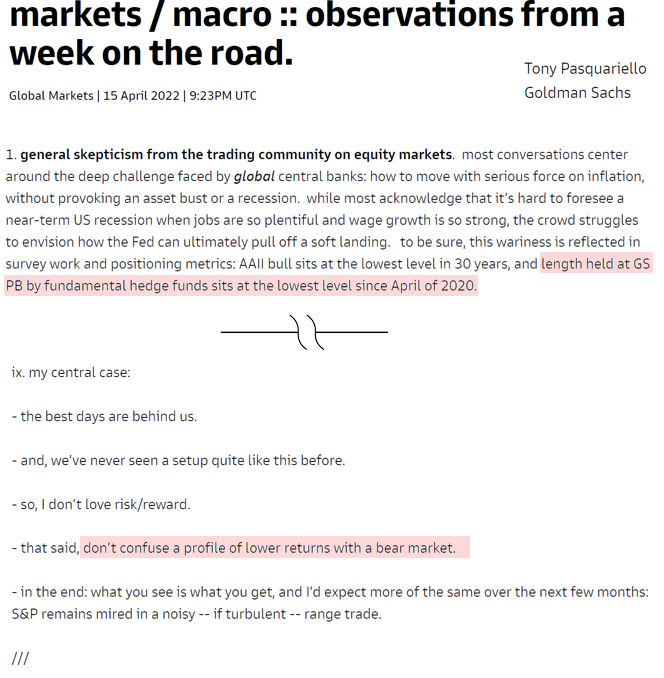
…Goldman Sachs macro piece sums it up well
An abstract from Tony Pascquariello, Goldman Sachs macro strategist sums this up well. He notes:
- the general skepticism of the trading community
- AAII bulls lowest in 30 years
- GS Prime Brokerage fundamental hedge fund longs lowest since April 2020
- Yup, that is cautious positioning
Yet, as he notes “don’t confuse a profile of lower returns with a bear market” — in other words, just because this is not 2021 again (+29% gains), doesn’t mean the world is ending.
STRATEGY: We lean “bullish” into 2Q2022, but warn of jagged next few months… Stick with BEEF
To recap on equity strategy, we are leaning bullish into 2Q2022.
– this is in context to a challenging 1H2022
– so jagged next 3 months
– but > 88% probability that bottom for 2022 is in
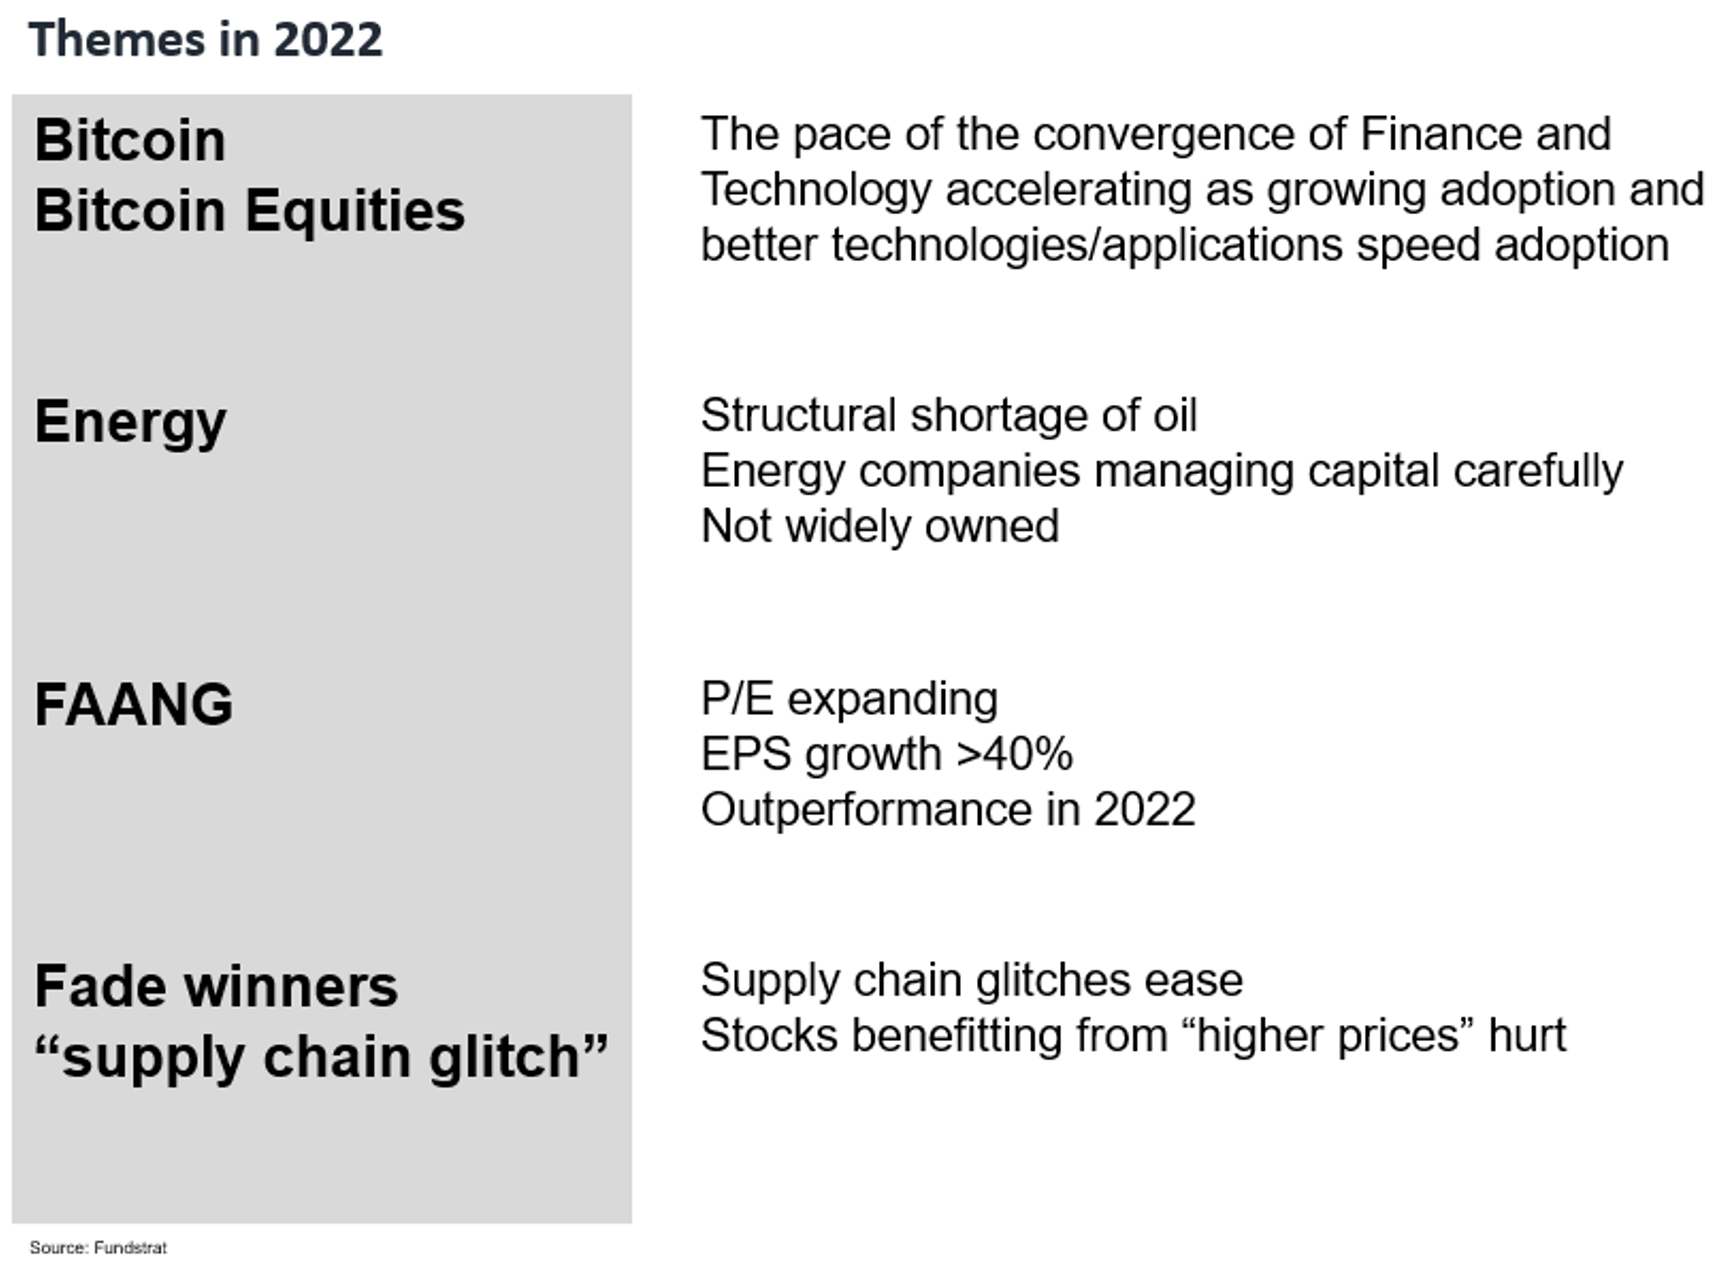
Broadly, our existing sector strategy of BEEF remains valid. Even in war. Even with inflation. In fact, the last few weeks are strengthening the case for our “BEEF” strategy. That is, BEEF is
– Bitcoin + Bitcoin Equities BITO1.11% GBTC1.23% BITW2.29%
– Energy
– FAANG FNGS-0.48% QQQ-0.48%
Combined, it can be shorted to BEEF.
Why is this making stronger BEEF?
– Energy supply is now a sovereign priority
– this helps Energy stocks
– Ukraine and Russia both want access to alternative currencies
– this strengthens case for Bitcoin and bitcoin equities
– if Global economy slows, growth stocks lead
– hence, FANG starts to lead FB AAPL0.52% AMZN-1.76% NFLX2.00% GOOG-2.12%
All in all, one wants to be Overweight BEEF
_____________________________
31 Granny Shot Ideas: We performed our quarterly rebalance on 4/5. Full stock list here –> Click here
_____________________________
POINT 1: Daily COVID-19 cases
This data will be updated every Friday.
POINT 2: Vaccination Progress
This data will be updated every Friday.
POINT 3: Tracking the seasonality of COVID-19
This data will be updated every Friday.
More from the author
Articles Read 1/2
🎁 Unlock 1 extra article by joining our Community!
Stay up to date with the latest articles. You’ll even get special recommendations weekly.
Already have an account? Sign In 91047a-087acb-4389c5-b5d110-486d7f
Already have an account? Sign In 91047a-087acb-4389c5-b5d110-486d7f

