...60% of Americans age 18-64 are vaccinated... it is age <18 hurting the statistics. Waiting out "quad witching" --> Choppy week continues

Click HERE to access the FSInsight COVID-19 Daily Chartbook.
We are shifting to a 4-day a week publication schedule:
- Monday
- Tuesday
- Wednesday
- SKIP THURSDAY
- Friday
STRATEGY: Waiting out “quad witching” –> Choppy week continues
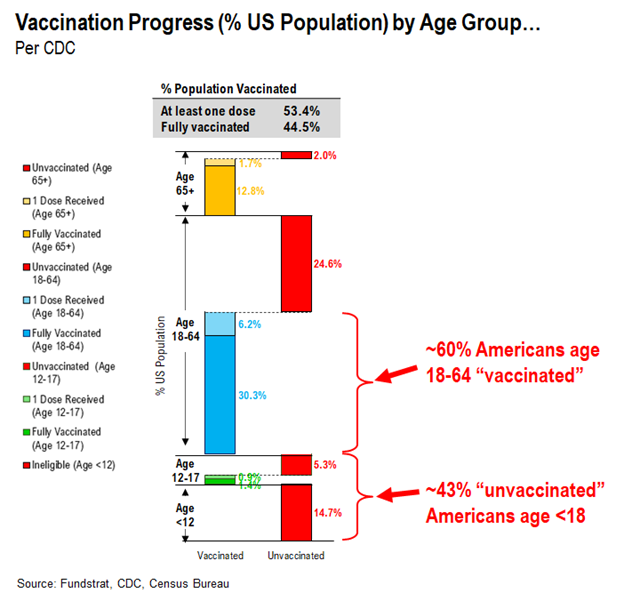
…60% of Americans age 18-64 are vaccinated… it is age <18 hurting the statistics
Tireless Ken, our head of data science, pulled some interesting statistics about US vaccinations. He gathered the information from the CDC, cross-referenced with information from the US Census Bureau. In essence, he broke down the composition of vaccinated and unvaccinated Americans. And the insights were interesting:
– Only 53% of Americans have received at least 1-dose
– But this data is misleading
– 60% of Americans age 18-64 have received at least 1-dose (36%/61% of USA)
– Americans age <18 have limited eligibility
– 43% of the “unvaccinated” is actually just Americans age <18
In other words, the US vaccination program is further along than one may think, as those who really need vaccinations, age >20, are at a higher level of penetration.
This is a “half-full” observation. But this might also partially explain the rapid decline in US cases. Those who are working and interacting with the economy and arguably most impacted, that is age 18-64, have high levels of vaccinations.
US Daily cases fall to sub-10,000 consistently
Take a look at US daily cases below and you can see for 3 of the last 4 days, daily cases were below 10,000. This is a pretty big milestone. We are not seeing fluky statistical aberrations driving sub-10,000 cases. It is becoming pretty consistent.
– COVID-19 is receding in the US, and at a minimum, well controlled
– US is on pace to full re-open. In fact, it is largely fully open
– US cases could be sub-5,000 next week
Whoa. I think this is a positive trend development, because the US is seeing a decisive downward move in cases.

Even the other key COVID-19 metrics are showing sustained improvements, without any signs of slowing down.
– US hospitalized patients is -88%
– US daily deaths is -90%
And neither looks to be flattening, trends look like further improvements ahead.
– Question –> how long until US daily deaths are less than 50 per day?
– Horrific figure, but a vast improvement from 5,000 per day at the peak

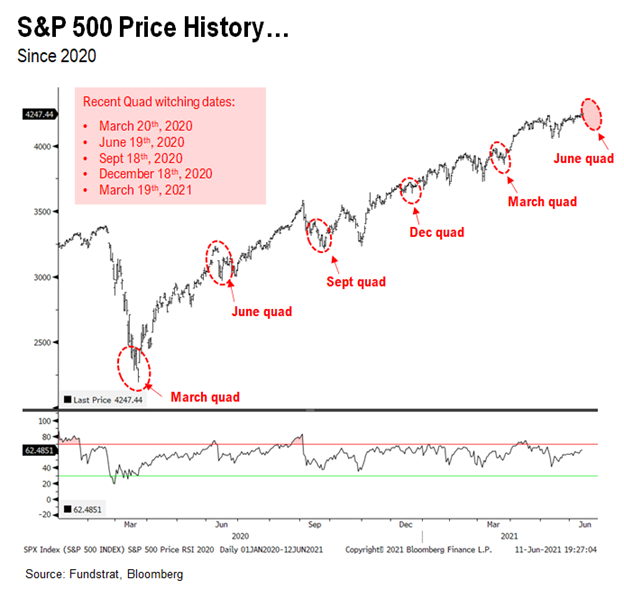
STRATEGY: “quad witching” week certainly is living up to its choppy reputation
We are two days into “quad witching” week and the fluctuation in markets is certainly living up to its reputation. Recall, “quad witching” is:
– single stock option expiration
– single stock futures expirations
– index option expiration
– index futures expiration
This happens four times per year. And as shown below, 5 of last 5 “quad witchings” saw market turmoil. We don’t have a lot of market commentary Tuesday because we see Tuesday’s price movements as largely noise. And our preference is to buy/ add exposure towards the end of the week.
– Moreover, we have the FOMC briefing Wednesday, and this will carry a lot of weight.
…FOMC meeting likely to be a positive catalyst, actuallyThe data that came in this week has been heavy. And as we know, the incoming data investors are keying off of is inflationary signs.
– Retail sales (ex-autos) came in somewhat soft at -0.7% vs +0.4% Street
– Empire manufacturing missed +17.4 vs 22.7 Street
– NAHB Housing Index missed 81 vs 83 Street
– Above was Producer Price Index ex-food ex-Energy at +0.7% vs 0.5%
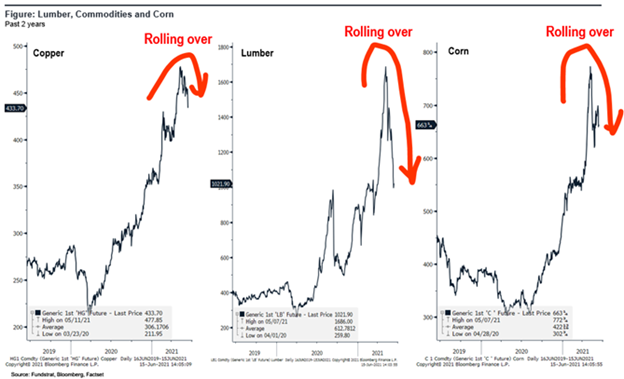
But the data points this week hardly seem to support strengthening inflationary conditions. In fact, look at many of the commodities below:
– Lumber rolling over
– Copper might be rolling over
– Corn rolling over
So, from the market’s perspective, the FOMC is not on its heels if it continues to suggest “transitory” inflation. In any case, I don’t have a strong view on market direction this week:
– the future is uncertain, always
– “quad witching” makes it especially uncertain
But we continue to have high conviction on Energy and oil, generally. We like individual names like XOM, best performing mega-cap, but also ETFs XLE-0.05% and OIH-0.06% as proxies for sector exposure.
Beware of “quad witching”!!!!!
ADDENDUM: We are attaching the stock lists for our 3 portfolios:
We get several requests to give the updated list for our stock portfolios. We are including the links here:
– Granny Shots –> core stocks, based on 6 thematic/tactical portfolios
– Trifecta epicenter –> based on the convergence of Quant (tireless Ken), Rauscher (Global strategy), Technicals
– Violence in USA –> companies that are involved in some aspect of home or personal security. We are not “recommending” these stocks, but rather, bringing these stocks to your attention.
Granny Shots:
Full stock list here –> Click here
Trifecta Epicenter (*):
Full stock list here –> Click here
Power Epicenter Trifecta 35 (*):
Full stock list here –> Click here
Violence in USA:
Full stock list here –> Click here
(*) Please note that the stocks rated OW on this list meet the requirements of our investment theme as of the publication date. We do not monitor this list day by day. A stock taken off this list means it no longer meets our investment criteria, but not necessarily that it is neutral rated or should be sold. Please consult your financial advisor to discuss your risk tolerance and other factors that characterize your unique investment profile.
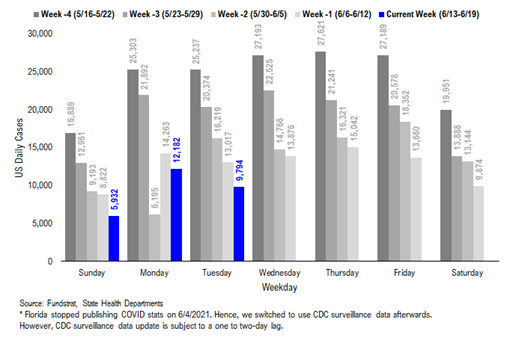
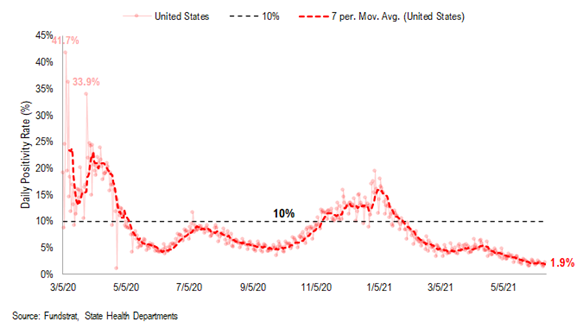
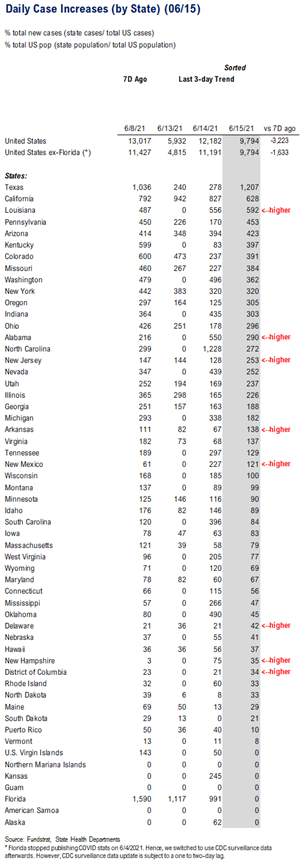
POINT 1: Daily COVID-19 cases 9,794, -1,633 (ex-FL) vs 7D ago… Daily cases likely to fall below 10,000 for most of the individual days next week…
_____________________________
Current Trends — COVID-19 cases:
– Daily cases 9,794 vs 13,017 7D ago, down -3,223
– Daily cases ex-FL 9,794 vs 11,427 7D ago, down -1,633
– 7D positivity rate 1.9% vs 2.2% 7D ago
– Hospitalized patients 15,201 down -12% vs 7D ago
– Daily deaths 321, down 19% vs 7D ago
_____________________________
– As we noted previously, Florida stopped publishing daily COVID stats update on 6/4 and we switched to use CDC surveillance data as the substitute. However, as CDC surveillance data is subject to a one to two-day lag, we added a “US ex-FL” in our daily cases and 7D delta sections in order to demonstrate a more comparable COVID development.
– The latest COVID-19 daily cases came in at 9,794, down -1,633 (ex-FL) vs 7D ago. The 7D delta in daily cases has been stabilized since last Monday’s spike. The persistent decline in daily cases and no post-holiday surge proved the importance of vaccine penetration. With continued efforts for higher penetration of vaccines, we believe the steady decline in daily cases is likely to persist, and daily cases could drop sub-10,000 for most of the individual days in the next week.
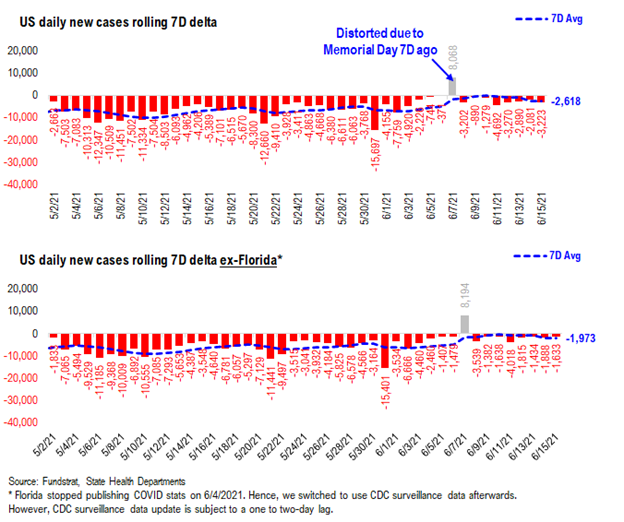
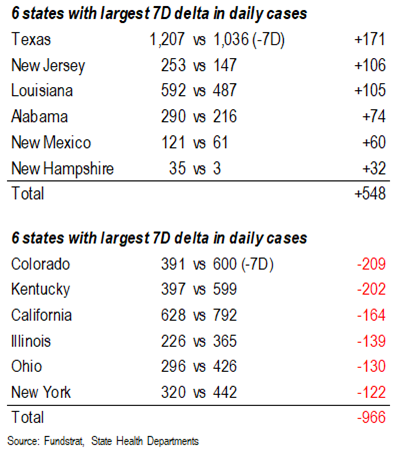
7D delta in daily cases has remained negative since the spike due to data distortion…
As suggested by the chart below, the 7D delta in daily cases has been stabilized over the past 7 days. The decline in daily cases seems to slow down partially due to the lower daily cases now vs. a few months ago. But more importantly, the daily cases remain on a downtrend and we haven’t seen a post-holiday case figure yet. As the data suggests, we expect the steady decline in daily cases to persist.
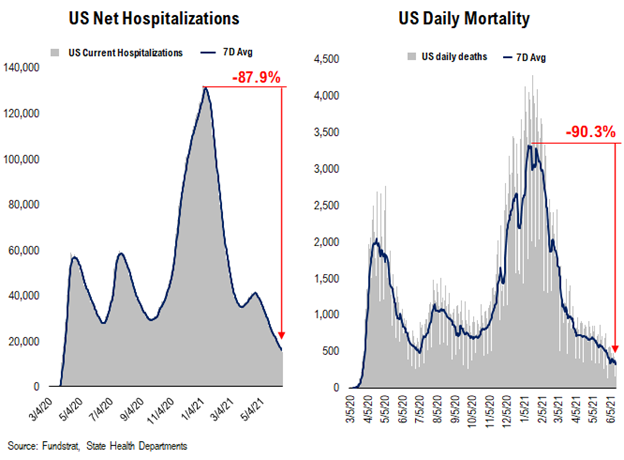
Current hospitalization, daily deaths and positivity rate are at all time low…
Below we show the aggregate patients who are currently hospitalized due to COVID. After a mini-surge in March, the number of patients currently hospitalized rolls over again. Positivity rate is also following the similar pattern. Currently, all three metrics – current hospitalization, daily deaths and positivity rate – are at their all time lows since the start of the pandemic.
POINT 2: VACCINE: Vaccination pace has sped up… Daily vaccination about 1.1 million doses (~35 million per month)…
_____________________________
Current Trends — Vaccinations:
– avg 1.1 million this past week vs 1.0 million last week
– overall, 43.6% fully vaccinated, 52.2% 1-dose+ received
_____________________________
Vaccination frontier update –> all states now near or above 70% combined penetration (vaccines + infections)
Below we sorted the states by the combined penetration (vaccinations + infections). As we commented in the past, the key figure is the combined value >60%, which is presumably near herd immunity. We have overlaid our case progress with that of Israel several times to demonstrate what should happen to cases once immunity reaches a certain critical level in the population. That is, the combined value of infections + vaccinations as % population > 60%. The persistent and rapid decline in cases suggest that the US is following a similar path to Israel (see our prior notes) while nations with less penetration continue to struggle more.
– Currently, all states are near or above 70% combined penetration
– RI, SD, MA, ND, CT, NJ, DE, NY, IL, UT, MN, NM, NE, AZ, PA are now above 90% combined penetration (vaccines + infections)
– So gradually, the US is getting to that threshold of presumable herd immunity. So long as a vaccine resistant variant doesn’t spread widely, the continued retreat of cases should continue.
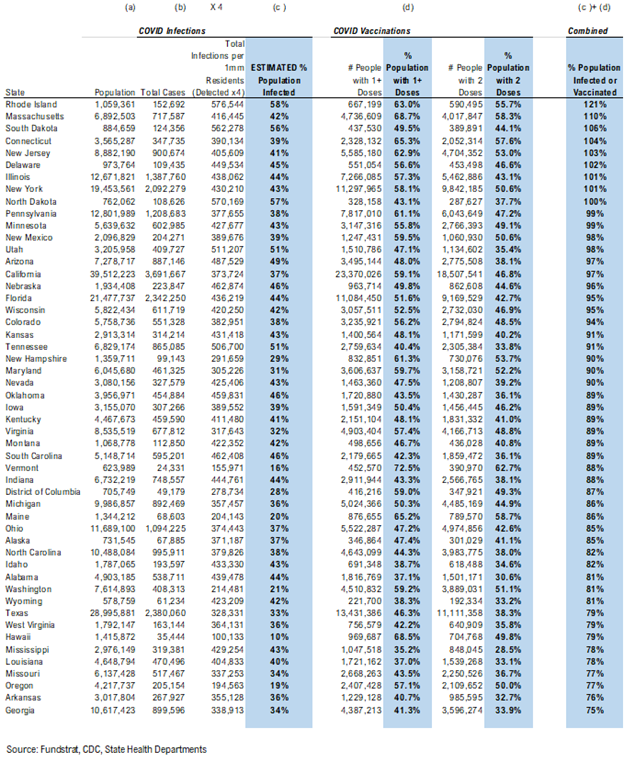
Below is a diffusion chart that shows the % of US states (based on state population) that have reached the combined penetration >60%/70%/80%/90%. As you can see, all states have reached 60% and 70% combined vaccination + infection. 80.5% of US states (based on state population) have seen combined infection & vaccination >80% and 55.1% of US states have seen combined infection & vaccination >90%.
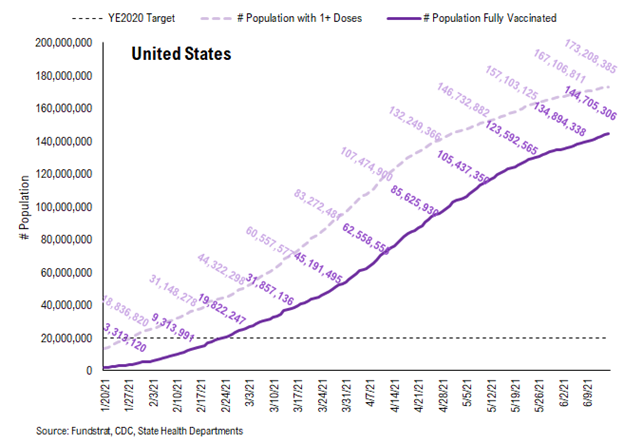
There were a total of 1,222,472 doses administered on Tuesday, up 15% from 7D ago. After the daily number of doses administered fell below 1 million, the vaccination trend (dashed line: 7D average) has sped up. This increase in vaccination speed coincides with the recent efforts by the Biden administration to get more people vaccinated by the fourth of July. With continued efforts for higher penetration of vaccines, it could prevent the renewed outbreak and ensure the economy reopens safely.
95.5% of the US has seen 1-dose penetration >40%…
To better illustrate the actual footprint of the US vaccination effort, we have a time series showing the percent of the US with at least 35%/40%/45% of its residents fully vaccinated, displayed as the orange line on the chart. Currently, 89.3% of US states have seen 35% of their residents fully vaccinated. However, when looking at the percentage of the US with at least 40% of its residents fully vaccinated, this figure is 65.9%. And only 44.5% of US (by state population) have seen 45% of its residents fully vaccinated.
– While 95.5% of US states have seen vaccine penetration >40%, 78.7% of them have seen 1 dose penetration >45% and 58.8% of them have seen 1 dose penetration > 50%.
– 89.3% of the US has at least 35% of its residents fully vaccinated, However, only 65.9% of US has fully vaccinated >40% and 44.5% of US has fully vaccinated >45%.
This is the state by state data below, showing information for individuals with one dose and two doses.
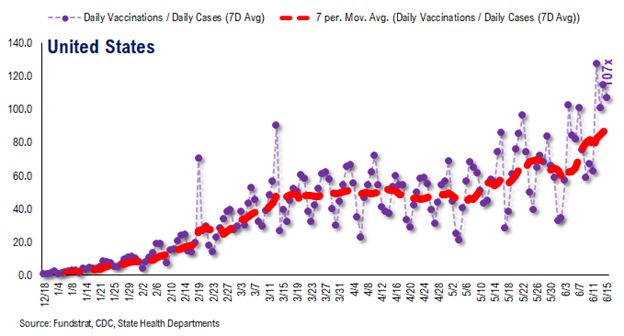
The ratio of vaccinations/ daily confirmed cases is generally trending higher (red line is 7D moving avg), but this is largely due to the decline in daily cases.
– the 7D moving average is about ~80 for the past few days
– this means 70 vaccines dosed for every 1 confirmed case
In total, over 300 million vaccine doses have been administered across the country. Specifically, 173 million Americans (52% of US population) have received at least 1 dose of the vaccine. And 145 million Americans (44% of US population) are fully vaccinated.
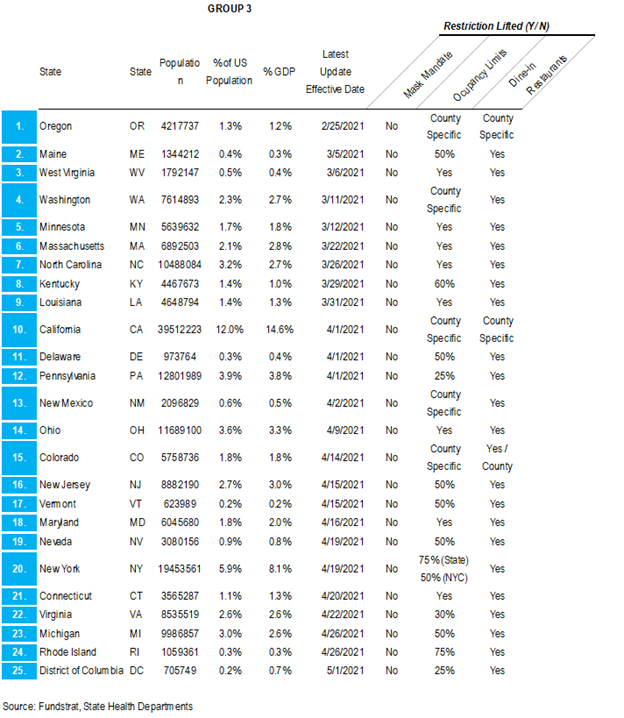
POINT 3: Tracking restrictions lifting and subsequent effects in individual states
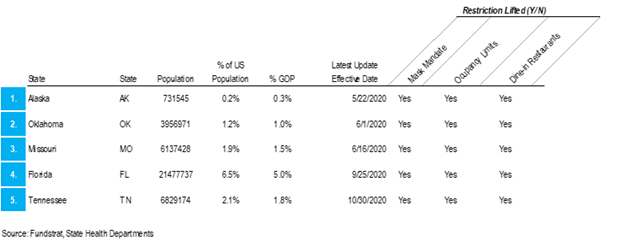
Point #3 focuses primarily on tracking the lifting of restrictions, as states have eased the majority of mandates. Keep in mind, easing/lifting restrictions are contingent upon state of emergency ordinances being renewed.
– States in groups 1 and 2 represent states that let their emergency ordinances expire, or that never had one in the first place
– Note: IL and HI are not listed. This is because restrictions lifting is determined at the county / island level, and no statewide policy will be established to lift restrictions until a full reopening
So there is a spectrum of approaches. Our team is listing 3 tiers of states and these are shown below.
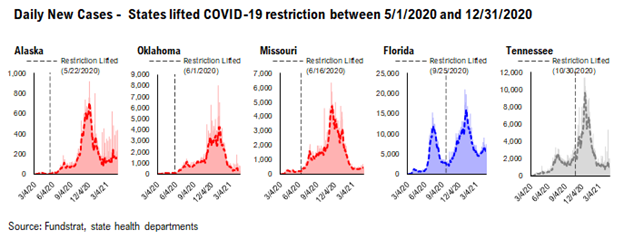
– states that eased all restrictions in 2020: AK, OK, MO, FL, TN
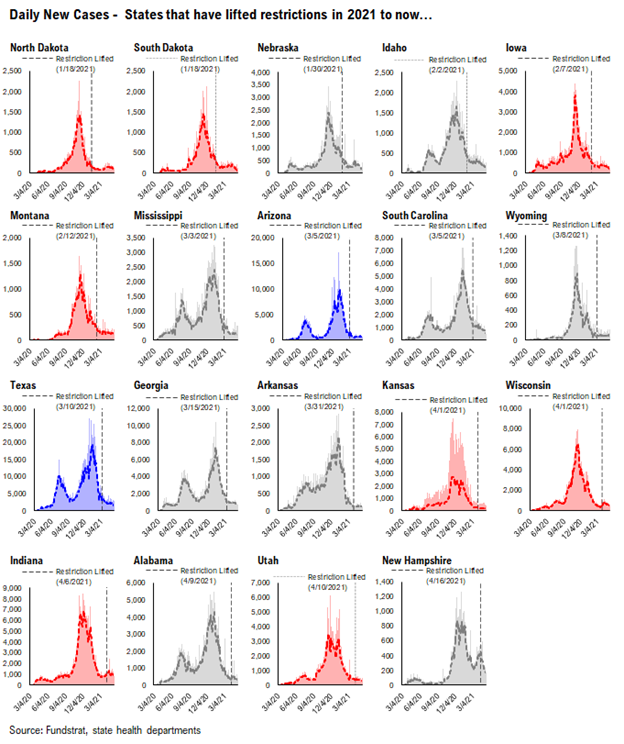
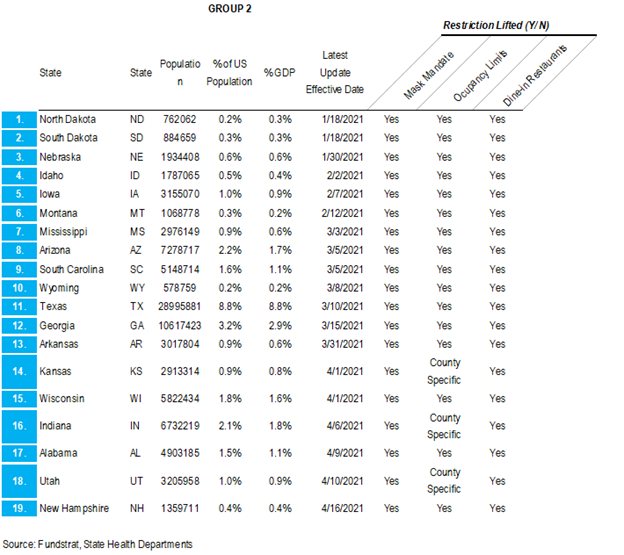
– states that have eased all restrictions in 2021 to now: ND, SD, NE, ID, IA, MT, MS, AZ, SC, WY, TX, GA, AR, KS, WI, IN, AL, UT, NH
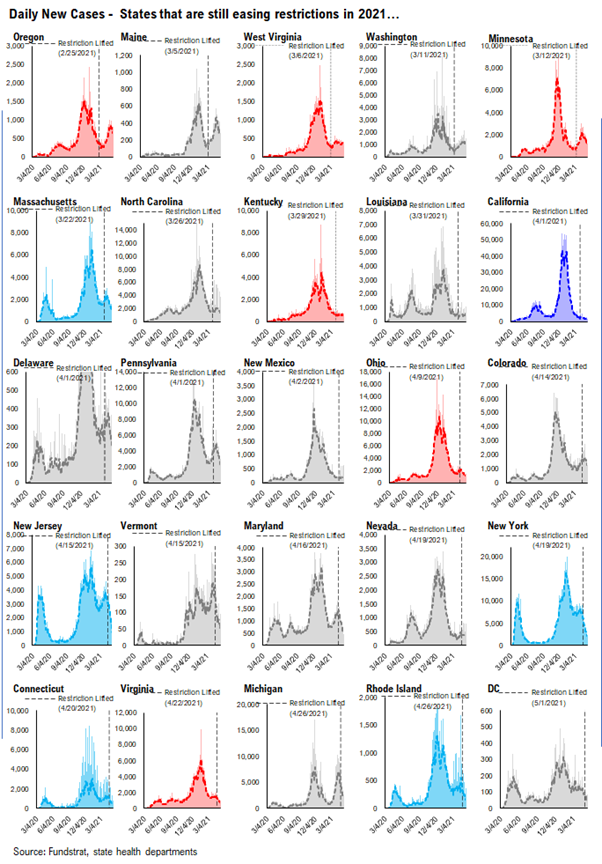
– states that are still easing restrictions in 2021: OR, ME, WV, WA, MN, MA, NC, KY, LA, CA, DE, PA, NM, OH, CO, NJ, VT, MD, NV, NY, CT, VA, MI, RI, DC
GROUP 1: States that lifted restrictions in 2020…
The daily case trends in these states are impressive and it is difficult to say that lifting restrictions has actually caused a new wave of cases because the case trends in these states look like other states.
GROUP 2: States that have lifted restrictions in 2021 to now…
Similar to the list of states above, the daily case trends in these states are impressive and it seems that lifting restrictions hasn’t caused an increase in cases.
GROUP 3: States that are still easing restrictions in 2021…
These states have begun to lift restrictions, but have yet to ease all restrictions. The date of each state’s most recent restrictions lifting is indicated on each chart. The case trends in these states have been mostly positive.
– Easing restrictions appears to have contributed to an increase in cases in several of these states, most drastically in OR, ME, WA, and MN