

Downturn in PPI portends continued leg down in CPI. Of 11 sectors, 4 have solid EBIT correlation to PPI (commodities, utes). Least impacted are Technology, Discretionary, Comm Services and Financials.

We publish on a 3-day a week schedule:
Monday
SKIP TUESDAY
Wednesday
Thursday <– Due to traveling, we are sending the note 1 day earlier
SKIP FRIDAY
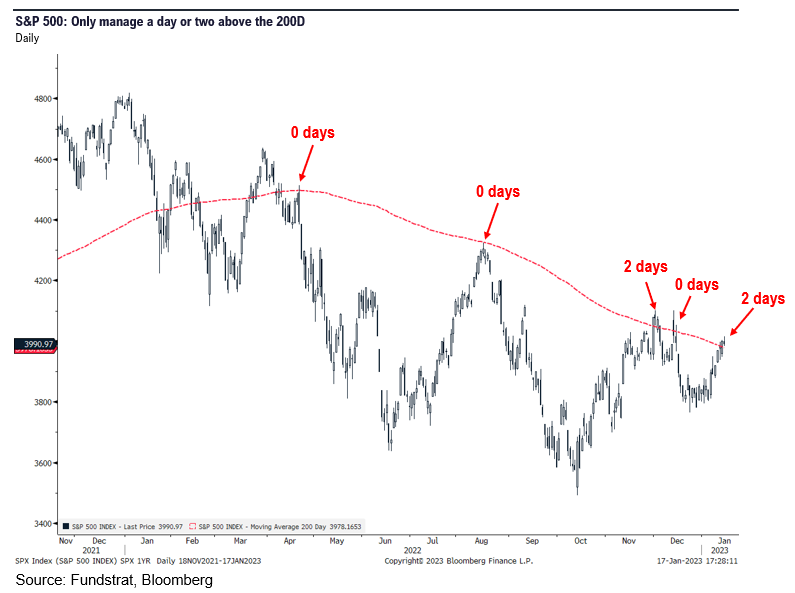
Since the S&P 500 intraday low of 3,491 on 10/13, the S&P 500 has rallied ~15%, even after the decline posted on Wed (1/18). The 200-day moving average is 3,975 and this remains an important level. Since April 2022, the S&P 500 has not managed to close above the 200D for more than two consecutive business days. And until equities move and close decisively higher, investors remain cautious on equities — a “show me” situation.
Inflation has visibly slowed and core inflation is now running at sub-3% (both CPI and PCE) and is repeatable given the multitude of factors supporting a leg down in inflation (supply chains, commodities, shelter, etc). But investors cite other factors that have them sidelined:
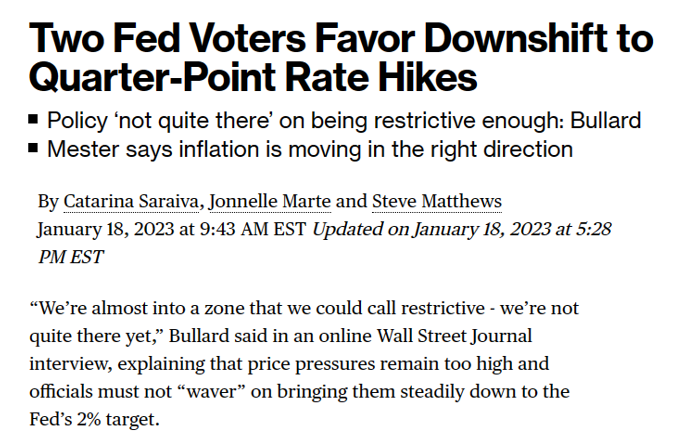
- Fed is concerned about wage inflation and the “core services ex-housing” so until that decisively cools, the Fed will stay tight. There was Fed speak on Wed and Bullard among others reiterated the need to stay tight for some time.
- The cumulative effects of Fed tightening have dealt a dramatic slowdown in economy, evidenced by PMIs and surveys, meaning markets need to price in slowing growth
- A variation is EPS estimates are still set to fall, hence, markets have another “shoe to drop”
- In sum, investors see the second order effects of Fed tightening as reasons to stay cautious.
But here is the issue we have with this perspective. There are several:
- Foremost, we believe Fed made an “unforced error” in Dec (due to Haver analytics hack) and currently inflation is tracking lower than Fed expects (and consensus)
- This means that if core inflation continues track around 2% (3M annualized) and wage income remains ~3.5% (essentially at Fed target), the bond market will increasingly fight the Fed on future hikes and path of terminal rates. This battle is already underway
- As for the EPS slowdown, there is both a valley and a recovery ahead. So which one do markets need to price in?
- At the end of 2022, investors were focused on the “risk to 2023 EPS” and thus, the horizon for earnings and what to discount is the forward period.
- So here is the question, at the end of 2023, what EPS will markets be pricing? 2023 or 2024?
- And if the Fed indeed does not need to make a “leg down” adjustment for inflation trajectory, won’t the market reprice risk premia as a consequence? Think about this latter point.
- If inflation is “vanquished,” a major tail risk will have been eliminated. And as such, one would argue P/E would rapidly expand.
All in all, we think this points to equities continuing to surprise to the upside in 2023. Exactly when stocks will start to demonstrably improve is unknown. But in our view, the strong start to 2023 signals upside surprise ahead. Hence, we believe the S&P 500 can gain >20% in 2023.
PPI: Dec (Producer Price Index) showing rapid decline in inflationary pressures for producers
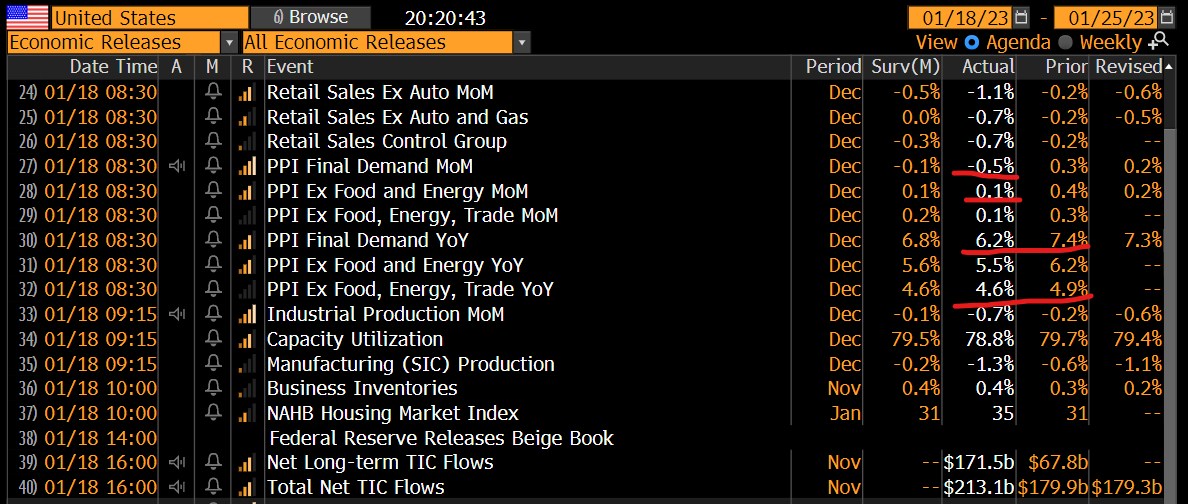
Incoming economic data on 1/18 was positive on the inflation front (PPI) and mixed on the demand/volumes side.
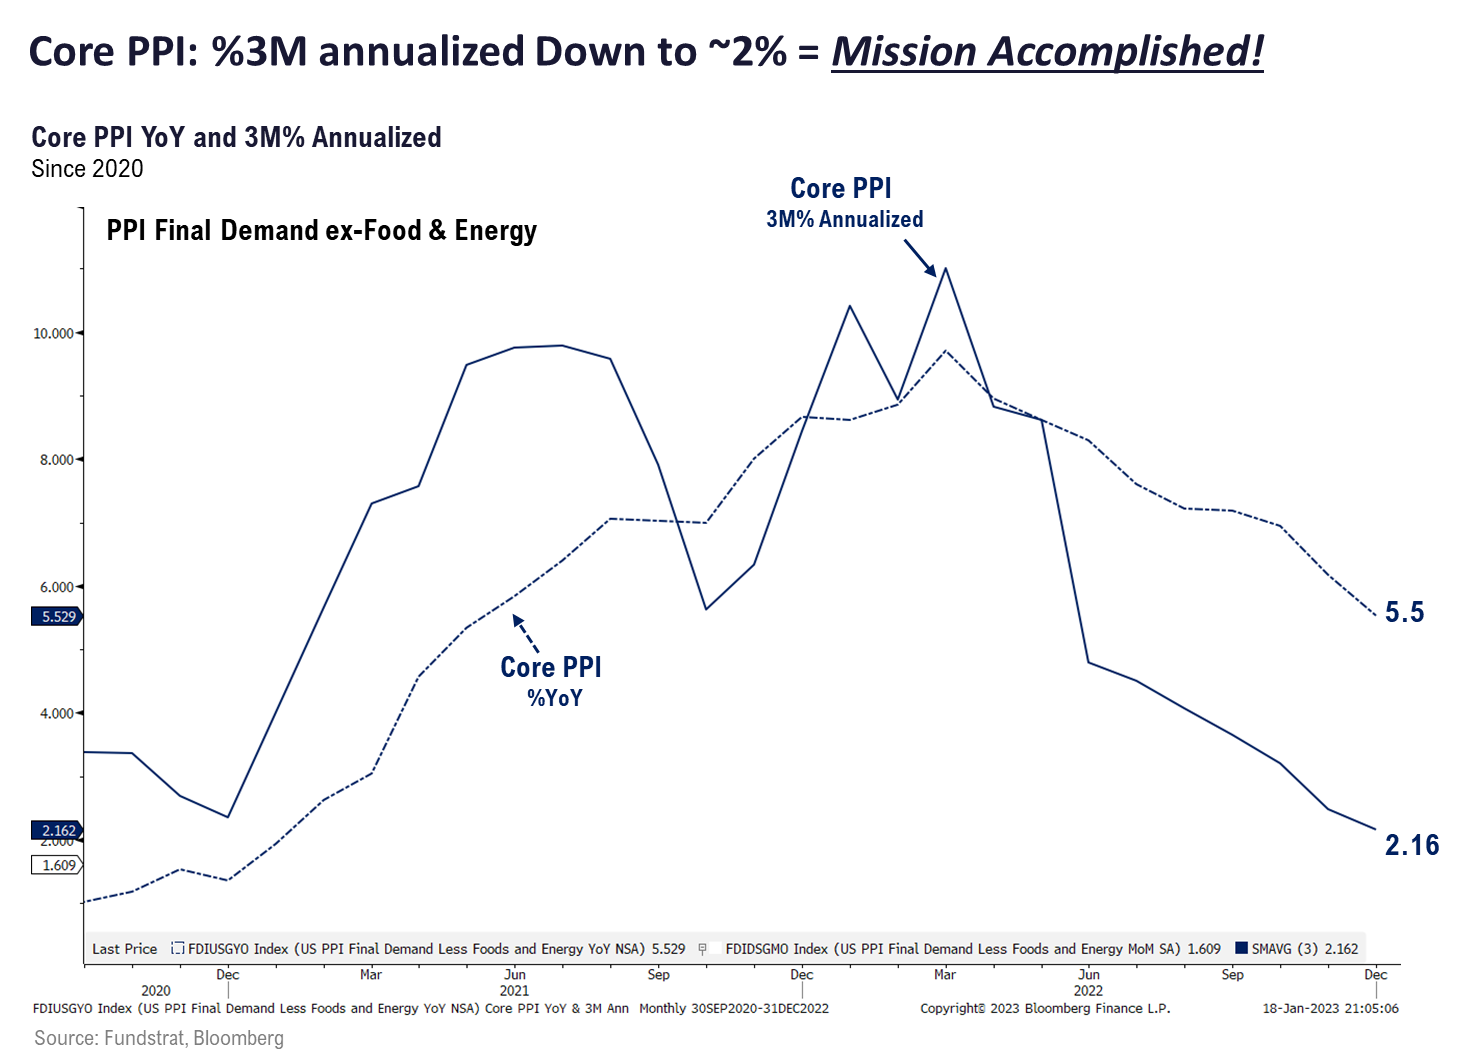
- Dec PPI core came in at +0.1% vs +0.4% last month and 3M annualized is 2.16%, pretty consistent with 2% Core CPI.
- Retail sales were soft with ex-autos and ex-gas at -0.7% vs 0.0% expected but this is not entirely surprising.
- NAHB was a positive surprise coming in at 35 vs 31 expected
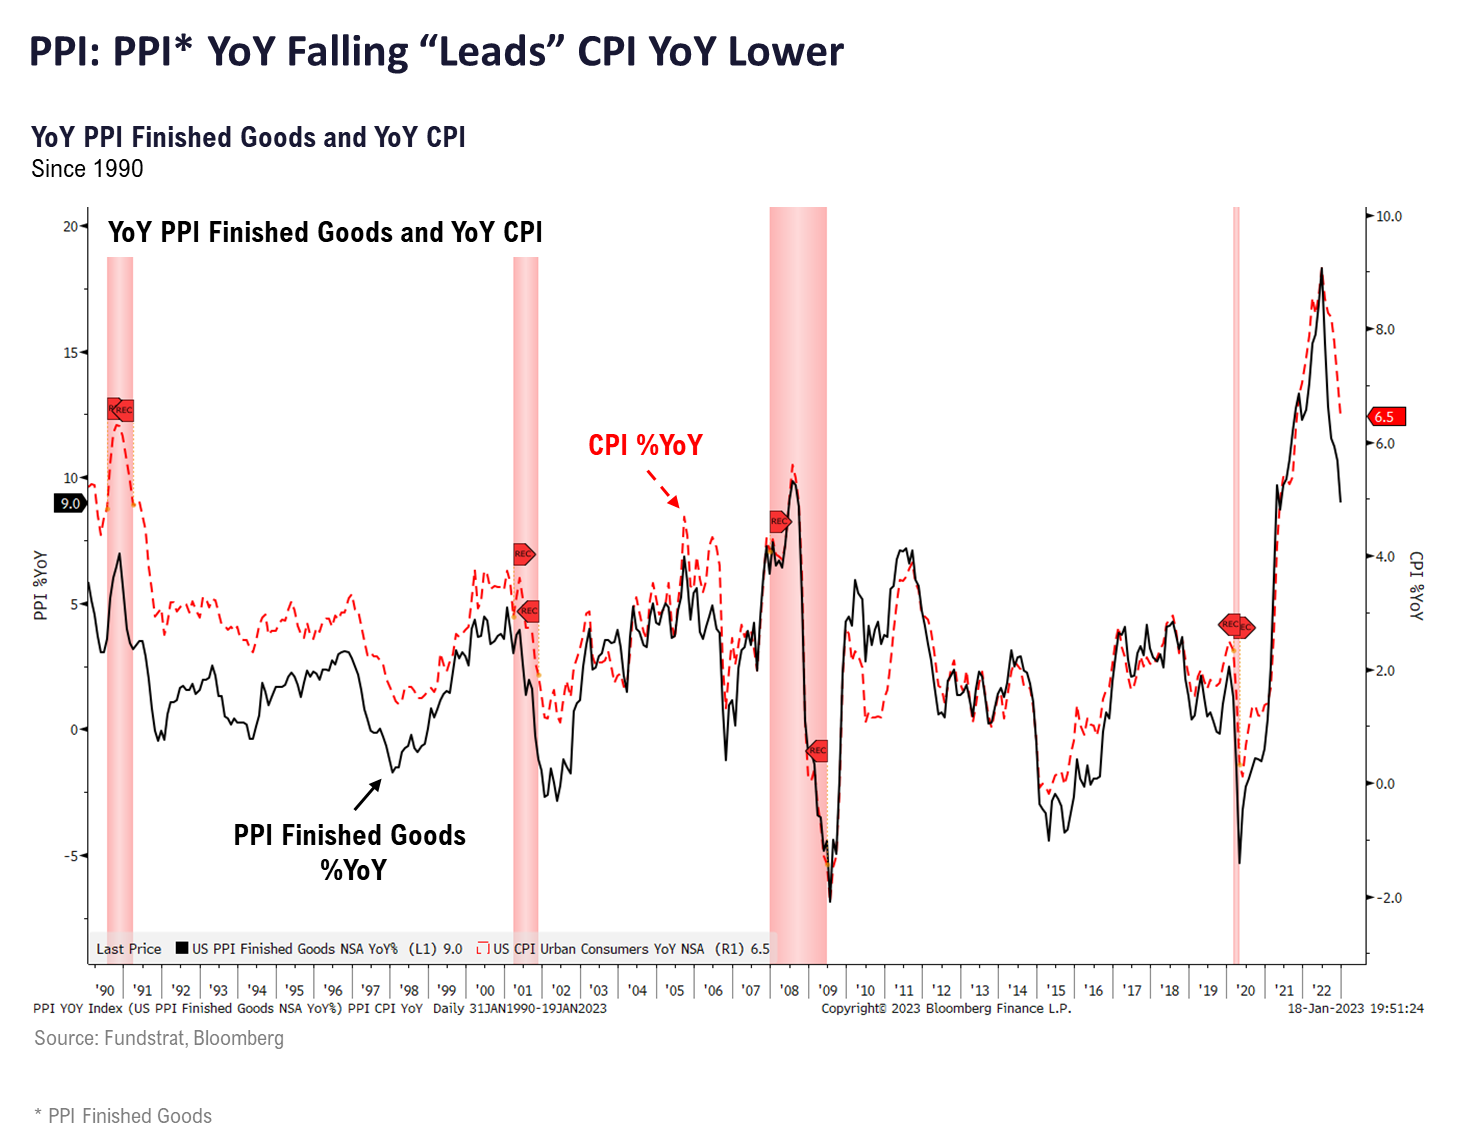
As shown below, PPI core is falling like a rock (3M annualized).
PPI leads CPI: Has been the case consistently
Of these, we view PPI as the most important. As shown below, the PPI Finished Goods and CPI move in tandem and our data science team notes that PPI Finished Goods leads CPI.
- hence, a downturn of PPI Finished Goods of this magnitude points to a sizable drop in CPI in coming months
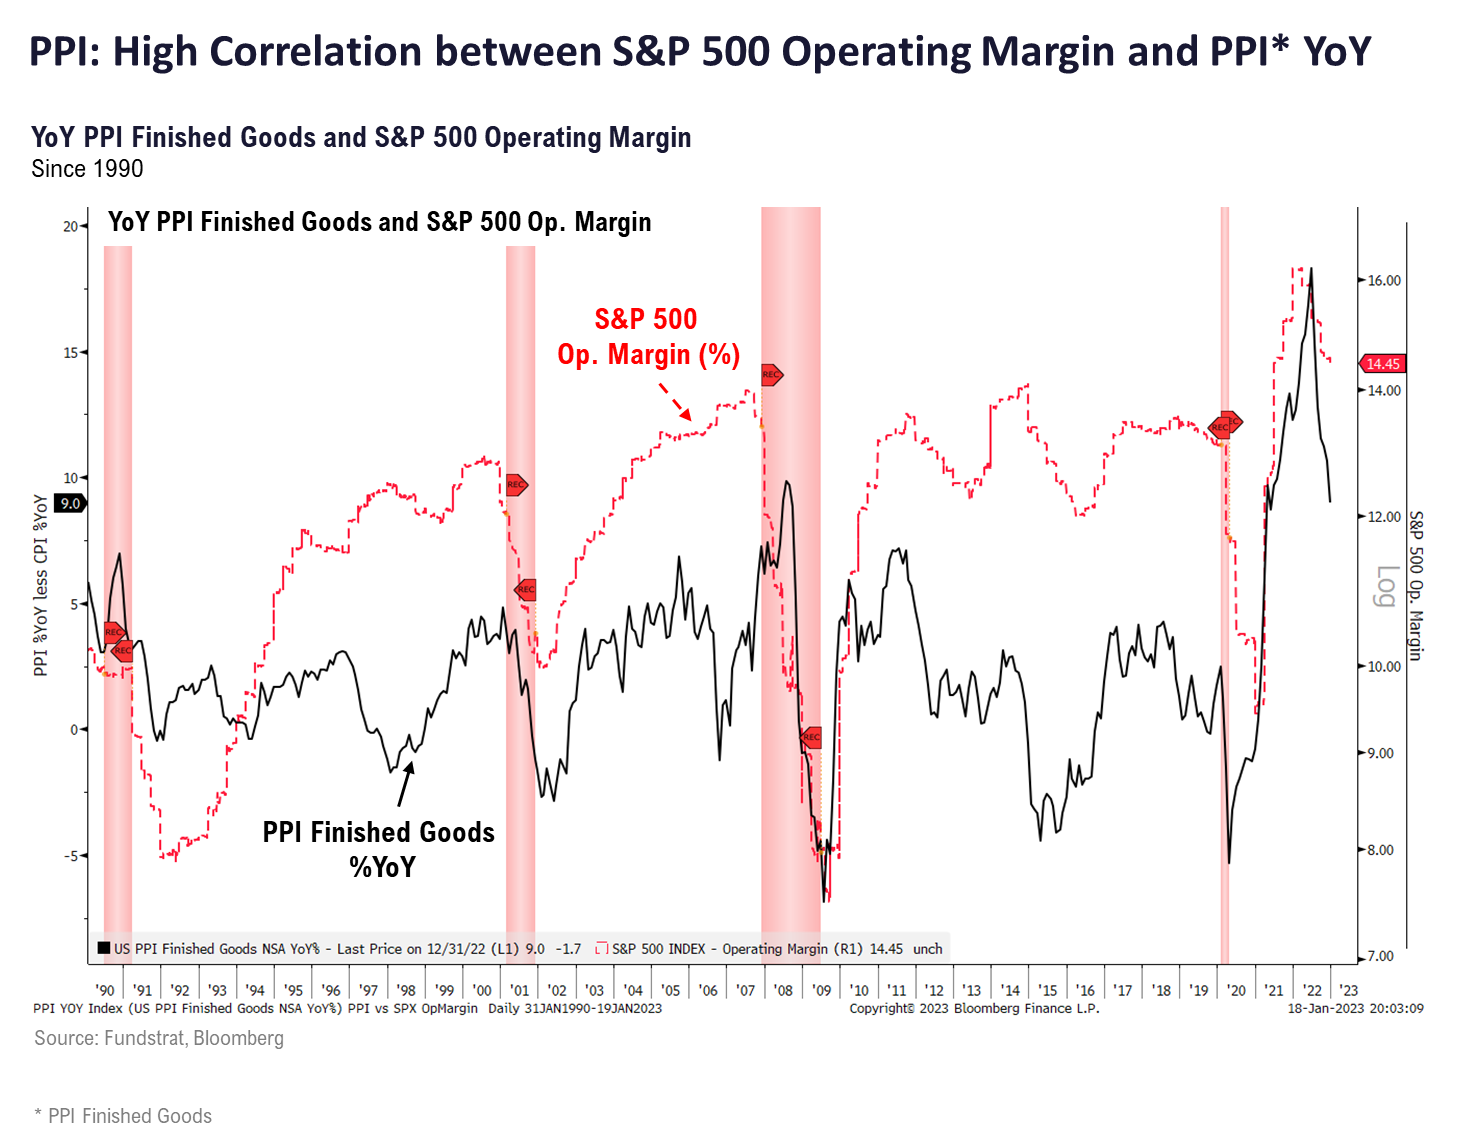
But this drop in PPI Finished Goods also portends downside to EBIT margins coming for S&P 500 companies. This is reflected below and as evident, there is a general directional relationship between PPI Finished Goods YoY and EBIT margins.
- but the key is the sector and industry sensitivity, and this is more important, arguably than overall S&P 500 EBIT sensitivity.
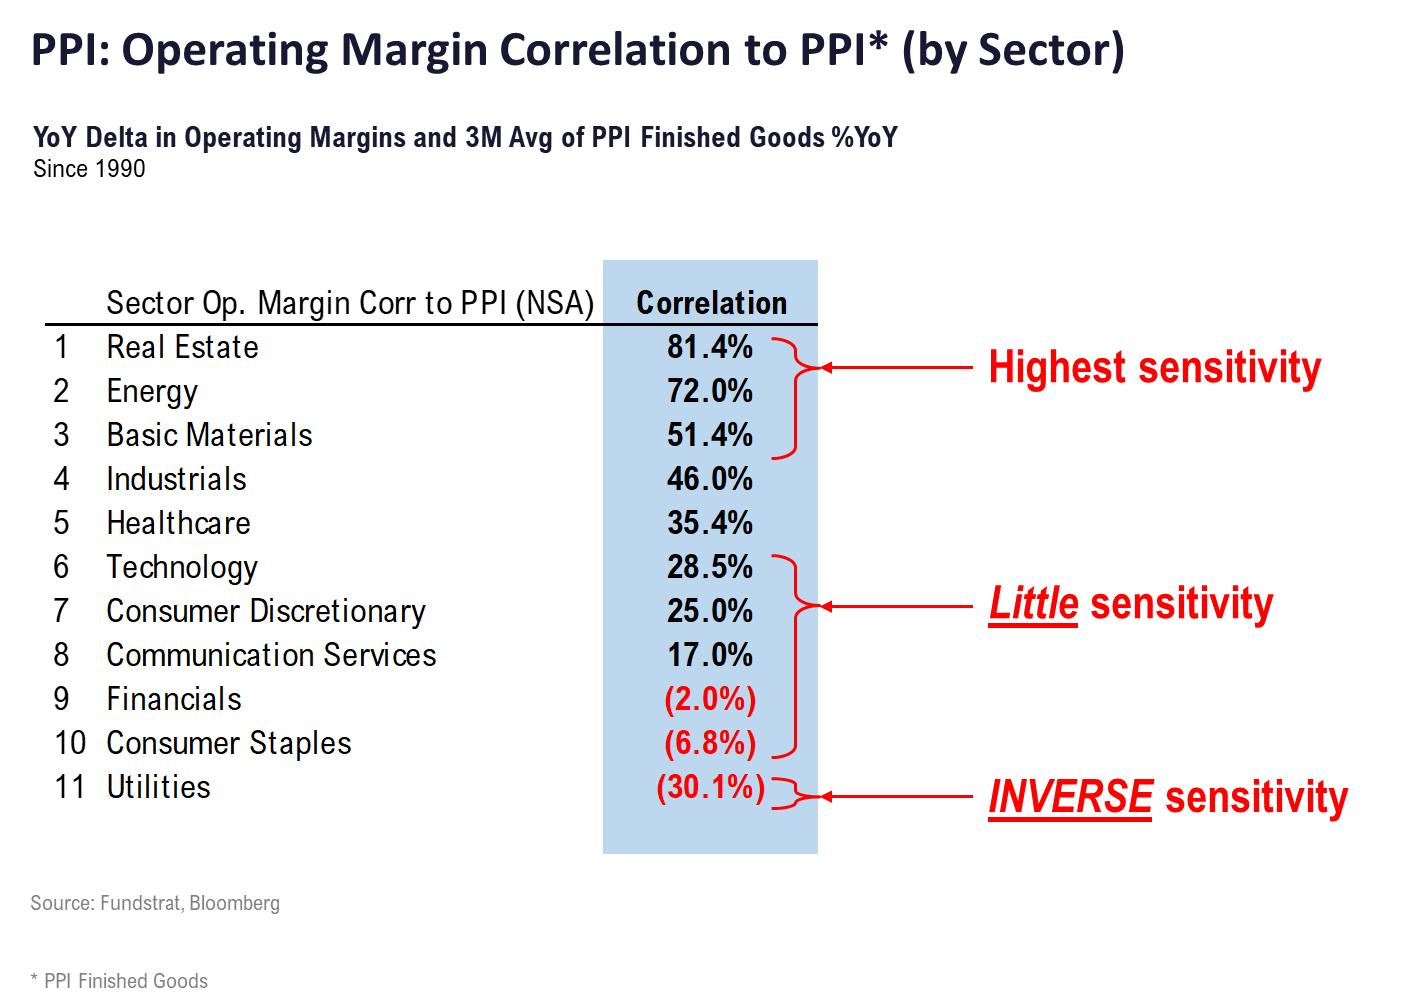
As shown below, the sectors most correlated on EBIT-margin basis to PPI are:
- Real Estate
- Energy
- Basic Materials
Inverse correlated:
- Utilities
Little correlation:
- Technology
- Discretionary
- Communications Services
- Financials
- Staples
So overall, the groups most vulnerable to potential EBIT pressures are commodity related groups, not surprisingly. A distant second is Industrials.
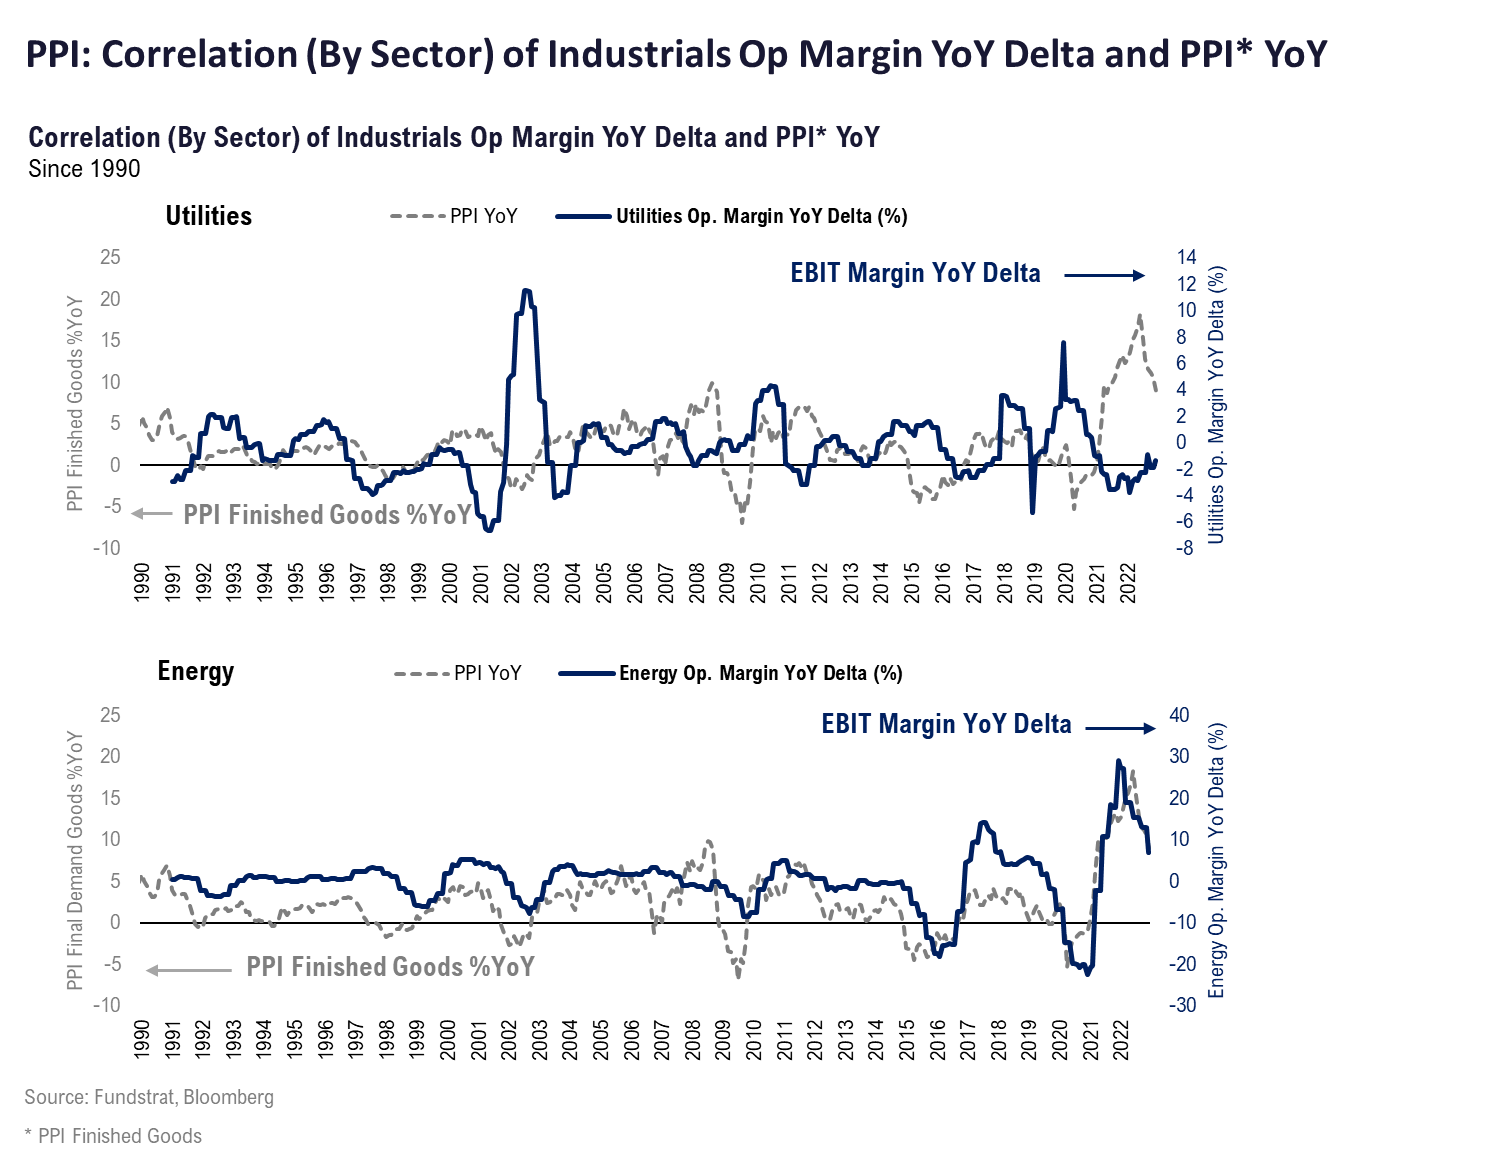
You can see the strength of the sector correlations below.
- Utilities margins actually seem to move opposite of PPI Finished Goods, which makes sense given energy is a key input cost (and energy is a driver of PPI)
- Conversely, Energy EBIT and PPI Finished Goods move essentially in tandem
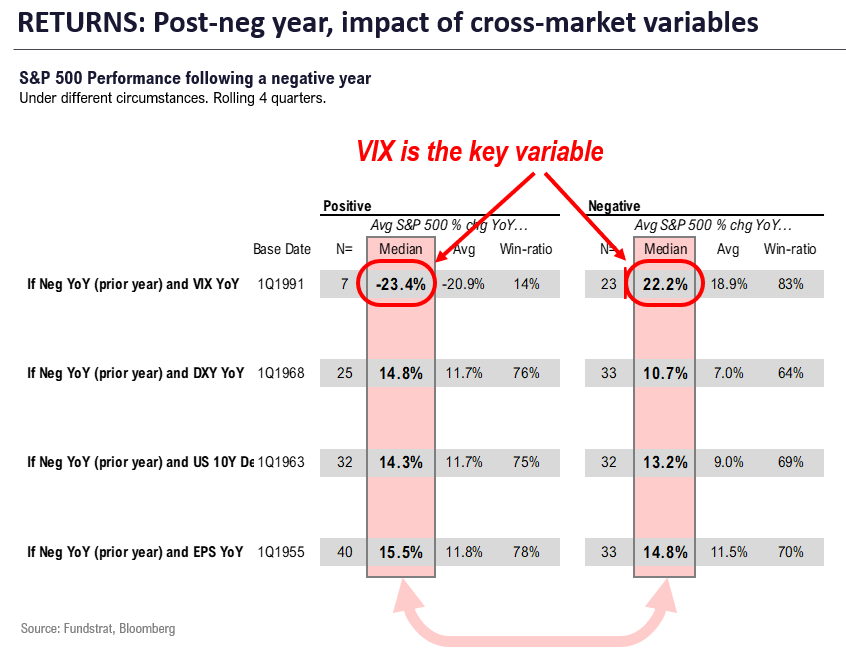
STRATEGY: VIX matters far more for 2023 returns than EPS growth
Our data science team compiled the impact on 2023 equity returns from variables:
- S&P 500 post-negative year (2022)
- the varying impacts of
- VIX or volatility
- USD change
- Interest rates
- EPS growth
- All of the 4 above, positive or negative YoY
- Data is based on rolling quarters and summarized below
The surprising math and conclusions are as follows:
- most impactful is VIX
- Post-negative year (rolling LTM)
- if VIX falls, equity gain is 22% (win ratio 83%, n=23)
- if VIX rises, equity lose -23% (win ratio 14%, n=7)
- I mean, this shows this all comes down to the VIX
- EPS growth has little impact
- If EPS growth is negative YoY (likely), median gain +14.8% (win-ratio 70% n=33)
- If EPS growth is positive YoY, median gain is 15.5% (win-ratio is 78%)
- Hardly a sizable bifurcation
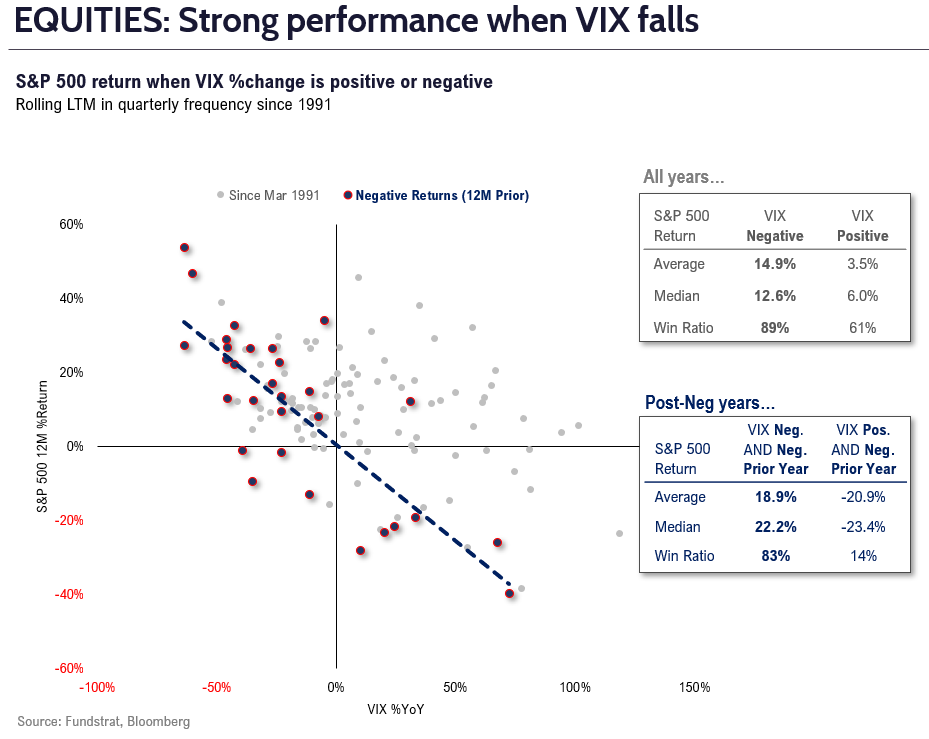
As the scatter below highlights, we can see the sizable influence of the VIX. Even in all years, the VIX is a key factor:
- in our view, if inflation falls sharply
- and wage growth slows
- Fed doesn’t have to cut, but this is a dovish development
- we see VIX falling to sub-20
- hence, >20% upside for stocks
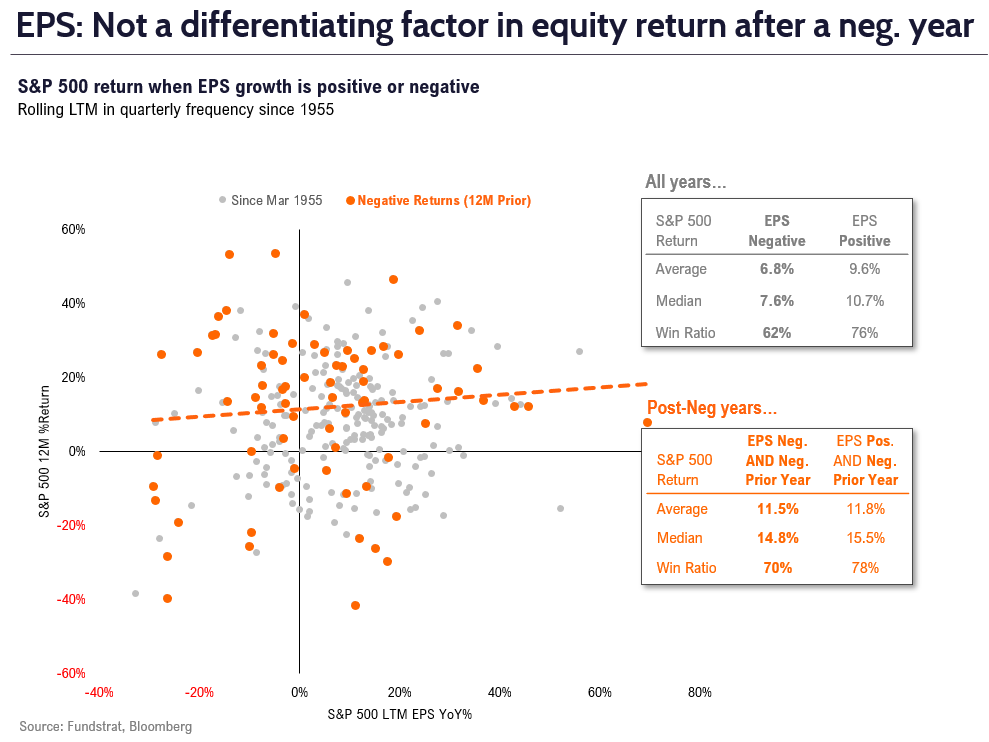
And as shown below, EPS growth has a somewhat important correlation, but hardly as strong as VIX changes.
- the difference in median gain is a mere 70bp (positive vs negative) post-negative year
- the importance of EPS growth is stronger in other years
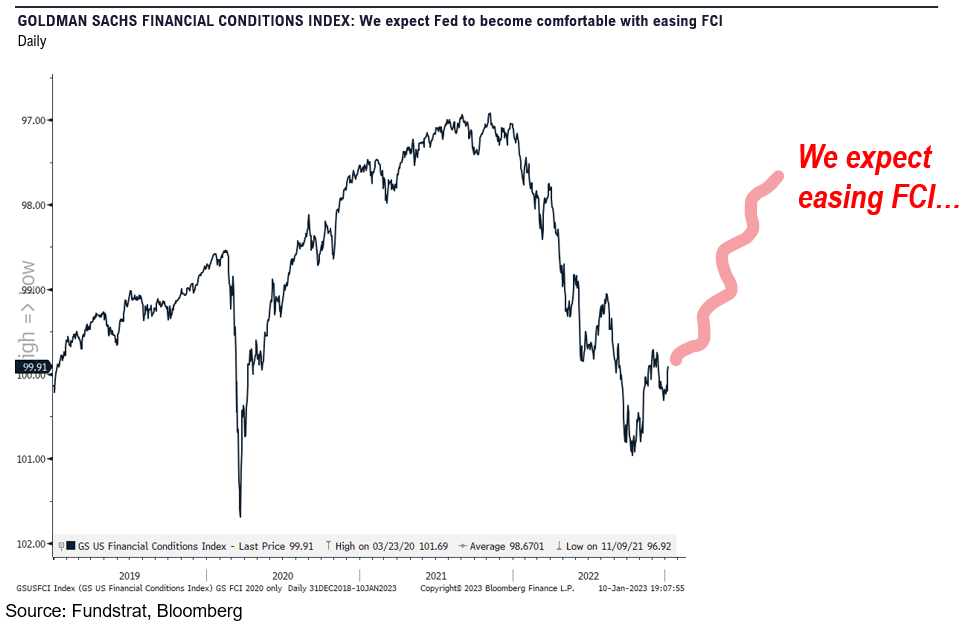
STRATEGY: Financial conditions should ease in 2023, driving higher equity prices. Technology, Discretionary and Industrials levered to easing FCI
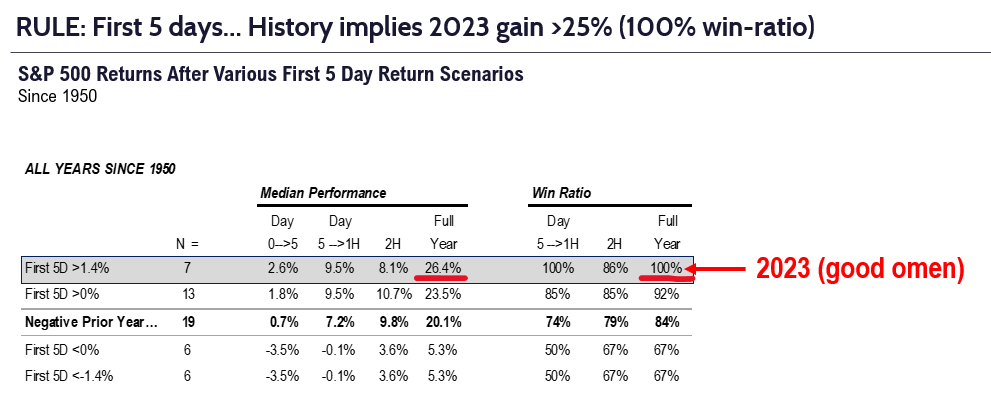
The “base” case for 2023 should be below. That stocks gained >1.4% in the first 5 trading days, and this portends strong gains for the full year:
- Post-neg year + up >1.4% on first 5 days
- Day 5 to first half median gain is 9.5%
- Full year median gain is 26%, implies >4,800 S&P 500
- 7 of 7 years saw gains.
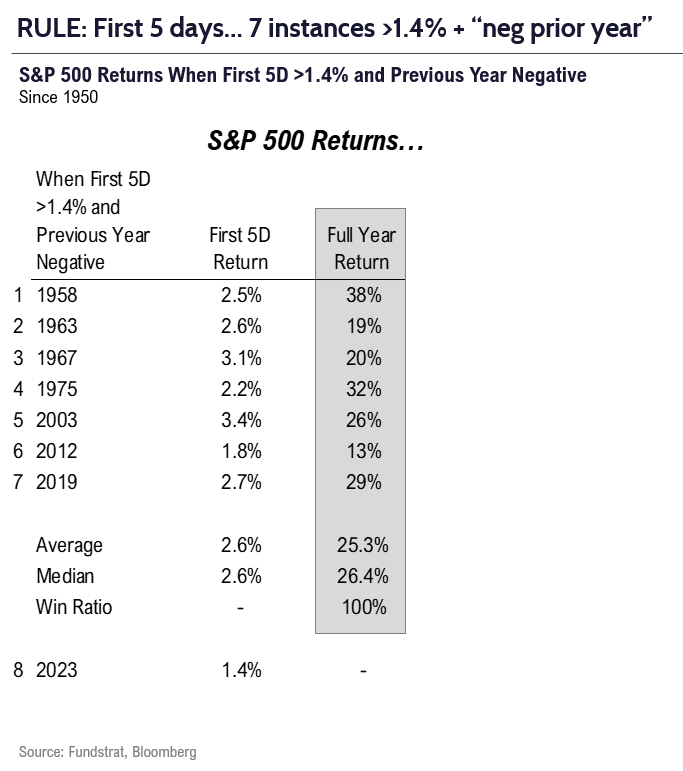
Those 7 precedent years are shown below.
- the range of full year gains is +13% to +38%
- so, this is a VERY STRONG signal
- the two most recent are 2012 and 2019
- we think 2023 will track >20%
The path to higher equity prices is discussed above:
- core inflation falling faster than Fed and consensus expects
- wage inflation is already approaching 3.5% target of Fed (aggregate payrolls)
- Fed could “dovishly” leg down its inflation view
- allowing financial conditions to ease
- bond market has already seen this and is well below Fed on terminal rate
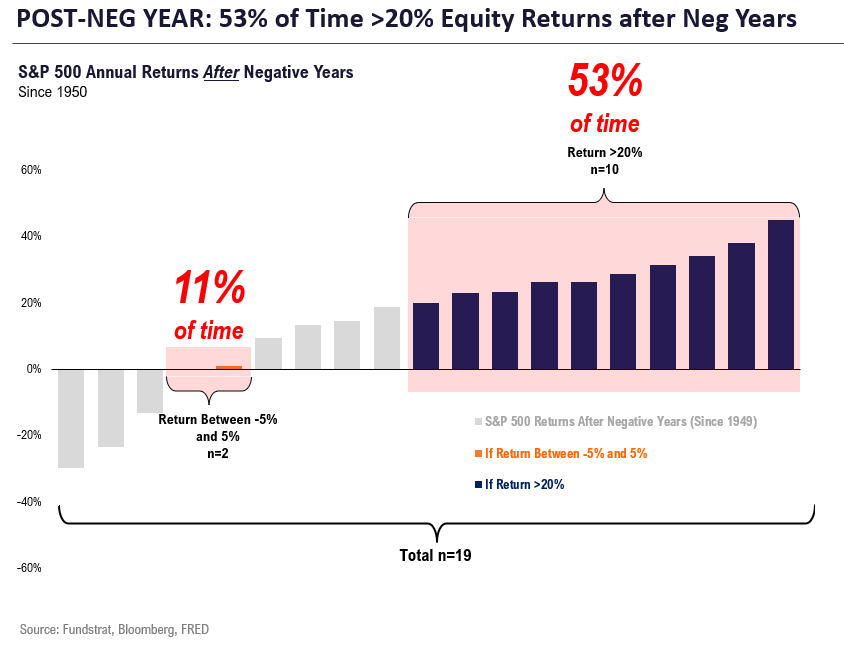
BASE CASE: The “maths” for what to expect in 2023, post a “negative return” year (2022)
Question: how common is a “flat” year? Our team calculated the data and it is shown below:
- since 1950, there are 19 instances of a negative S&P 500 return year. In the following year,
- stocks are “flat” (+/- 5%) only 11% of the time (n=2)
- stocks are up >20% 53% of the time (n=10)
- yup, stocks are 5X more likely to rise 20% than be flat
- and more than half of the instances are >20% gains
So, does a “flat year” still make sense?
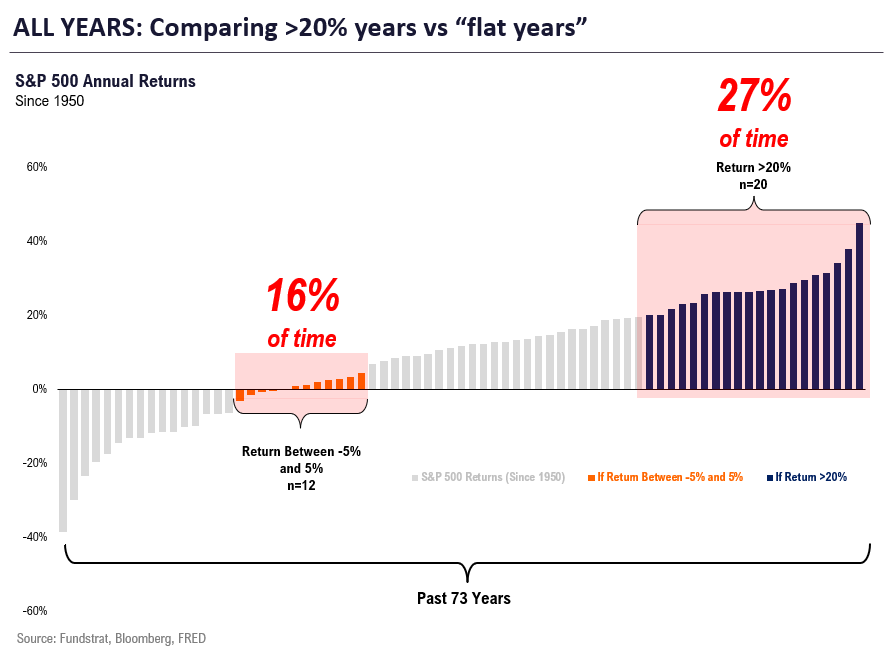
As shown below, these probabilities are far higher than compared to typical years:
- since 1950, based upon all 73 years
- stocks are “flat” 16% of the time vs 11% post-negative years — BIG DIFFERENCE
- stocks are up >20% 27% of the time vs 53% post-negative years — BIG DIFFERENCE
- see the point? The odds of a >20% gain are double because of the decline in 2022
_____________________________
37 Granny Shot Ideas: We performed our quarterly rebalance on 10/19. Full stock list here –> Click here
______________________________

