Even as 1Q2022 ends on a sour note, >90% probability that bottom for 2022 in. S&P 500 fell >6% below its 200D and closed >200D = 31 times since WWII = bullish signal

Click HERE to access the FSInsight COVID-19 Chartbook.
As many states are reducing the frequency of COVID-19 reports, we will only publish COVID-19 updates on Thursday.
Beginning this week, as COVID-19 data frequency has declined, we are modifying our publication schedule to publish three times per week.
Monday
SKIP TUESDAY
Wednesday
SKIP THURSDAY
Friday
STRATEGY: S&P 500 fell > 6% below its 200D and closed > 200D = 31 times since WWII = bullish signal
US is the “best house” in a bad neighborhood
As markets complete 1Q2022, it has been a bloody and treacherous 90 days. The macro environment has become decidedly hostile, with visibility on outcomes only emerging 3-6 months from now. Meaning, markets are still facing the same headwinds for the few weeks. These are apparent but let me recap:
– inflationary pressures are building
– current wave is commodity driven and amplified by Russia-Ukraine war
– Geopolitical risks remain high given the risk of Russia-Ukraine war expanding
– interest rates have risen, raising concerns of excess leverage
– Fed has gone into “full hawk” mode
– China is dealing with a major COVID-19 wave and threatens further supply chain issues
– yield curve has inverted
So, it is obvious that the macro environment is uncertain. Contrary to consensus views, Fundstrat had warned of a treacherous 1H2022 in our 2022 outlook (published in December 2021), but this is actually tracking slightly worse than we expected.
Yet, in the face of this, the S&P 500 is down only 5% YTD. This is impressive resilience, especially after declining more than 16% peak to trough (intraday) at the worst. At the nadir, the S&P 500 was discounting a 66% probability of a recession, so the key question from here is whether the US avoids a recession:
– bears will say, the slide YTD is just the start and worst yet to come <– easier case to make However, as we have highlighted in our recent notes, we believe the S&P 500 has been “whispering” bottom for some time. And with 1Q2022 behind us, we now assign a > 88% probability that the bottom for 2022 is in. Yup, we think the lows for the year have been made:
– we think lows for 2022 are in with > 88% probability
– we still see stocks in a “jagged” recovery in 1H2022
– full risk-on coming in 2H2022
– S&P 500 can exceed 5,100 before year-end
– key is avoiding a US recession <– we believe this is the highest probability
KEY REVERSAL: S&P 500 fell > 6% below its 200D and closed > 200D = 31 times since WWII = bullish signal
As our clients know, our investment process does not look solely at macro, but is reliant equally on quantitative (Adam Gould) and technical signals (Mark Newton). And recently, significant signal is generated by quantitative signals.
– most recently, the S&P 500 was 8% below its 200D moving average on 2/24 (day of invasion)
– and closed above the 200D on 3/22, about 1-month later
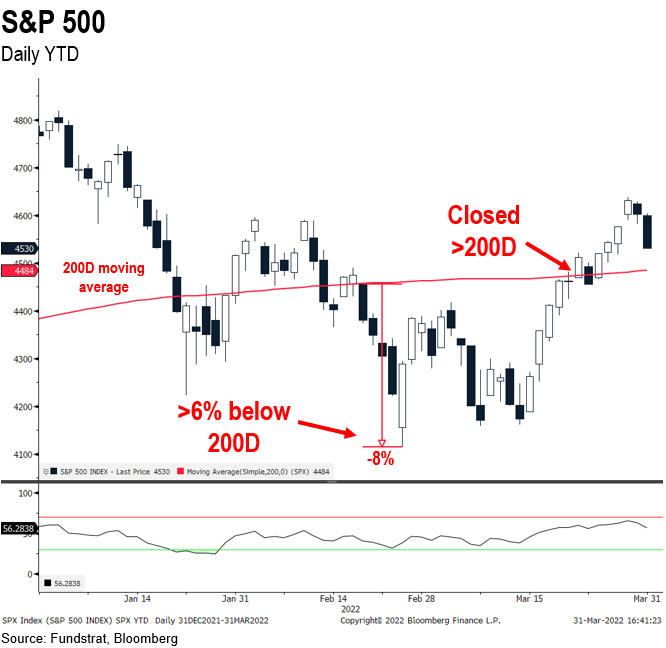
…> 90% probability the low is in for 2022
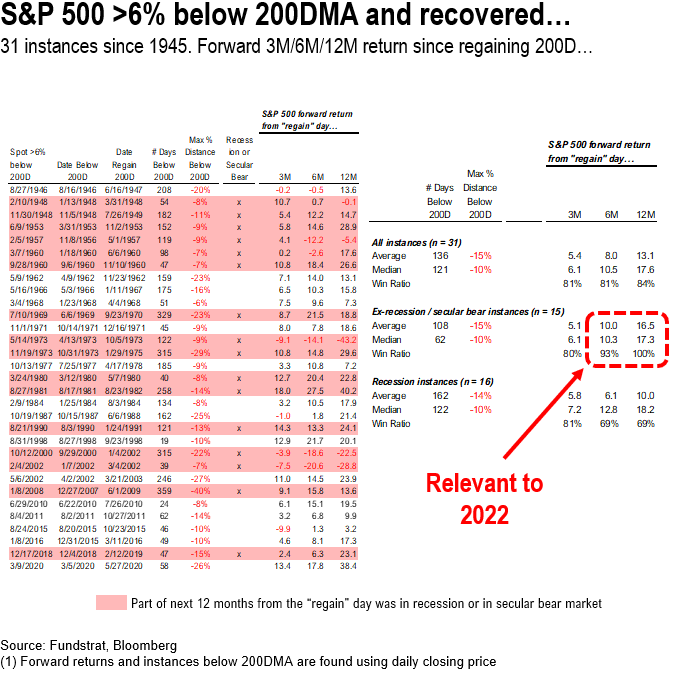
This is actually a bullish signal. Take a look at the table below
– this has happened 31 times since WWII
– 15 times when US not in recession at time of signal (ala Thursday)
– 14 of 15 times, S&P 500 higher 6M later, median return 10%
– 15 of 15 times, S&P 500 higher 12M later, median return 17%
– even if there is a recession eventually underway
– 12M median return (n=16) 18%
So, this recovery in equities to close above 200D generates quite a lot of positive signal.
…forward end-path is positive, but still can expect “jagged” treachery for next few months
Below is the forward return of the S&P 500 during those 15 precedent instances:
– two most recent periods
– March 11, 2016
– May 27, 2020
– recall, both excellent entry points for equities
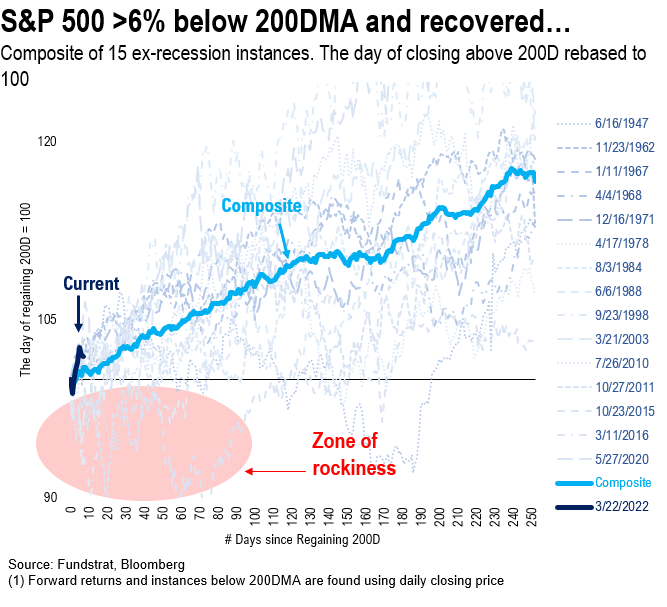
But this does not mean stocks cannot have a drawdown. As this chart shows, there is a “zone of rockiness” over next 3-4 months, but the path 6M and 12M forward is positive.
– this signal was generated on 3/22/2022
– so plenty of upside ahead
This also affirms why we expect S&P 500 to still manage to close above 5,100 before year end. I realize this sounds like a tall order.
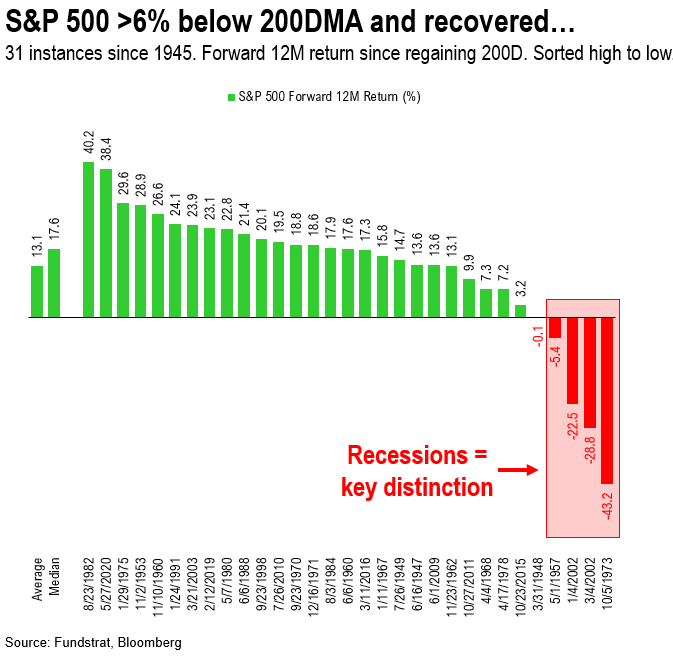
In case one of wonder what the distribution of 12M returns look like with all 31 instances (15 ex-recession and 16 with recession).. The 12M returns are shown sorted best to worst.
– the distribution of returns if favorable
– 4 instances saw terrible 12M returns
– these are 2002 (twice), 1957 and 1973
– all while US economy is in a recession or deep in a bear market
If one is convinced a bear market is ahead, or a recession, then these 4 of 31 instances is applicable. I cannot rule out a bear market or recession. But this is the unknown.
S&P 500 is the “best house in a bad neighborhood”
The macro picture is challenged. There is no way to say things are absolutely hitting on all cylinders — the exception is anyone in the Energy sector. But as our clients know, Energy was our top pick in 2021. And our top sector pick for 2022. We have not spoken about Energy as forcefully in the past few weeks, but that is because many stocks are already up 50% or more YTD.
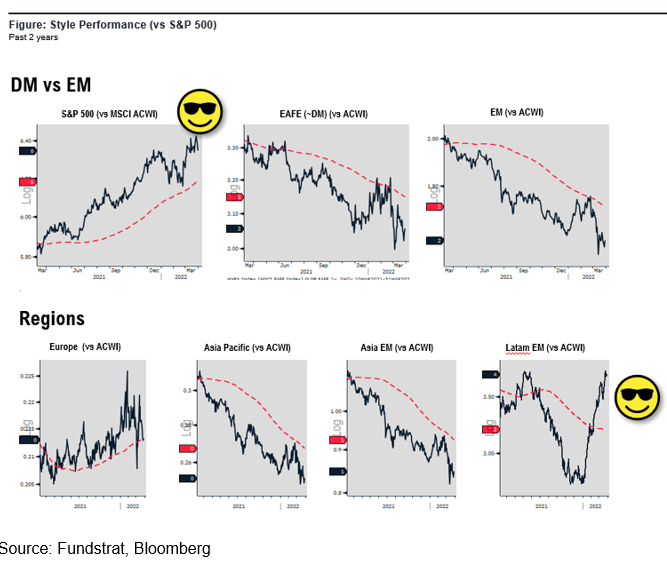
– US, however, has been the standout of regions YTD
– Latin America performed well, due to the regions pro-commodity exposure

As shown below, the strongest regional performance YTD has been USA and Latin America.
– In fact, Europe and EM have been awful.
– this is a reminder that “cheap” valuation is hardly a reason to allocate
– US still has the best companies and is the most liquid market
– Latin America has the benefit of being so pro-commodity in its exposure
We still favor USA over rest of world for the rest of the year.
COVID: Still a few positive catalysts in USA, China midway through Omicron scourge
As for COVID-19, there are a few incrementally positive developments in the US. These are policy changes, not case trends. Case trends are still inching upwards in the US, but there has not been any rise in hospitalization. In short:
– cases are picking up in the US due to BA.2 (new Omicron) = net slightly positive
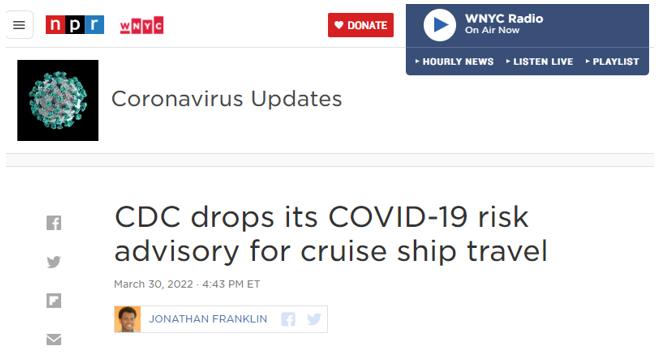
– US policymakers easing restrictions further on cruises = positive
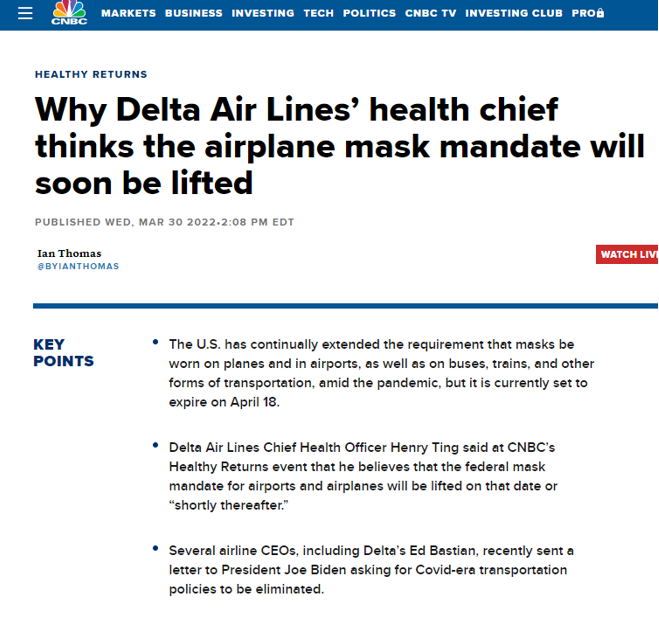
– Delta Airlines expects mask restrictions to be lifted 4/18 = positive
– Europe and Asia still facing major waves = problem there
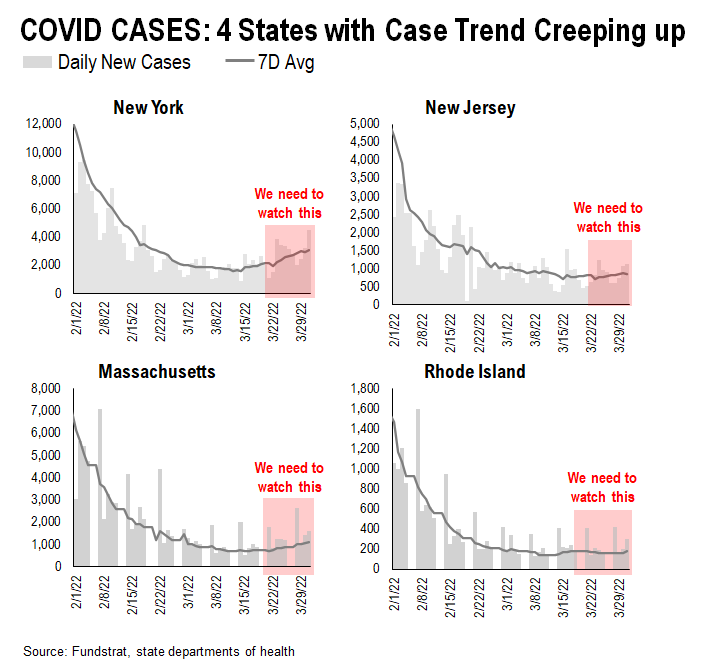
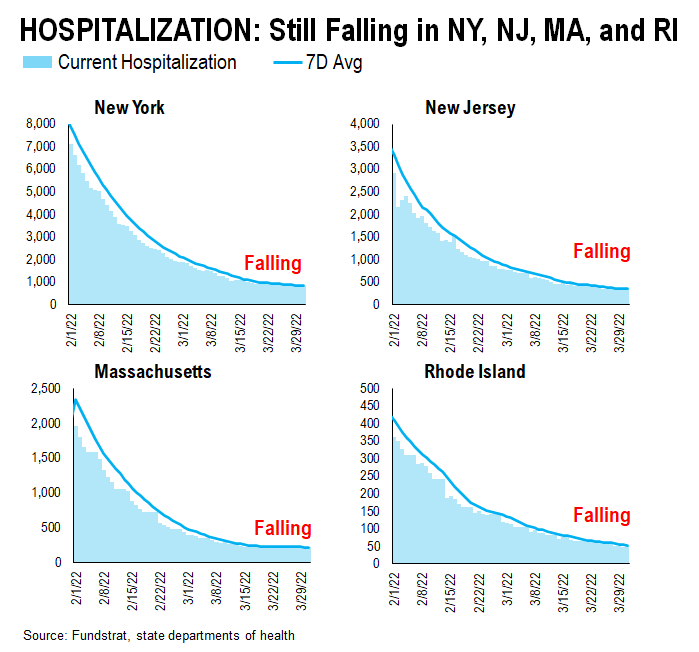
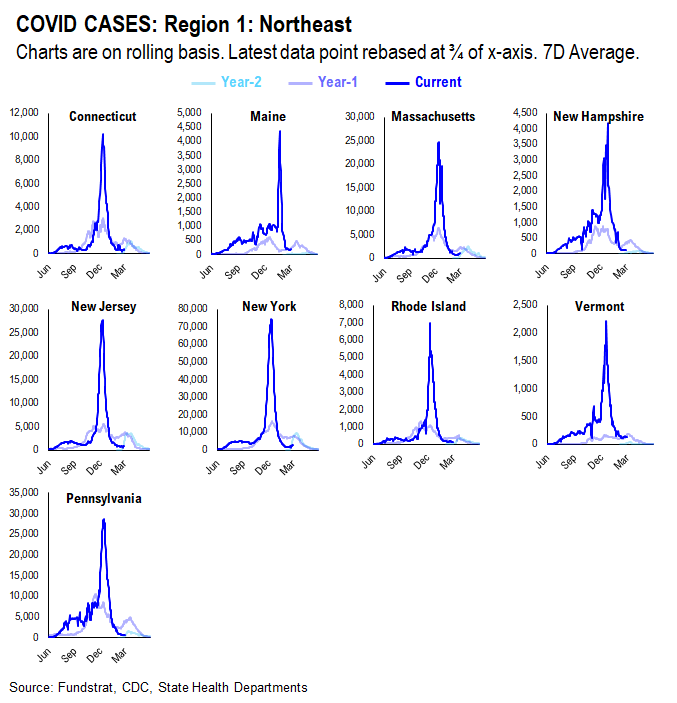
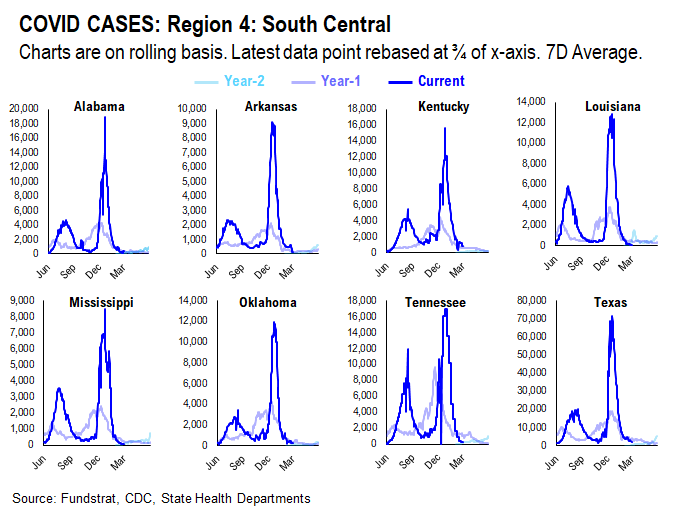
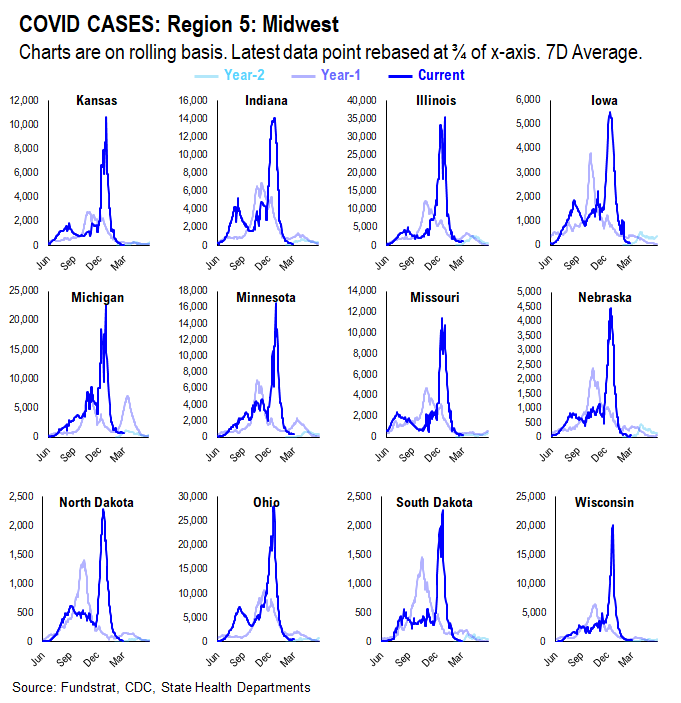
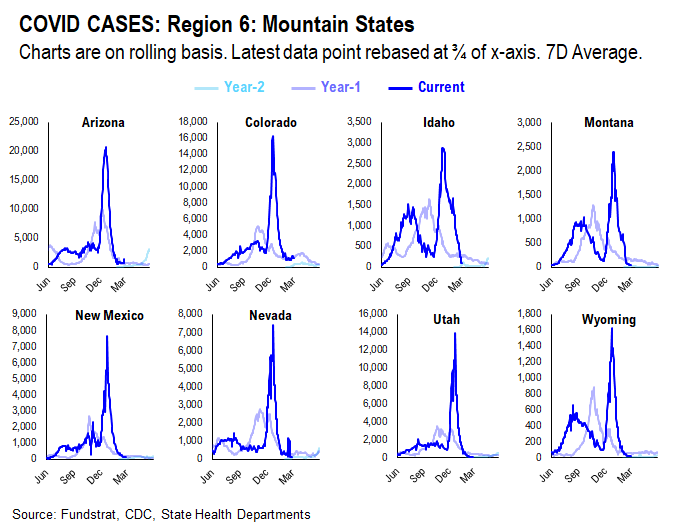
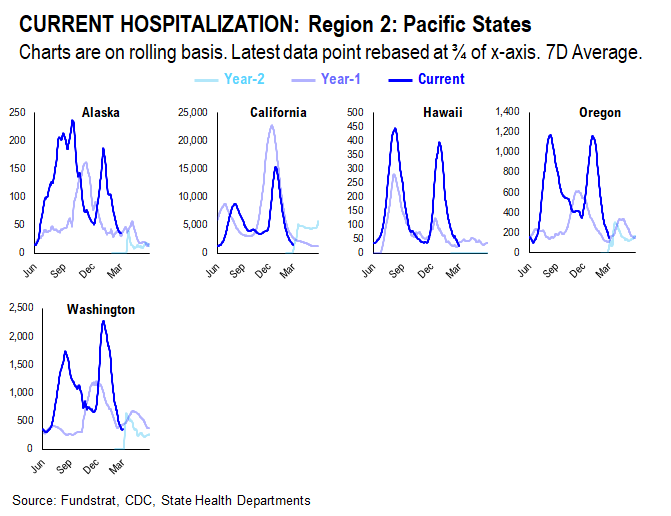
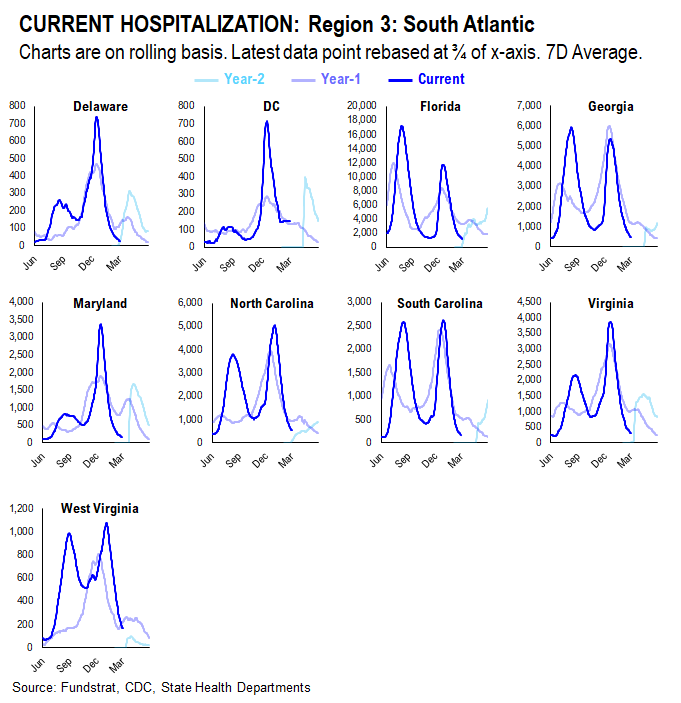
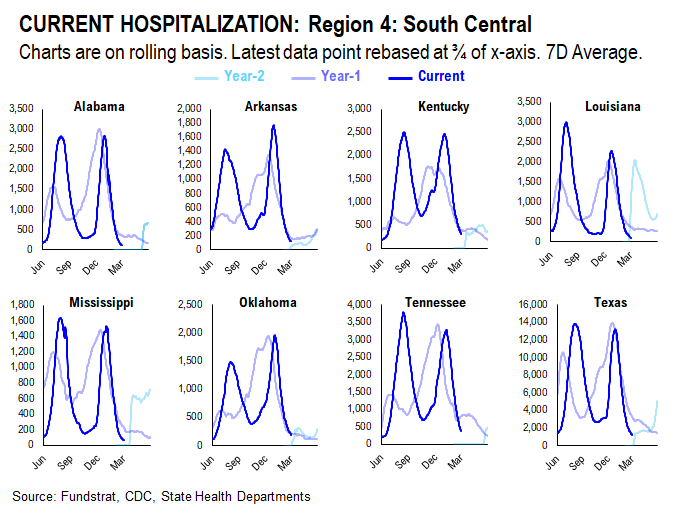
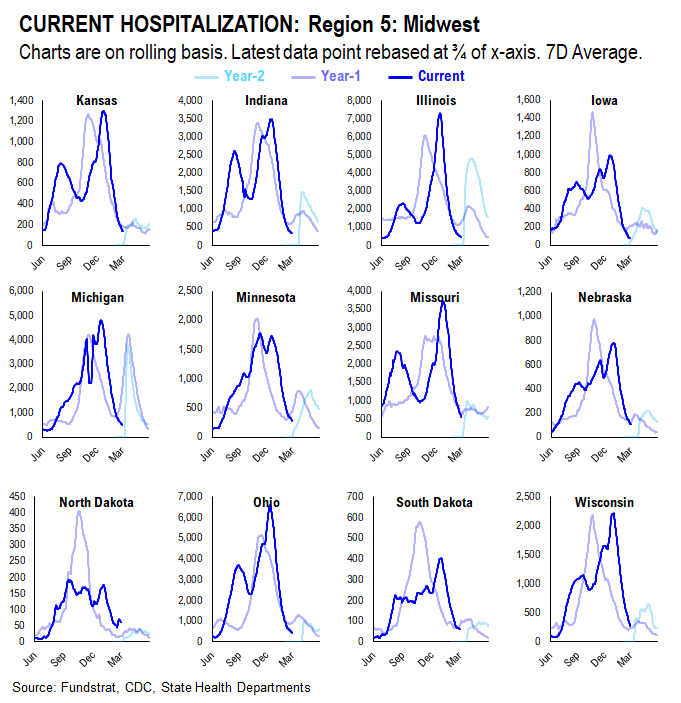
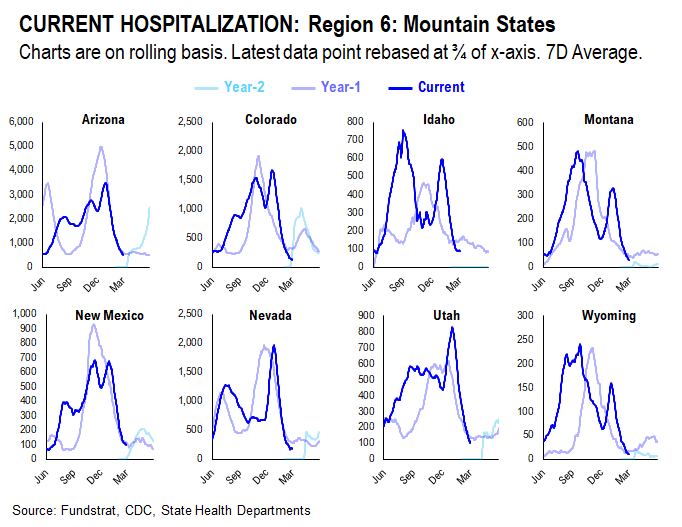
Case trends in the 4 states where cases first started creeping up are sort of still creeping higher. It is hardly a surge like other waves.
– and hospitalizations are still muted and actually still falling
And for USA overall, the case trends, when compared to same day of the prior weeks, are no longer showing declines. Essentially, case trends nationally look to be flattening. This is evident looking at the last two days:
– cases are up in the past two days compared to the same day a week ago
– but 7D average of cases is 25,000
– this is a huge improvement compared to the nearly 800,000 seen in early January
– so, without a doubt, COVID-19 has made a massive retreat in the US


…return to normal –> CDC removes cruise warning advisory and Delta Air Lines expects TSA to lift mask mandate
One of the first industries to suffer under severe COVID-19 restrictions is the US cruise industry. The restrictions and negative headlines crippled the business but the CDC has now lifted those risk advisories.
And Delta Airlines Chief Health Officer, recently told CNBC that he expects the mask mandate to be lifted soon after 4/18. This is more relevant as more Americans fly than cruise. And masks on flights is generally viewed as inconvenient, albeit a federally required TSA rule.
– several airline executives have sent letters to the TSA and White House requesting these restrictions are eliminated
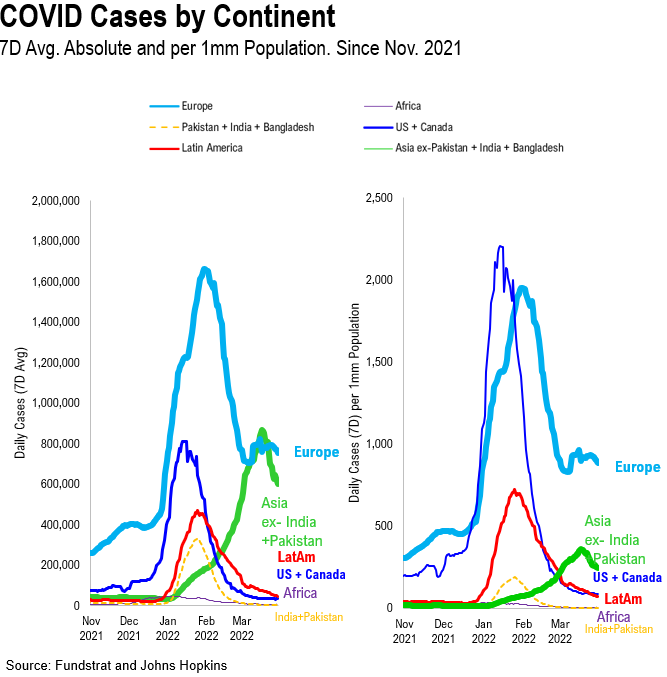
Europe and Asia still seeing pandemic level case counts…
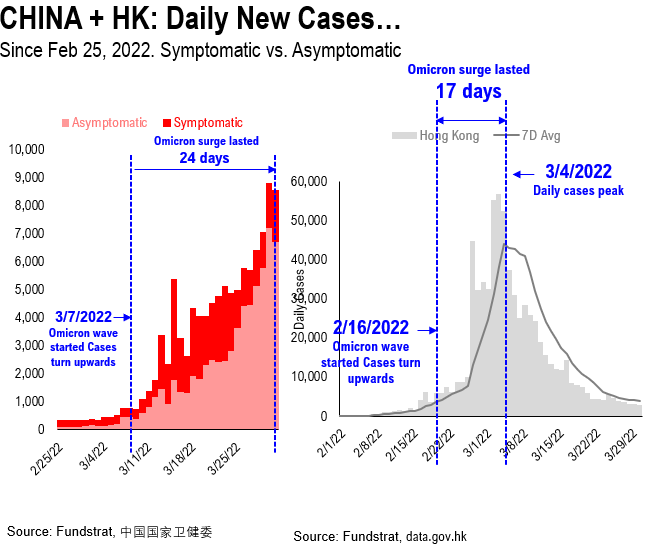
There are still over 1.5 million daily global cases of COVID-19. So while it has largely disappeared from the mindshare of the US, it is still a big issue in Asia and Europe. And as shown below
– case trends are hardly improving in Europe
– Asia still has a high level of cases
– the best trends are in USA and Latin America
Coincidentally, USA and Latin America also have the best performing equity markets YTD. Of course, the surge in China is worrying many economists and investors, since there is a potential for further supply chain disruptions.
As you can see, China is 24 days into its surge. China’s policy approach and vaccination status differs from other regions. But as shown below, China’s surge has taken longer to apex. In fact, cases are still rising in China. It is obviously a far larger region than HK with many more cities. So this could continue for months.
STRATEGY: We lean “bullish” into 2Q2022, but warn of jagged next few months… Stick with BEEF
To recap on equity strategy, we are leaning bullish into 2Q2022.
– this is in context to a challenging 1H2022
– so jagged next 3 months
– but > 88% probability that bottom for 2022 is in
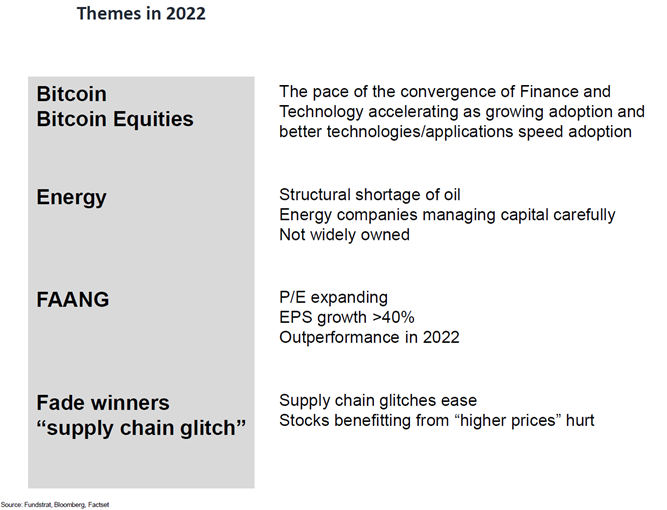
Broadly, our existing sector strategy of BEEF remains valid. Even in war. Even with inflation. In fact, the last few weeks are strengthening the case for our “BEEF” strategy. That is, BEEF is
– Bitcoin + Bitcoin Equities BITO1.04% GBTC1.04% BITW1.27%
– Energy
– FAANG FNGS-4.09% QQQ-2.08%
Combined, it can be shorted to BEEF.
Why is this making stronger BEEF?
– Energy supply is now a sovereign priority
– this helps Energy stocks
– Ukraine and Russia both want access to alternative currencies
– this strengthens case for Bitcoin and bitcoin equities
– if Global economy slows, growth stocks lead
– hence, FANG starts to lead FB AAPL-1.22% AMZN-2.56% NFLX-9.18% GOOG-1.30%
All in all, one wants to be Overweight BEEF
_____________________________
33 Granny Shot Ideas: We performed our quarterly rebalance on 2/3. Full stock list here –> Click here_____________________________
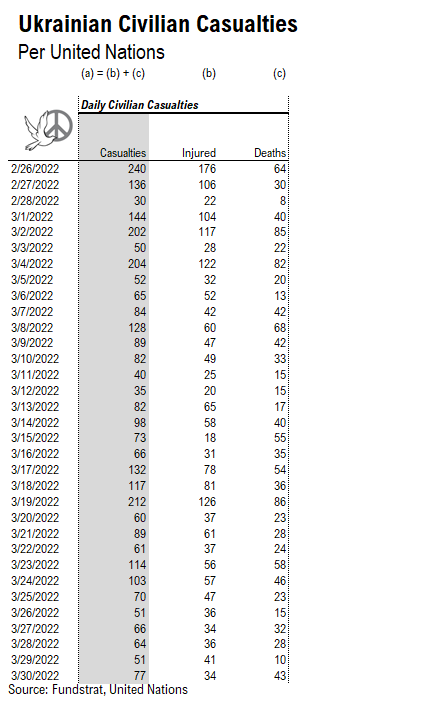
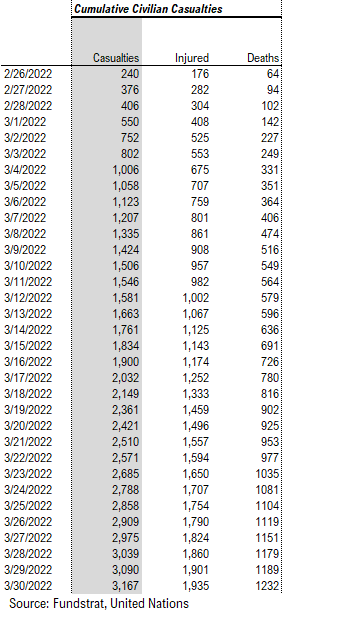
DATA ON RUSSIA-UKRAINE WAR: Tracking Russia-Ukraine war statistics — 3,167 Ukrainian civilian casualties so far
Our data science team, led by tireless Ken, is scraping data from several sources to track some high level data around the Russia-Ukraine war.
– Ukrainian civilian casualties
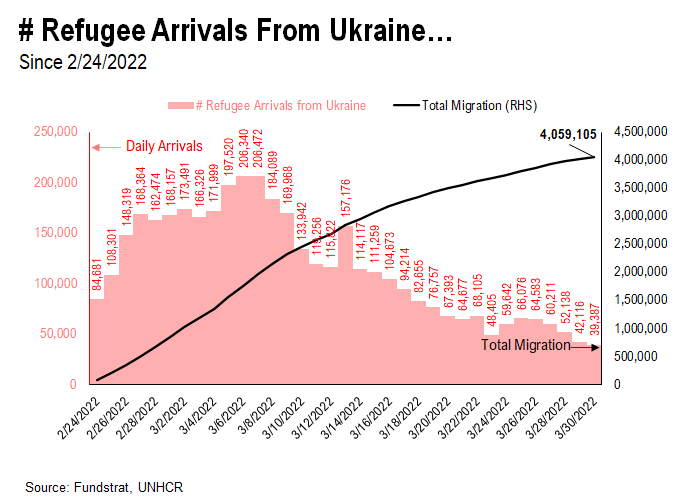
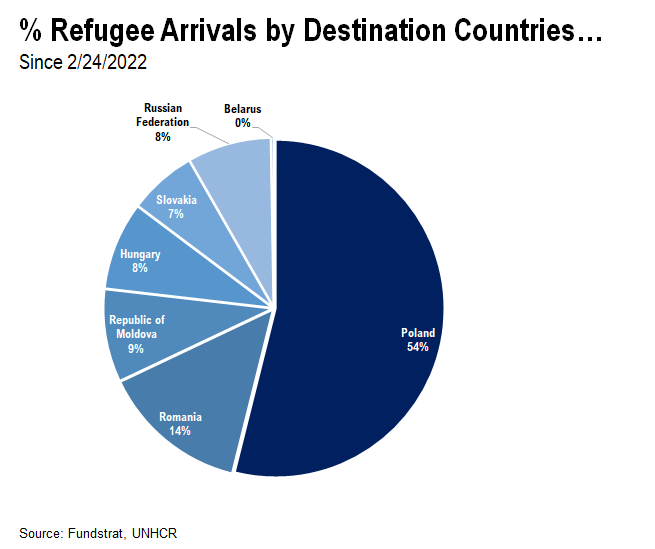
– Ukraine population movements
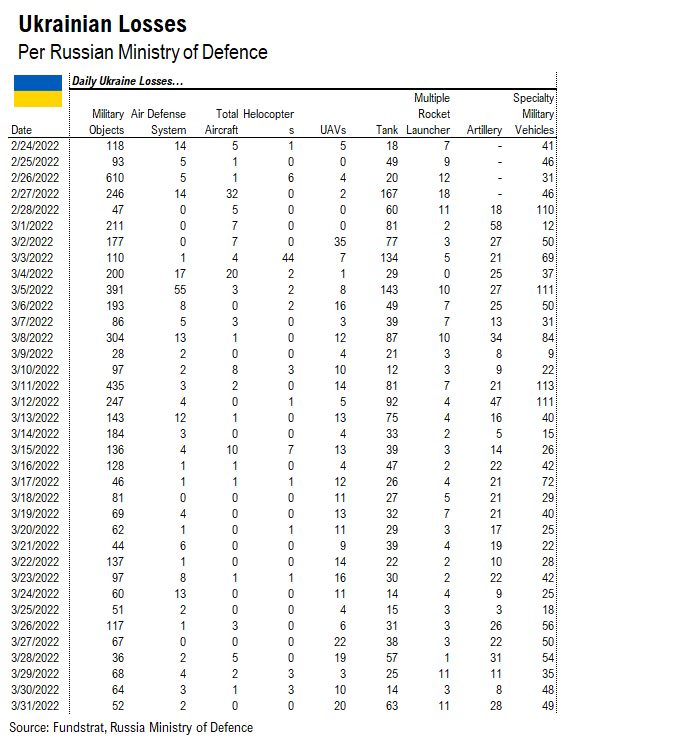
– Ukrainian military losses, except personnel
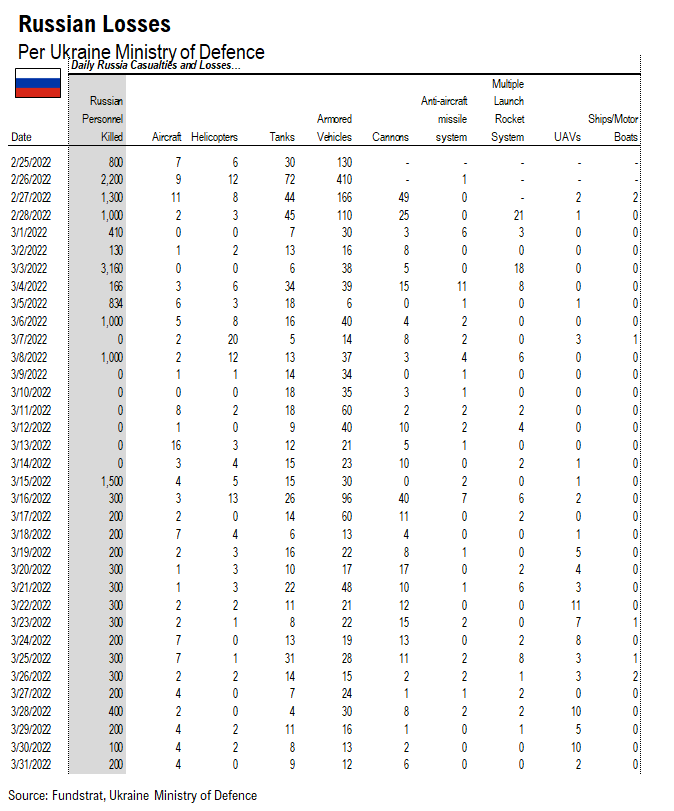
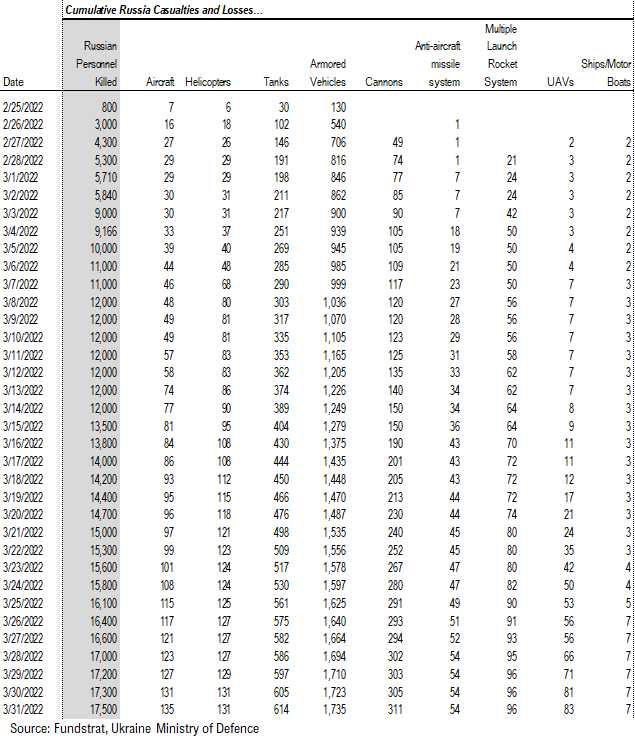
– Russian estimated losses of personnel and material
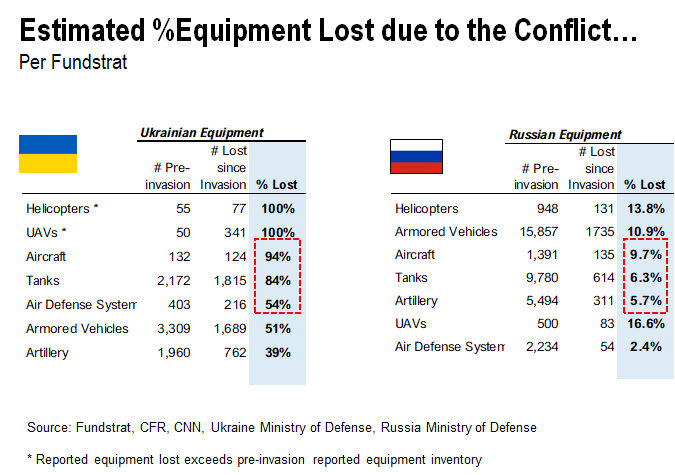
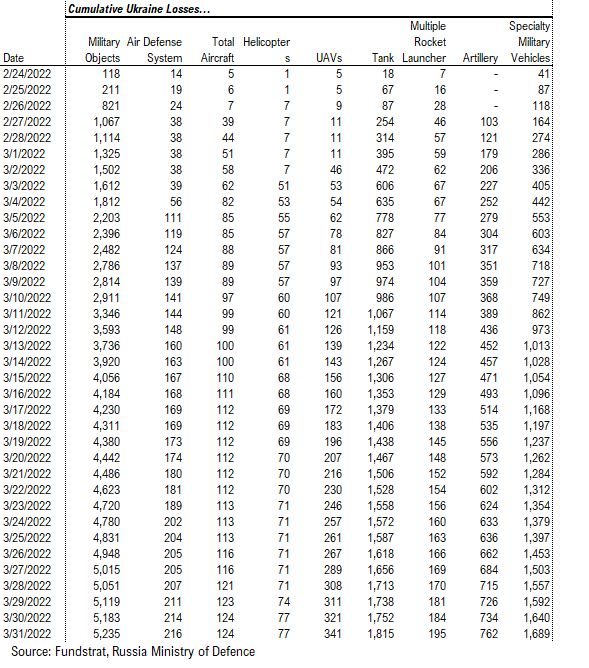
Ukraine has lost an estimated 84% of its tanks and 94% of its aircraft
Our data science team, led by tireless Ken, has been tracking the casualties and losses associated with the Russia-Ukraine war. And while Ukraine has staged an impressive resistance, the reported losses of equipment show that Ukraine has lost a substantial share of its equipment:
– by our team’s analysis, using reported data
– Ukraine has lost 1,815 tanks or 84% of its equipment
– Ukraine has lost 124 aircraft, or 94% of its fleet
By these measures, the armament of that army is rapidly depleting. I am not sure if this is a well known fact. But this also highlights why the nation is seeking to replenish its equipment.
With each passing day, Ukraine is experiencing further losses of critical equipment.
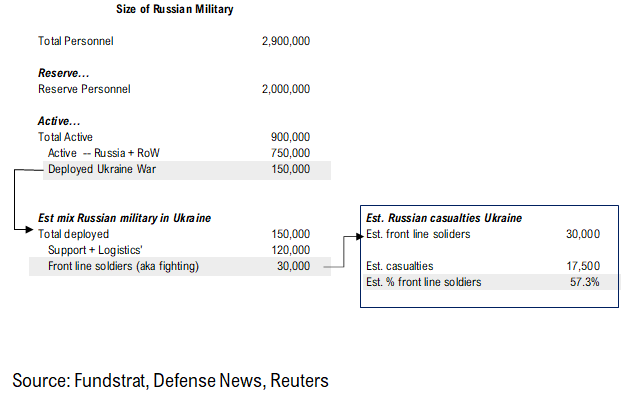
When we hear Russia has deployed 150,000 soldiers in Ukraine, this is not 150,000. As many military people know, for every front-line soldier, there are 4 support soldiers:
– 1 frontline soldier
– 4 support, fuel, ammo, logistics, supply lines, etc, cooks
Thus, if there are 150,000 Russian soldiers in Ukraine, about 30,000 are doing the actual fighting.
– Using data from Ukraine’s Ministry of Defence, estimates of Russian casualties are about 17,500
– Presumably these are front-line soldiers
– Unless Ukraine soldiers are “attacking from behind” and hitting supply lines
This implies over 50% of the frontline soldiers are casualties.
The number of casualties is 77 on 3/30, and a total of 3,167 have been reported to the UN.
The flow of migrations out of Ukraine had been steady at about 100,000 to 200,000 per day, but continues to gradually decline and is now around 40,000 per day. And a total of 4.1 million have fled so far.
– 54% are entering into Poland
– curiously, 8% or 350k or so, have entered Russia
If one is wondering about reported losses of equipment, we are citing statistics provided by the opposing ministry officials.
– est. 124 Ukraine planes lost
– est. 1,815 tanks lost
– this seems like a lot of equipment
Russian losses are higher
– est. 17,500 Russian soldiers killed
– est. 614 tanks
– est. 135 aircraft
– est. 1,735 armored vehicles
Our team says this data is scraped and can be updated daily. So, we will post these figures for now. And that way, we can get a sense for the intensity of the hostilities.
Thomas Hu, of Kyber Capital, also shared this website which is a crowd sourced view of reported activities. There is a lot to the website, and I encourage you to check it out. The website URL is https://maphub.net/Cen4infoRes/russian-ukraine-monitor
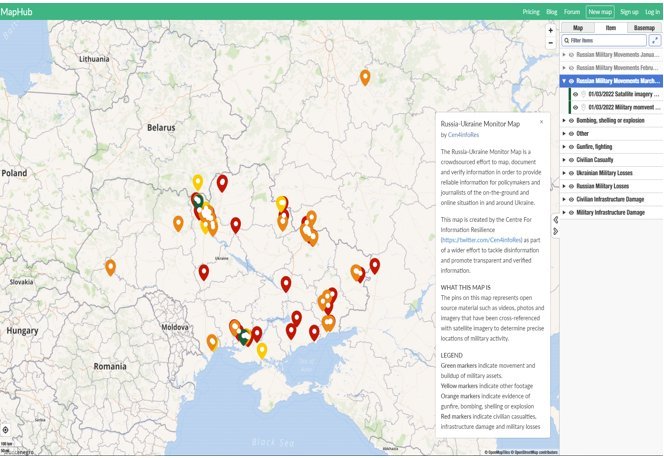
For instance, if you click on one of the icons, a verified post is shown. There is geolocation and other data attached.

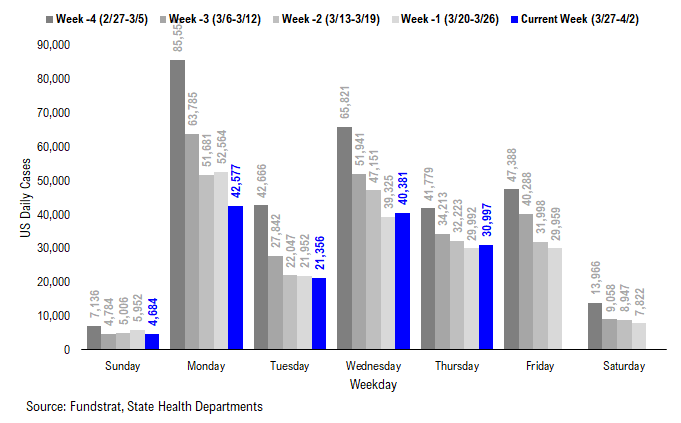
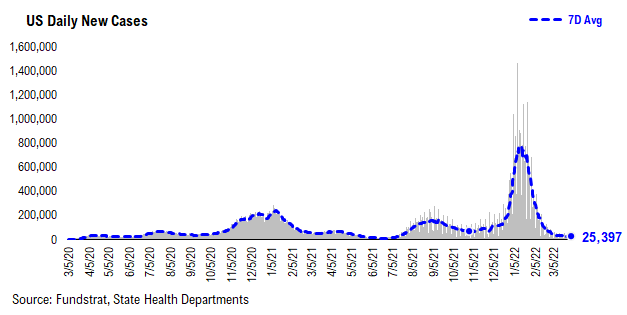
POINT 1: 7D Avg daily COVID-19 cases 25,397, down -1,851 vs 7D ago…
Current Trends — COVID-19 cases (past 7 days vs. 7 days prior):
– Total new cases 177,776 vs 190,730 7D prior, down -12,954
– Avg daily cases 25,397 vs 27,247 7D prior, down -1,851
– 7D positivity rate 3.4% vs 3.6% 7D prior
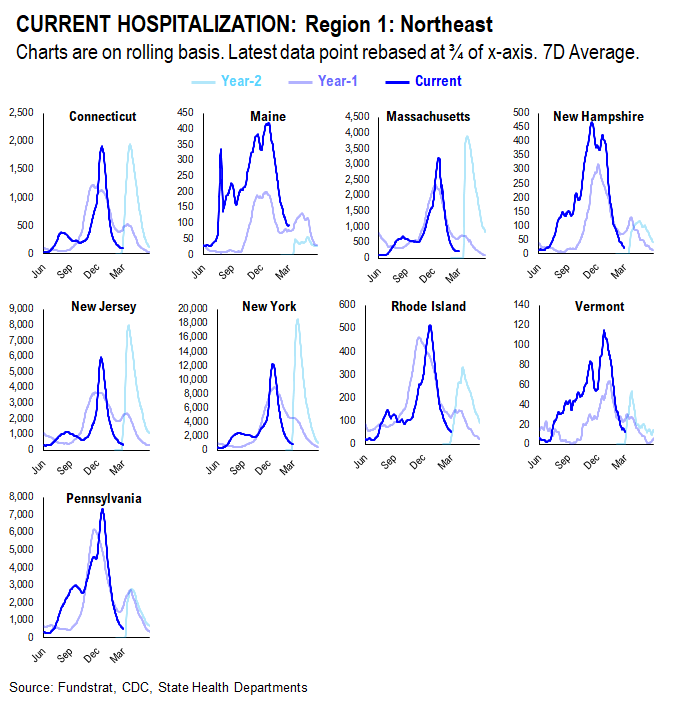
– Hospitalized patients 12,971, down -17% vs 7D ago
– 7D Avg daily deaths 667, down -20% vs 7D ago
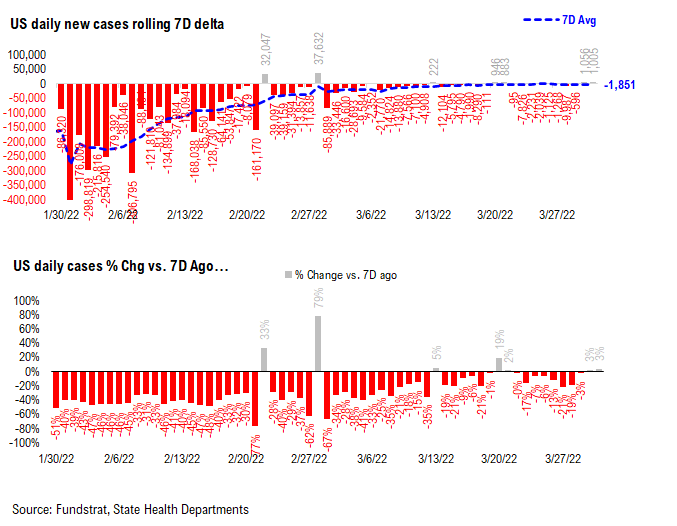
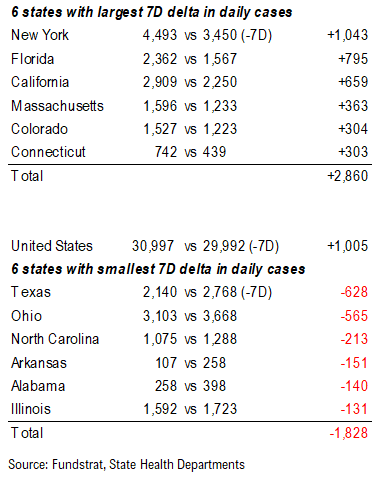
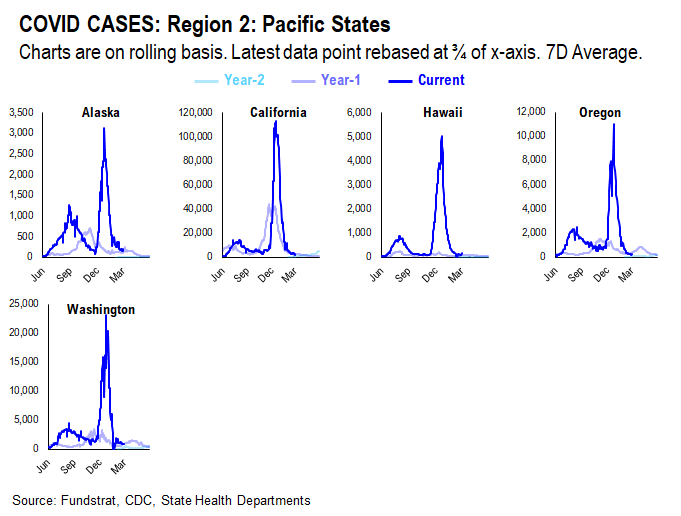
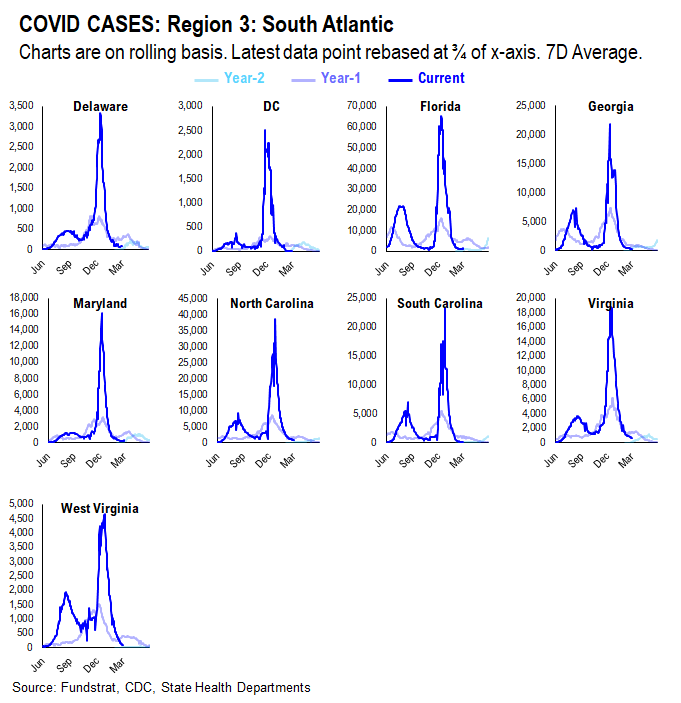
Over the past 7 days, a total of 177,776 new cases (avg 25,397 per day) were reported by the state departments of health, down -12,954 (on average down -1,851 per day) compared to 7 days prior. The number of new cases is still declining (slowly). But the 7D delta in daily cases has turned positive over the past two days. The overall case trend is somehow in no man’s land – the majority of states are still seeing cases fall slowly. But as BA2 now becomes the dominant strain in the US, we see the daily cases in some states, such as NY, NJ, MA, RI, CO, start to tick up. But the good news (at least for now) is that the hospitalization rate is still plunging. In fact, the number of COVID patients who are currently hospitalized is near the all-time low. Even for the 5 states that we are tracking closely, the current hospitalization remains downwards. Hence, we are not too worried about the case trend at this moment. By the way, as the weather gets warmer, case levels also tend to be lower based on what we have observed over the past two years. See Point 3 for more details on the “COVID seasonality”.
7D delta in daily cases has been flat-ish…The 7D delta in daily cases has been slightly below zero for most days over the past 2-3 weeks but has turned positive over the past two days. The overall trend has been stable – it shows that BA2, the dominant COVID strain now in the US, has not caused the case trend to really surge. But the future is uncertain, and it takes time to build up momentum for a new wave. We will track the change in conditions closely.
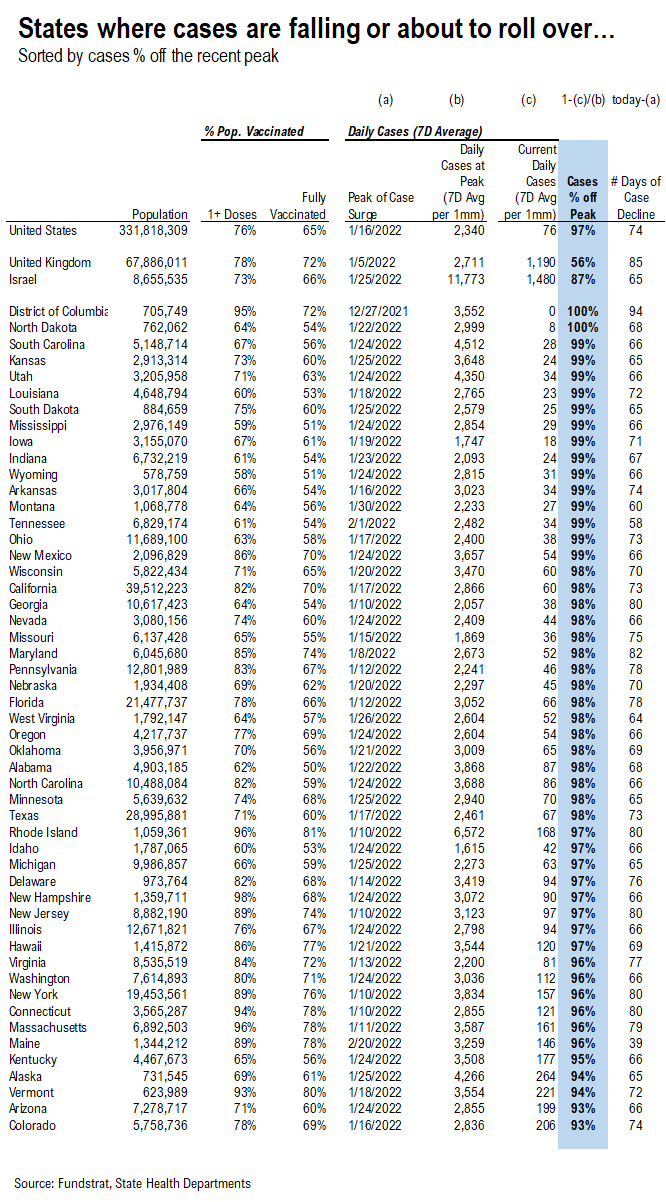
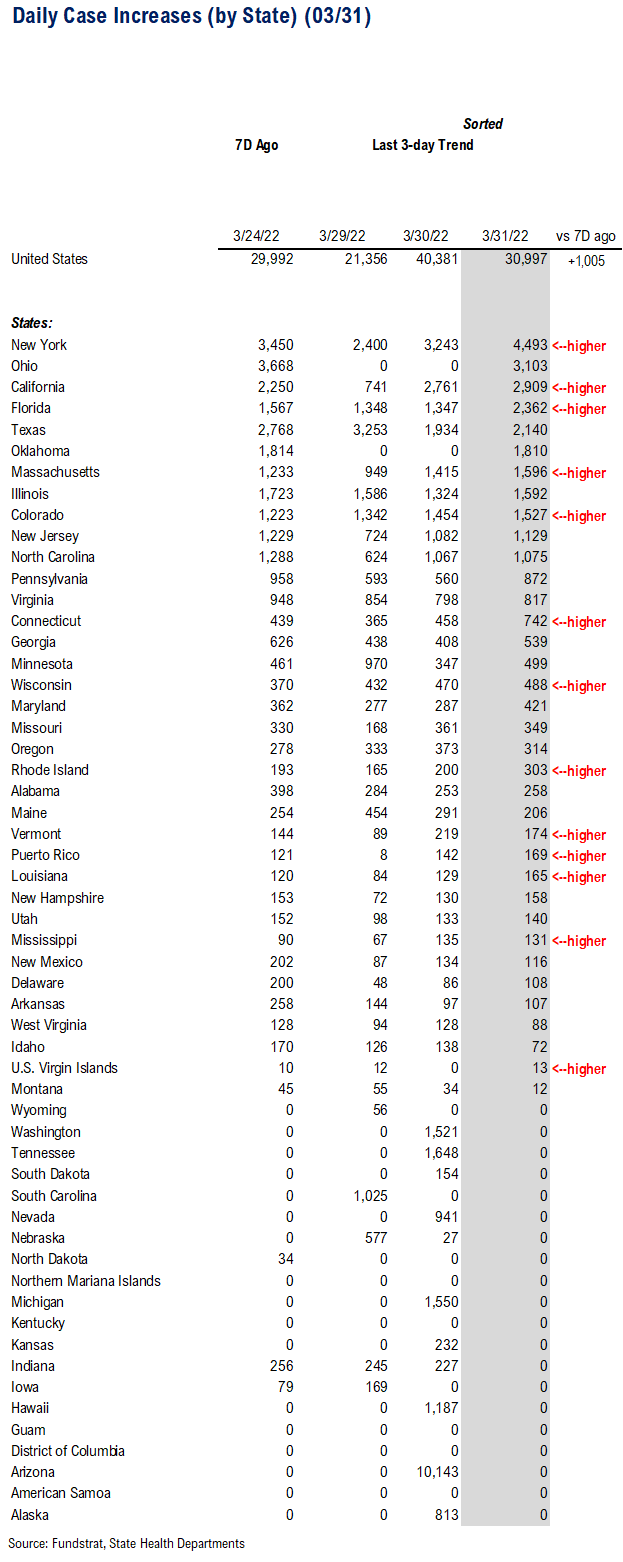
All US states are seeing decline in daily cases now… 50 states have seen daily cases fall over 90%…
*** We’ve split the “Parabolic Case Tracker” into 2 tables: one where cases are falling (or about to fall), and the other where cases are rising (currently all states are seeing cases “falling”. Although case figures in some states (NY/NJ/MA/RI) seem to be edging up recently, it is still early to make definitive call on the case trend in these states)
In these tables, we’ve included the vaccine penetration, case peak information, and the current case trend for 50 US states + DC. The table for states where cases are declining is sorted by case % off of their recent peak, while the table for states where cases are rising is sorted by the current daily cases to pre-surge daily cases multiple.
– The states with higher ranks are the states that have seen a more significant decline / rise in daily cases
– We also calculated the number of days during the recent case surge
– The US as a whole, UK, and Israel are also shown at the top as a reference
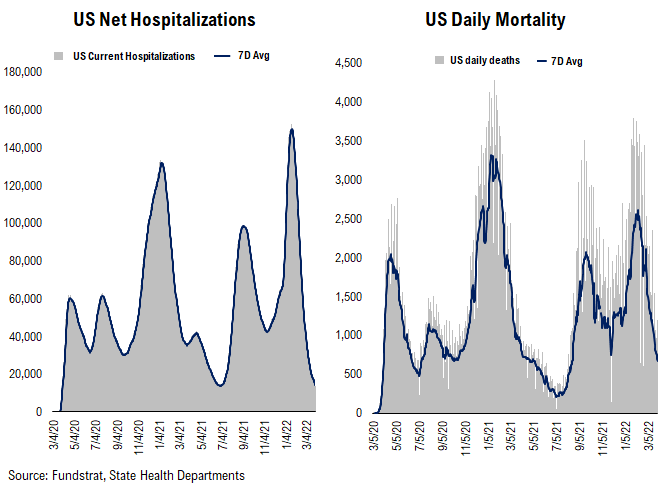
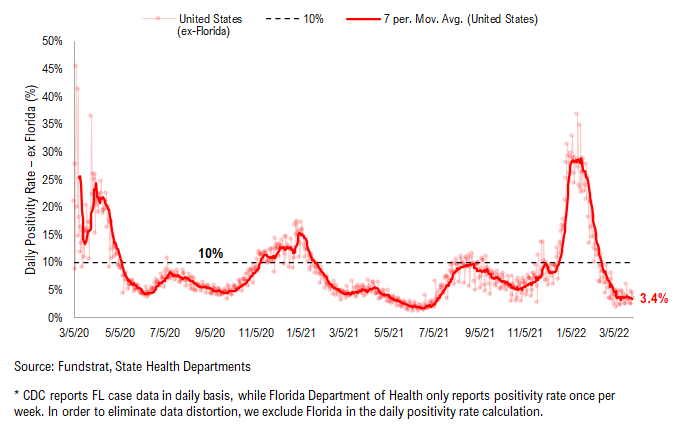
Daily death and current hospitalization continue to fall, while positivity rate has been flat…
Below we show the aggregate number of patients hospitalized due to COVID, daily mortality associated with COVID, and the daily positivity rate for COVID
– Net hospitalization and daily deaths have plunged – both have fallen to the pre-Omicron levels. In fact, as shown below, current hospitalization is near the all-time low since the pandemic.
– Positivity rate has been flat – partially due to the spread of the BA.2 variant. But in term of the absolute level, 3.4% positivity rate is still relatively low.
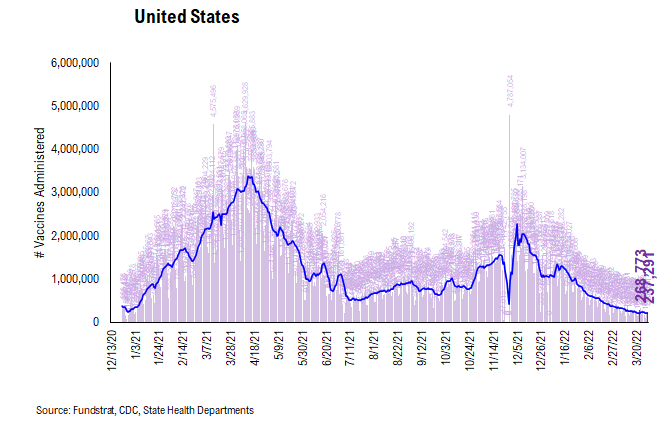
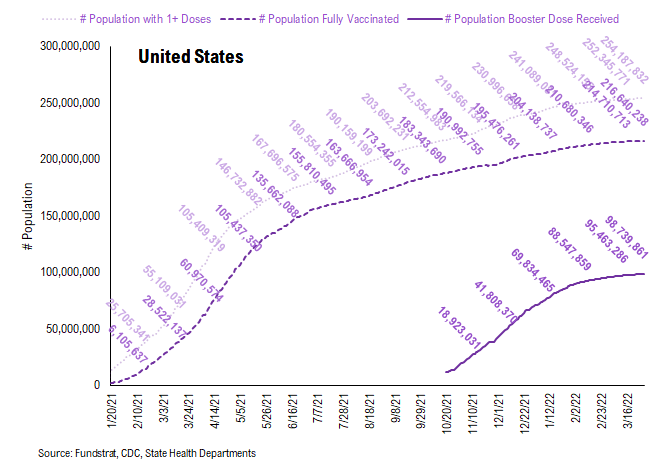
POINT 2: VACCINE: vaccination pace has slowed recently… likely due to the improvement in COVID situation
Current Trends — Vaccinations:
– avg 0.2 million this past week vs 0.2 million last week
– overall, 29.2% received booster doses, 65.3% fully vaccinated, 76.6% 1-dose+ received
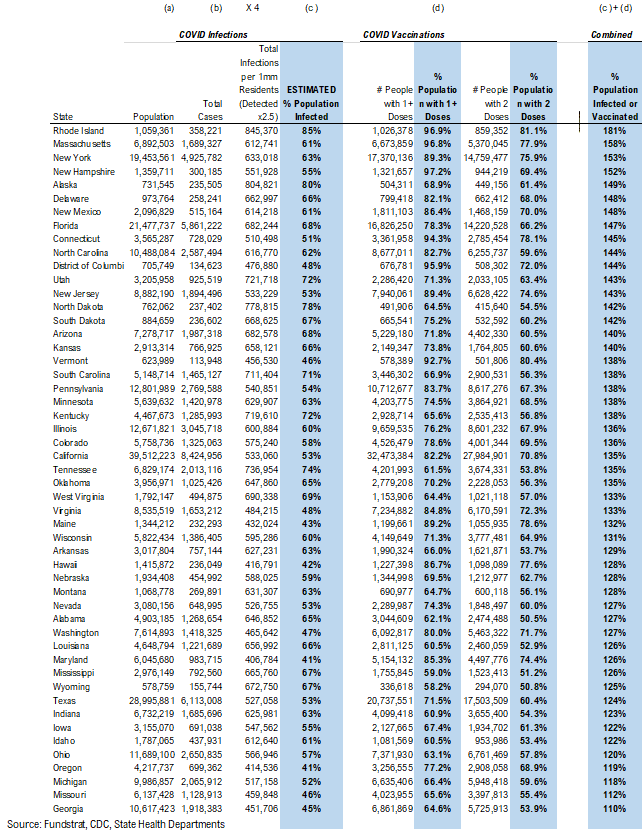
Vaccination frontier update –> all states now above 100% combined penetration (vaccines + infections)
*** We’ve updated the total detected infections multiplier from 4.0x to 2.5x. The CDC changed the estimate multiplier because testing has become much better and more prevalent.
Below we sorted the states by the combined penetration (vaccinations + infections). The assumption is that a state with higher combined penetration is likely to be closer to herd immunity, and therefore, less likely to see a parabolic surge in daily cases and deaths. Please note that this “combined penetration” metric can be over 100%, as infected people could also be vaccinated (actually recommended by CDC).
– Currently, all states are above 100% combined penetration
– Again, this metric can be over 100%, as infected people could also be vaccinated, but 100% combined penetration does not mean that the entire population within each state is either infected or vaccinated
There were a total of 237,291 doses administered, as reported on Wednesday. The vaccination pace continues to fall and now is the lowest level since the mass rollout of COVID-19 vaccines. But it is also understandable that less people are seeking vaccination given the improvement in overall COVID situations..
This is the state by state data below, showing information for individuals with one dose, two doses, and booster dose.
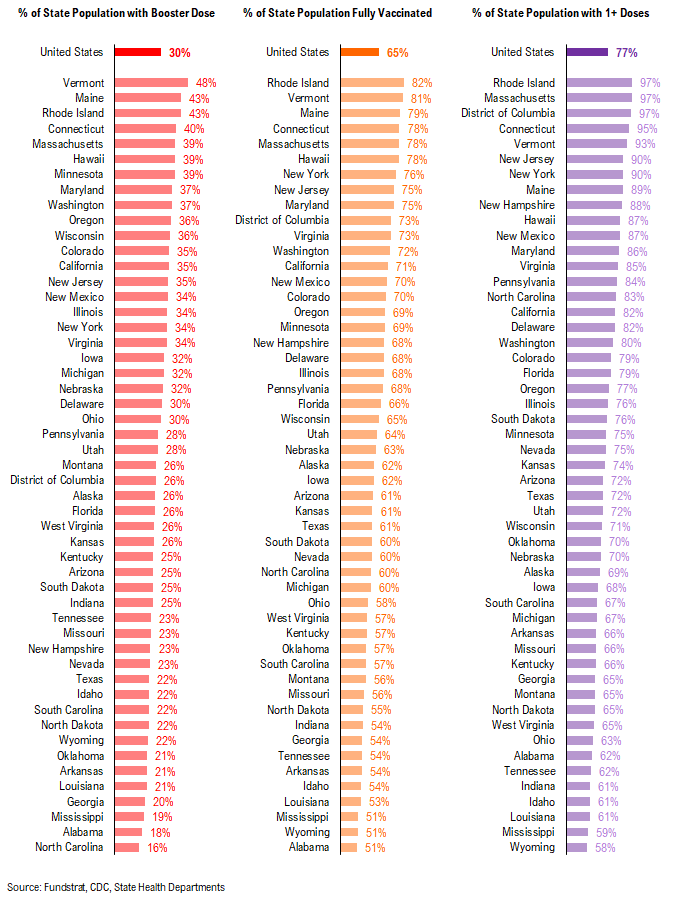
In total, 560 million vaccine doses have been administered across the country. Specifically, 254 million Americans (76% of US population) have received at least 1 dose of the vaccine. 217 million Americans (66% of US population) are fully vaccinated. And 99 million Americans (31% of US population) received their booster shot.
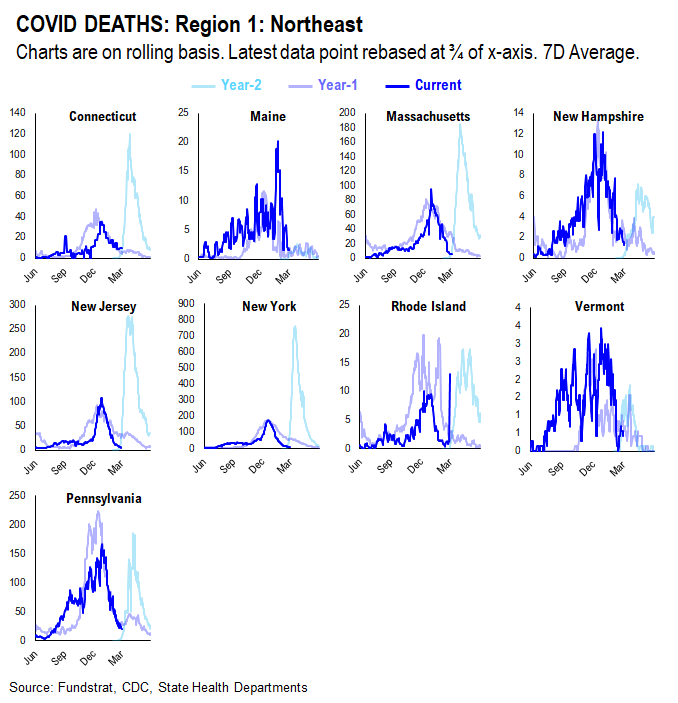
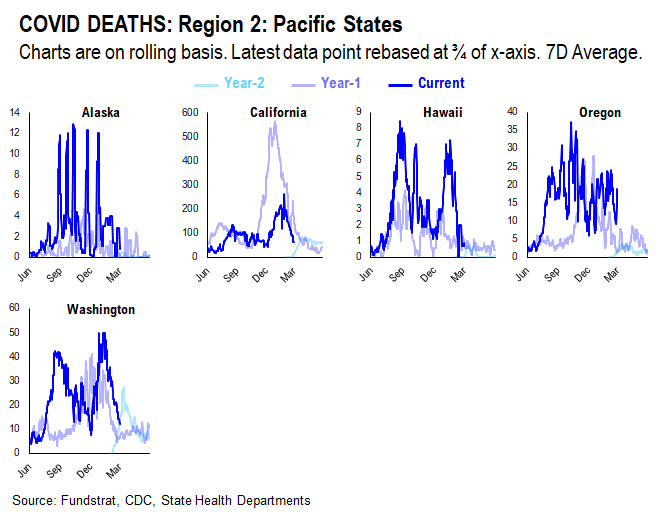
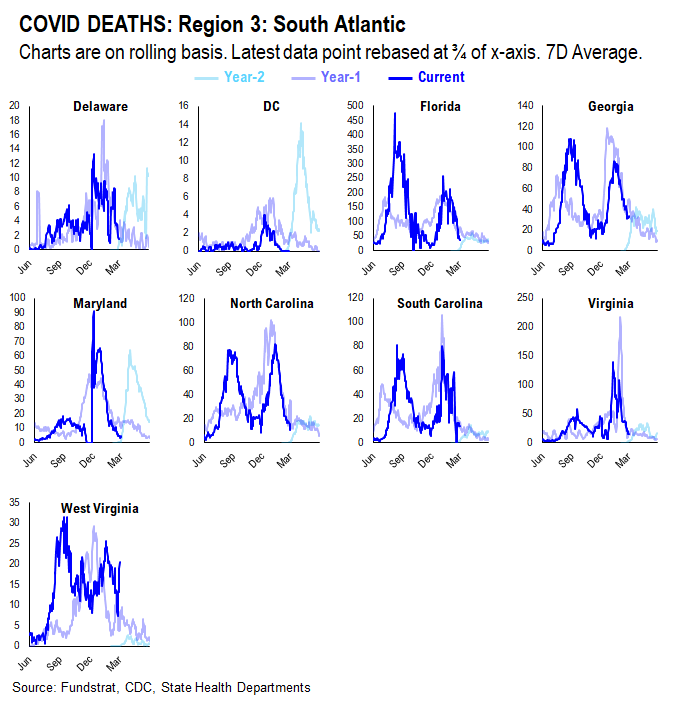
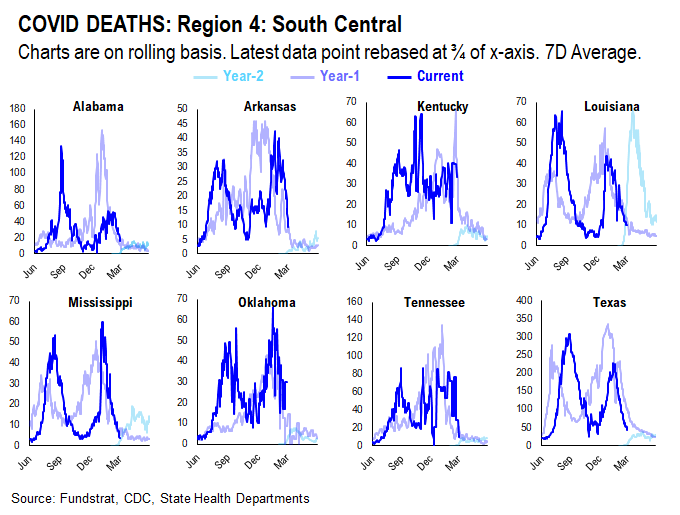
POINT 3: Tracking the seasonality of COVID-19
***We’ve updated the seasonality tracker to show figures from the last 9 months, from this calendar day, in each of the last two years***
As evident by trends in 2020 and 2021, seasonality appears to play an important role in the daily cases, hospitalization, and deaths trends. Therefore, we think there might be a strong argument that COVID-19 is poised to become a seasonal virus.
The possible explanations for the seasonality we observed are:
– Outdoor Temperature: increasing indoor activities in the South vs increasing outdoor activities in the northeast during the Summer
– “Air Conditioning” Season: similar to “outdoor temperature”, more “AC” usage might facilitate the spread of the virus indoors
– Opposite effects hold true in the winter
CASES
It seems as if the main factor contributing to current case trends right now is outdoor temperature. During the Summer, outdoor activities are generally increased in the northern states as the weather becomes nicer. In southern states, on the other hand, it becomes too hot and indoor activities are increased. As such, northern state cases didn’t spike much during Summer 2020 while southern state cases did. Currently, northern state cases are showing a slight spike, especially when compared to Summer 2020. This could be attributed to the introduction of the more transmissible Delta variant and the lifting of restrictions combined with pent up demand for indoor activities.
HOSPITALIZATION
Current hospitalizations appear to be similar or less than Summer 2020 rates in most states. This is likely due to increased vaccination rates and the vaccine’s ability to reduce the severity of the virus.
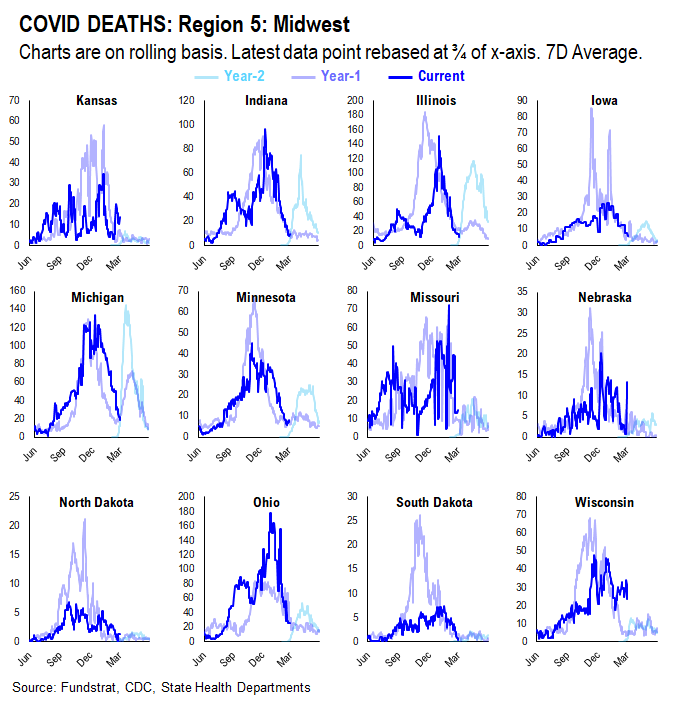
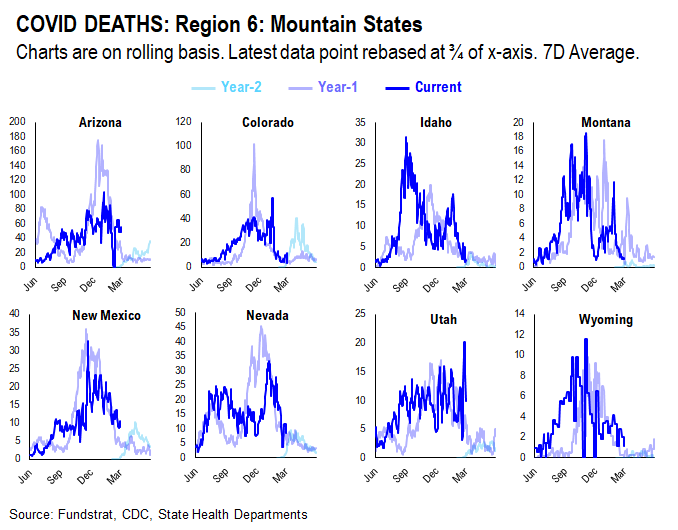
DEATHS
Current death rates appear to be scattered compared to 2020 rates. This is likely due to varying vaccination rates in each state. States with higher vaccination rates seem to have lower death rates given the vaccine’s ability to reduce the severity of the virus; states with lower vaccination rates seem to have higher death rates.