

Equities arguably priced yield curve inversion + 4 other "wall of worries" --> Previous "recession scares": 8 of 9 times, Technology leads = FAANG

Click HERE to access the FSInsight COVID-19 Chartbook.
As many states are reducing the frequency of COVID-19 reports, we will only publish COVID-19 updates on Thursday.
Beginning this week, as COVID-19 data frequency has declined, we are modifying our publication schedule to publish three times per week.
Monday
SKIP TUESDAY
Wednesday
SKIP THURSDAY
Friday
STRATEGY: Equities arguably priced yield curve inversion + 4 other “wall of worries” –> Previous “recession scares”: 8 of 9 times, Technology leads
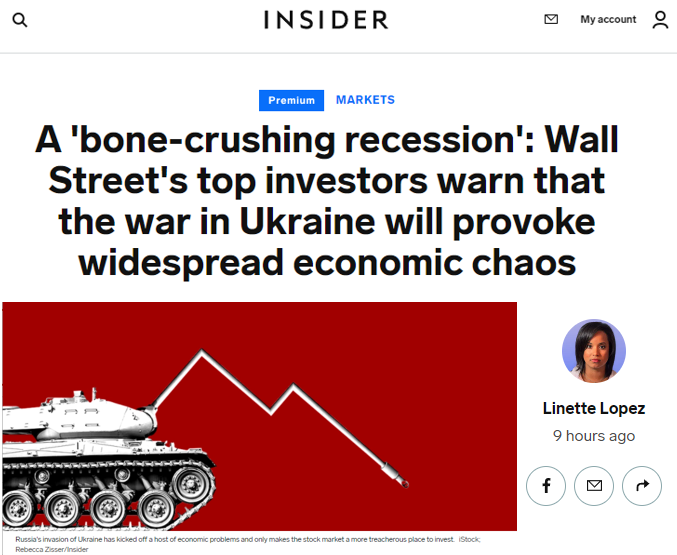
Stocks rising despite concrete and logical headwinds = hence, consensus bearish but tape “whispering”
There are many well-reasoned, tangible, concrete and known risks to the US and global economic expansion. And these issues will not be a “rear view” mirror item for 4-6 months:
– surging commodity prices
– risk of Russia-Ukraine war expanding to engulf rest of World
– COVID-19 disruptions
– yield curve inversions
– Fed in “full blown hawk mode”
At the core of these is these lead to an unappealing trade-off between inflation and “kill growth” for policymakers and have been shown to drive recessions. And the best case is a “soft landing” for the economy, which seems like a bad consolation prize. These are real issues and something that our research at Fundstrat, by all of our macro teams, view as credible risks to the US expansion.
– in fact, over the past few weeks, these issues have indeed worsened
– hence, it should not be surprising that consensus is bearish
– it should also not be surprising that the majority of our clients see a major “inflation problem” ahead
…yet, in the face of this massive wall of worry, stocks are rising = signal
But most curiously, equities have been rising consistently in the face of these building headwinds. And we know that institutional and retail investors went into recession positioning. Yet, the S&P 500 has been rallying furiously for the past few weeks and has already generated several signals only seen at major bottoms (see our prior notes, which we have written exhaustively about this).
– when stocks do the opposite of one expects
– instincts say “stocks are wrong”
– but Fundstrat’s rule #3 (stocks) is “don’t shout at markets”
Thus, if stocks are rising furiously while the apparent risks are urging risk off, we view this as signal. Positive signal, that is.
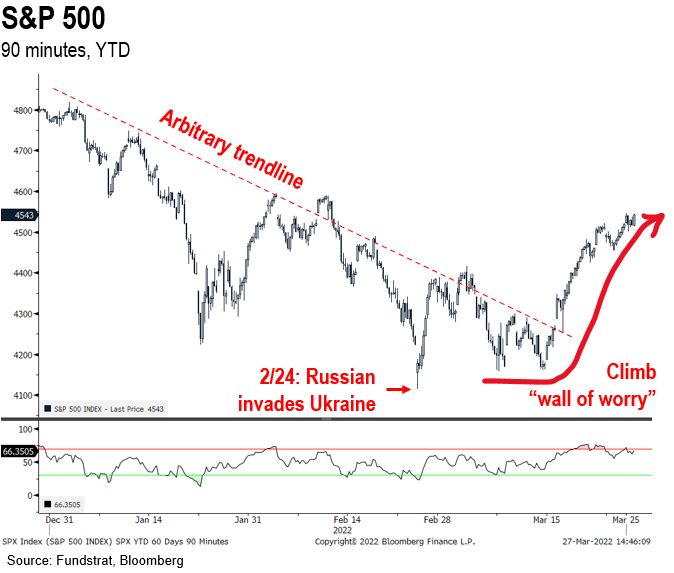
Take a look at the S&P 500 chart below and a few “lines” are marked on this chart:
– S&P 500 has been in a pronounced downtrend since the start of January
– S&P 500 bottomed on 2/24, the day of Russia invasion (“buy the invasion”) = BUY SIGNAL
– S&P 500 broke downtrend on 3/15 = BUY SIGNAL
– S&P 500 closed above the 200D moving avg on 3/21 = BUY SIGNAL
It is hard to escape the view that this is pretty constructive price action for equities. We still view 1H2022 as “treacherous” and indeed it has been. But this is a setup for a strong 2H2022. Moreover, as we timidly ventured a few times in the past few weeks, we think there is a strong possibility the lows for 1H2022 might be in. It is still too early to conclude this, but surely seems to be strengthening as we move through 1Q.
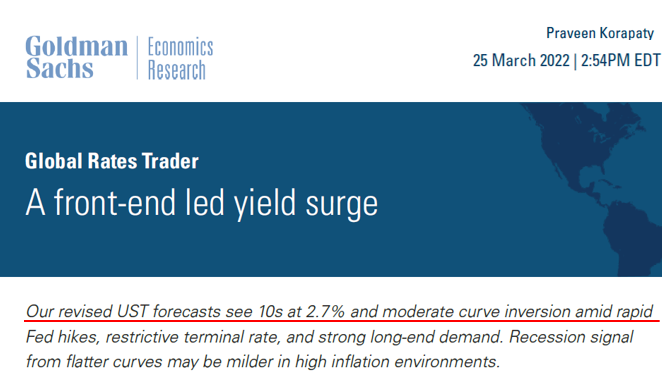
Wall Street starting to forecast inversion of 10Y less 2Y yield curve… not a fait accompli
The 10Y less 2Y spread has narrowed to a mere 20bp, perilously close to inverting. And Goldman Sachs is now forecasting an inversion by mid-year (below), mainly driven by a rising 2Y. This is something important to watch as an inversion implies slowing growth (at the least) and risk of recession (6 of 10 times)
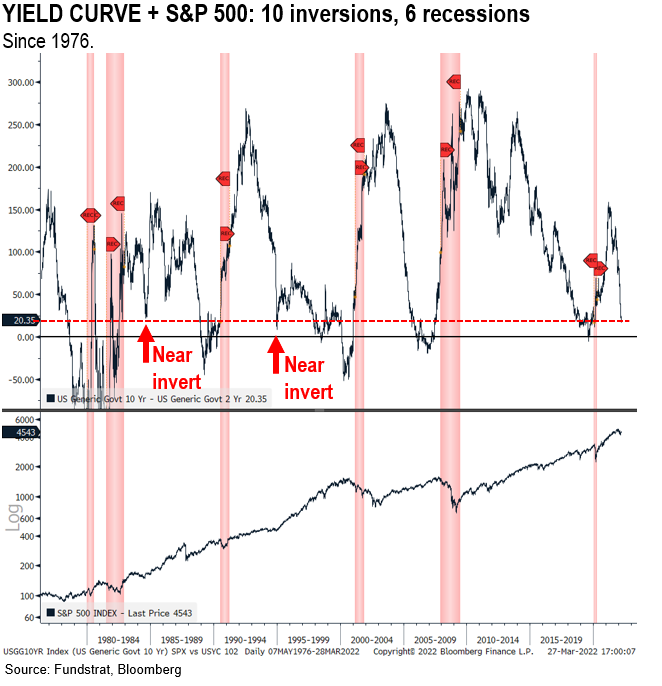
Since 1976, there have been 10 such inversions as highlighted below. But keep the following in mind:
– 2 prior instances of narrowing 10Y less 2Y <20bp, but no inversion
– 10 inversions since 1976
– 6 recessions
So, the inversions have a decent track record of recession forecasting, but has been overly sensitive.
STRATEGY: After markets price “false recession” (possibly current case), Technology leads 8 of 9 times
We see improved risk/reward for stocks because we believe equities have priced in much of the upcoming and expected economic calamity, both war and inflation, and to an extent, the possible inversion of the yield curve. This doesn’t mean stocks have no downside near-term.
– but rather, we see positive risk/reward 6M and 12M forward, or 2H
– but given the bludgeoning seen in stocks in Feb/March, we think odds high that the 1H2022 low is in
– this is not confirmed technically, hence, Mark Newton, Head of Technical Strategy, is looking for confirming signs
– either of downside or upside
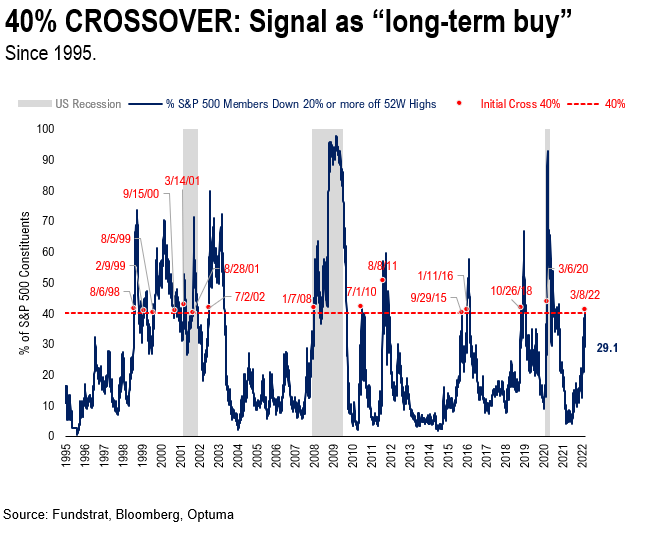
But this chart below might best capture the level of recession risk priced in. We highlighted this last week and shows the % of stocks trading 20% off their highs:
– conceptually, a stock down 20% is in a bear market
– this figure reached > 40% in early March
– meaning 40% of S&P 500 priced in a recession aka bear market
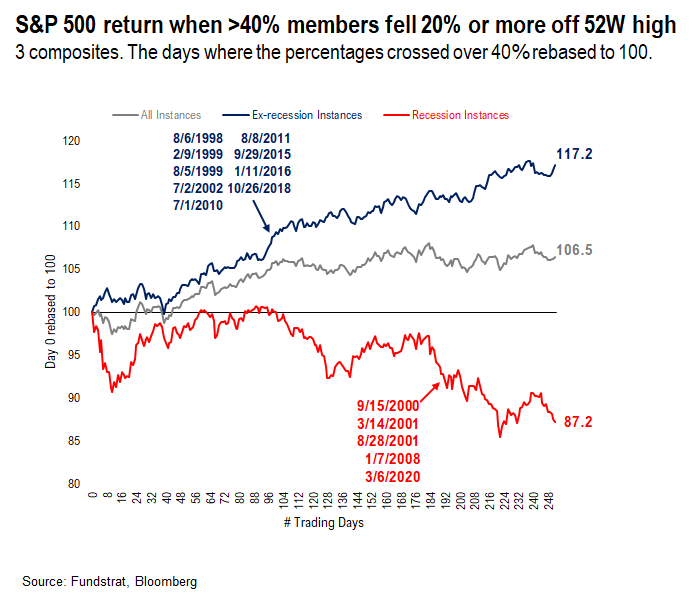
And ex-recession, forward returns particularly strong
As this chart highlights, in the 9 instances when stocks priced in a recession (% stocks 20% off highs > 40%) but there is no recession, stocks rebound sharply:
– of 14 instances where > 40% of S&P 500 is 20% off its highs
– 9 of 14 priced in a recession that did not happen
– the forward composite return is strong
– as we wrote previously, 9 of 9 times, stocks higher 12M later
Thus, stocks are a strong risk/reward here if:
– US economy avoids recession
– S&P 500 priced in a recession aka > 40% S&P 500 > 20% off highs, which happened in March
– n=9 instances
– 9 of 9 times, stocks higher in 12M
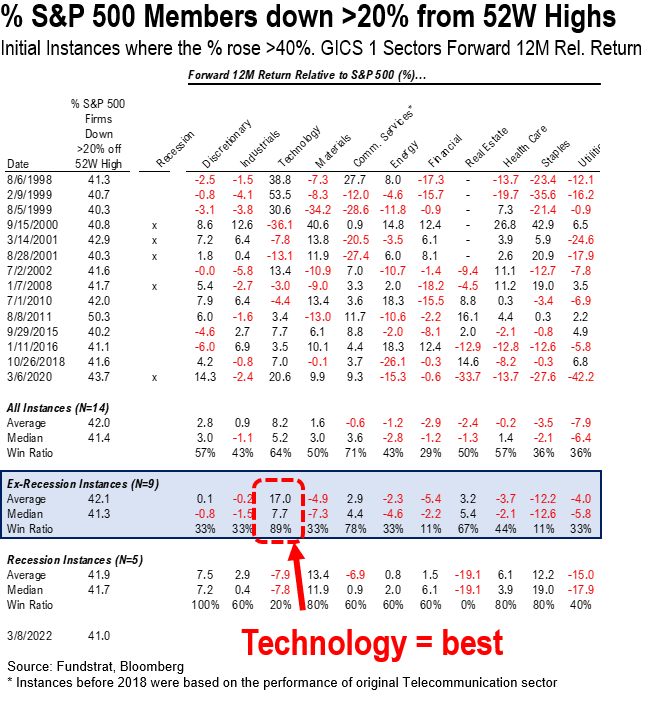
SECTORS: Technology leads after signal generated = supports FAANG + BEEF
Our data science team, led by tireless Ken, measured relative sector performance after this signal has been generated. And as shown below, Technology is the best performing sector after breaching this 40% signal:
– Technology outperformed 8 of 9 times, ex-recession
– only July 2010 did Technology outperform
– median outperformance is 770bp
– median S&P 500 returns are +17.1% next 12M
– this implies Technology can return ~25% over next 12 months
Hence, we see historical precedent for sticking with FAANG and Technology. After all, this sector is somewhat resistant and resilient to inflation. And arguably, if inflationary pressures rise for wages and other services, demand for cost saving technology will rise. Similarly, we see reasonable valuations currently. And if interest rates stabilize, a case for P/E expansion.
STRATEGY: Stick with BEEF
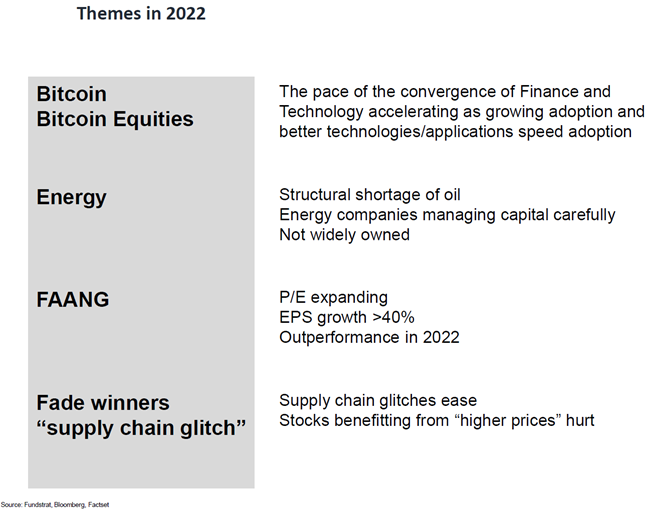
Broadly, our existing strategy of BEEF remains valid. Even in war. Even with inflation. In fact, the last few weeks are strengthening the case for our “BEEF” strategy. That is, BEEF is
– Bitcoin + Bitcoin Equities BITO3.94% GBTC4.29% BITW5.27%
– Energy
– FAANG FNGS-1.11% QQQ-0.67%
Combined, it can be shorted to BEEF.
Why is this making stronger BEEF?
– Energy supply is now a sovereign priority
– this helps Energy stocks
– Ukraine and Russia both want access to alternative currencies
– this strengthens case for Bitcoin and bitcoin equities
– if Global economy slows, growth stocks lead
– hence, FANG starts to lead FB AAPL-0.57% AMZN-0.99% NFLX-4.18% GOOG0.33%
All in all, one wants to be Overweight BEEF
_____________________________
33 Granny Shot Ideas: We performed our quarterly rebalance on 2/3. Full stock list here –> Click here_____________________________
UKRAINE WAR: Russia-Ukraine war seeing incrementally positive developments, except for Biden gaffe
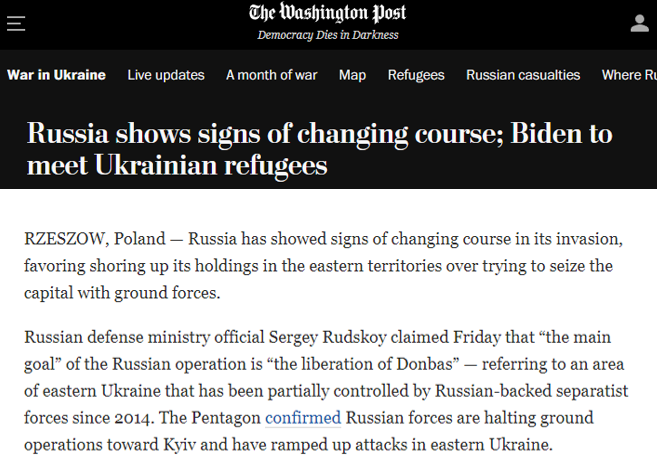
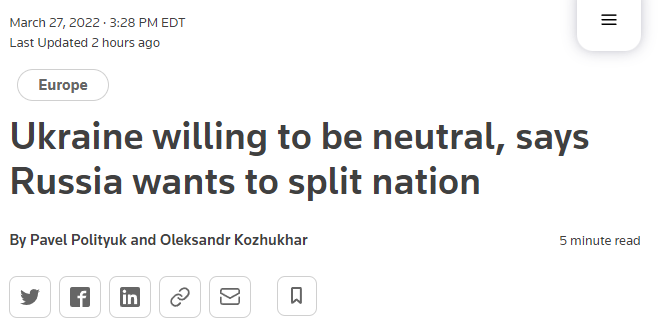
Over the weekend, developments in the Russia-Ukraine war have been generally positive. Specifically:
– Russia shows signs it is redefining action as “shoring up Eastern holdings”
– Ukraine shows willingness to pledge neutrality
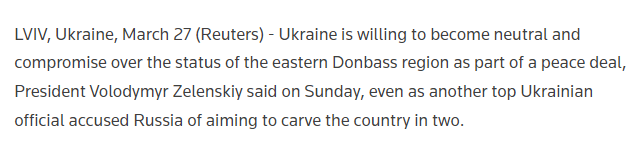
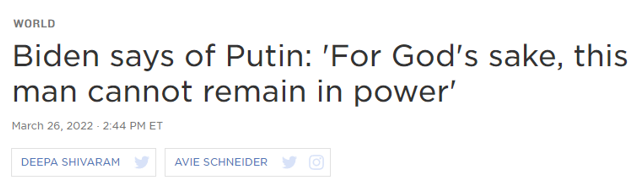
WAR: Biden adlib comment…
But the Biden speech over the weekend risked upending any potential progress. His 9 words “For God’s sake, this man cannot remain in power” created ripples. But it seems these words were quickly walked back by the White House.

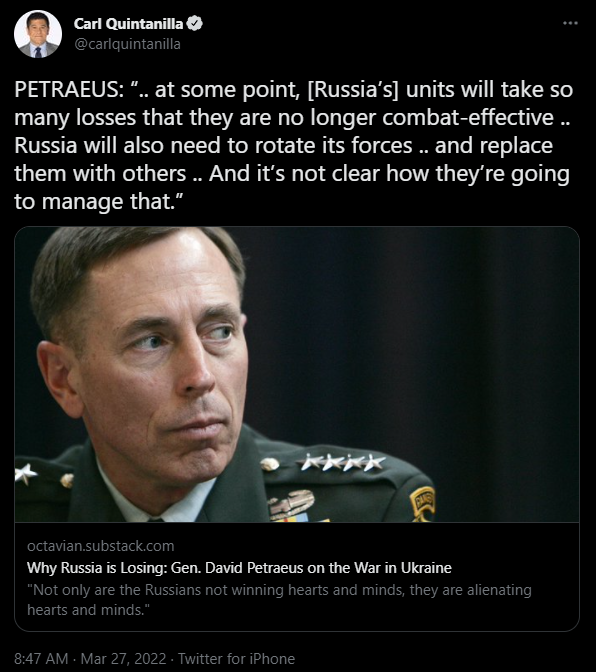
WAR: Russia possibly seeing rapid attrition of its combat-effectiveness…
As highlighted by @carlquintanilla, General Petraeus commented that at some point, Russia could incur such losses that they are no longer combat effective. From the outside perspective, it is unclear what level of losses creates this loss of combat effectiveness.
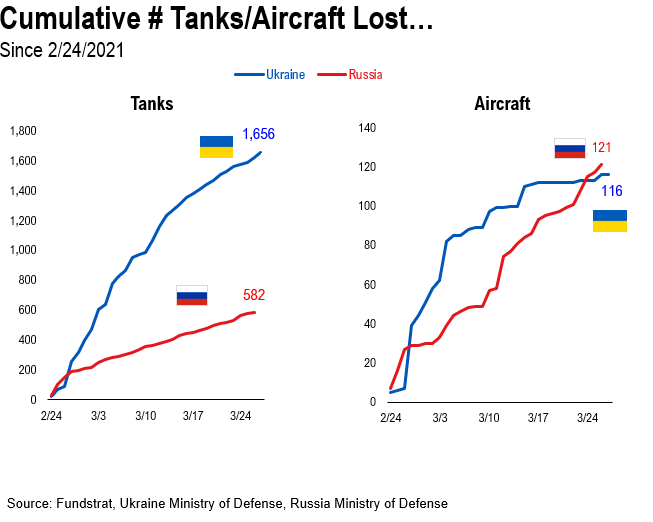
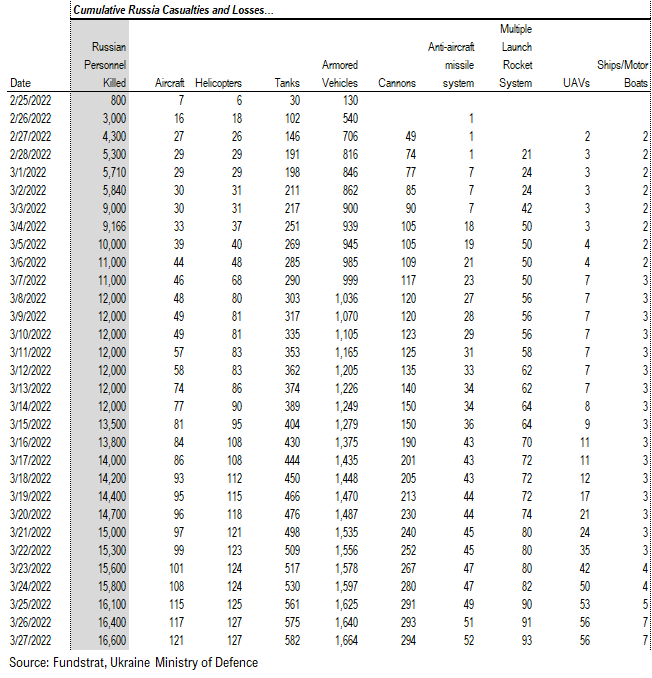
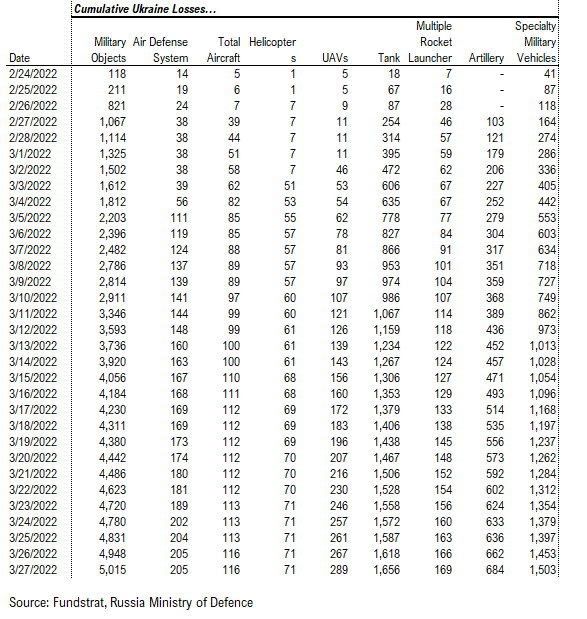
As shown below, there has been a high level of equipment lost so far, as reported by the opposing Ministry of Defense. For instance, look at combat aircraft:
– Russia has lost 121 aircraft (per Ukraine)
– Ukraine has lost 116 aircraft (per Russia)
It is surprising that Russia has lost more aircraft than Ukraine. But this highlights that military weapons have become more lethal against aircraft, making planes/helicopters far more vulnerable.
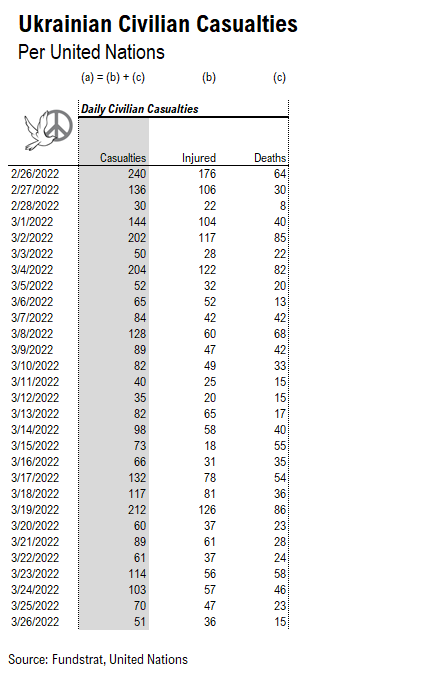
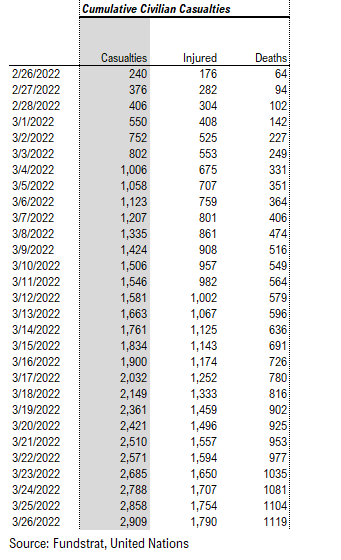
DATA ON RUSSIA-UKRAINE WAR: Tracking Russia-Ukraine war statistics — 2,909 Ukrainian civilian casualties so far
Our data science team, led by tireless Ken, is scraping data from several sources to track some high level data around the Russia-Ukraine war.
– Ukrainian civilian casualties
– Ukraine population movements
– Ukraine military losses, except personnel
– Russian estimated losses of personnel and material
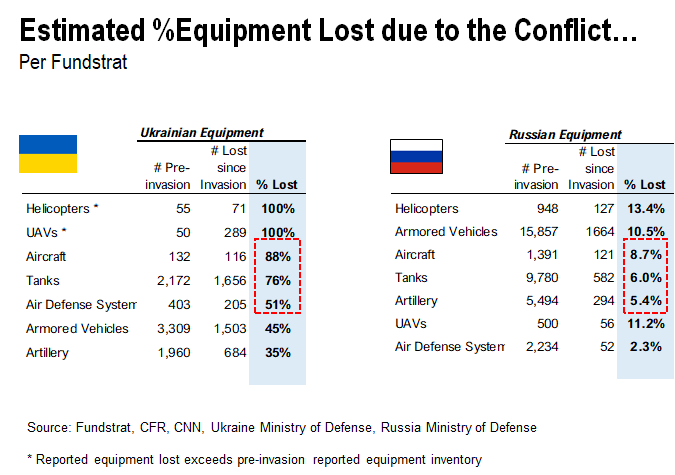
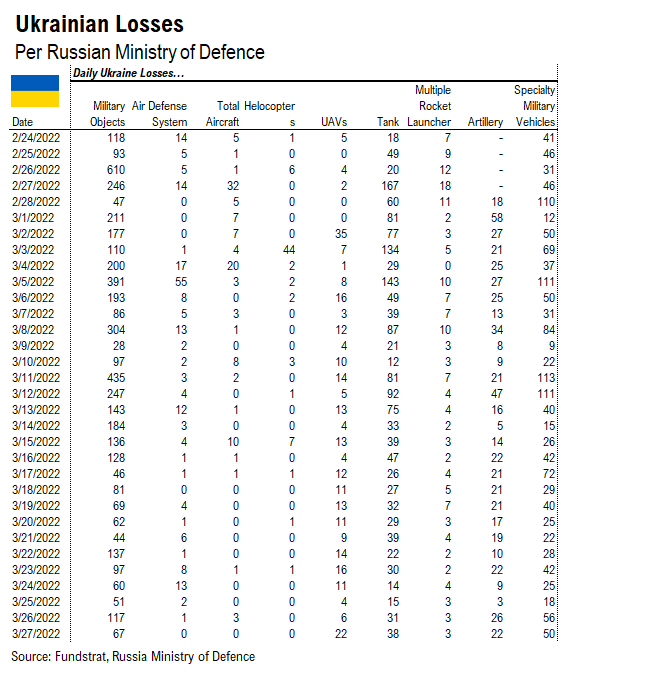
Ukraine has lost an estimated 76% of its tanks and 88% of its aircraft
Our data science team, led by tireless Ken, has been tracking the casualties and losses associated with the Russia-Ukraine war. And while Ukraine has staged an impressive resistance, the reported losses of equipment show that Ukraine has lost a substantial share of its equipment:
– by our team’s analysis, using reported data
– Ukraine has lost 1,656 tanks or 76% of its equipment
– Ukraine has lost 116 aircraft, or 88% of its fleet
By these measures, the armament of that army is rapidly depleting. I am not sure if this is a well known fact. But this also highlights why the nation is seeking to replenish its equipment.
With each passing day, Ukraine is experiencing further losses of critical equipment.
The number of casualties is 51 on 3/26, and a total of 2,909 have been reported to the UN.
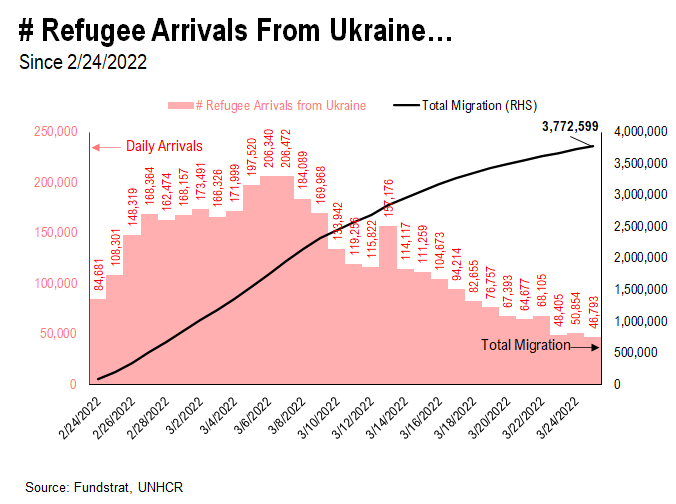
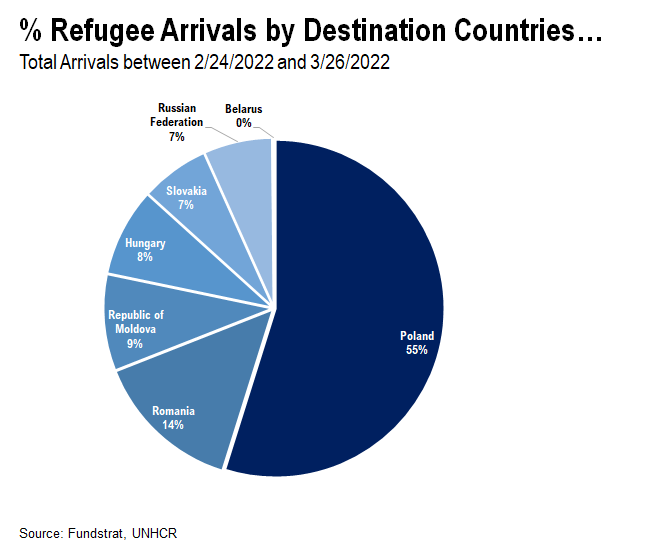
The flow of migrations out of Ukraine had been steady at about 100,000 to 200,000 per day, but has gradually declined to around 50,000 per day recently. And a total of 3.8 million have fled so far.
– 55% are entering into Poland
– curiously, 7% or 270k or so, have entered Russia
If one is wondering about reported losses of equipment, we are citing statistics provided by the opposing ministry officials.
– est. 116 Ukraine planes lost
– est. 1,656 tanks lost
– this seems like a lot of equipment
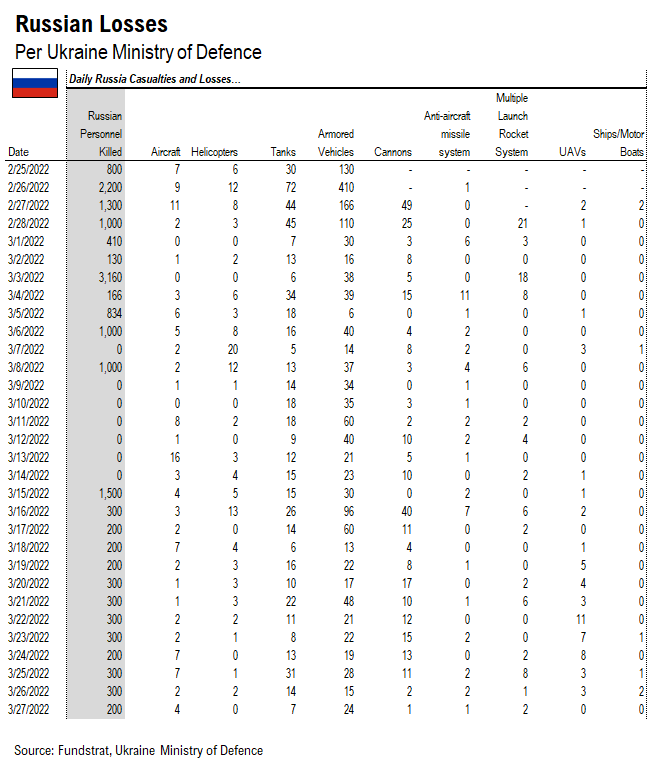
Russian losses are higher
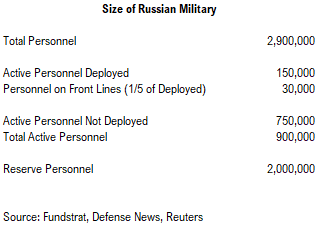
– est. 16,600 Russian soldiers killed
– est. 582 tanks
– est. 121 aircraft
– est. 1,664 armored vehicles
Our team says this data is scraped and can be updated daily. So, we will post these figures for now. And that way, we can get a sense for the intensity of the hostilities.
Thomas Hu, of Kyber Capital, also shared this website which is a crowd sourced view of reported activities. There is a lot to the website, and I encourage you to check it out. The website URL is https://maphub.net/Cen4infoRes/russian-ukraine-monitor
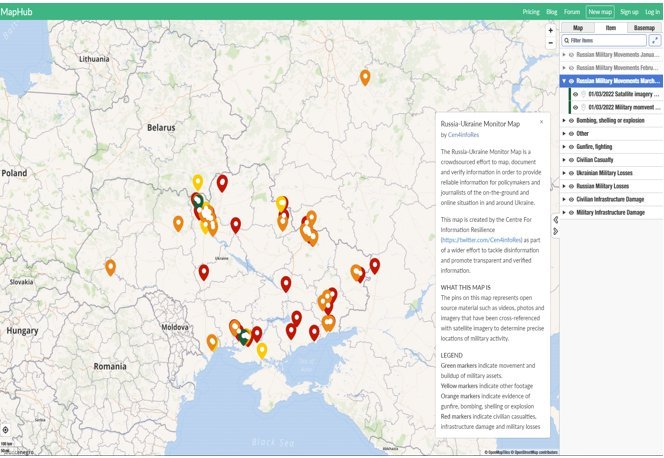
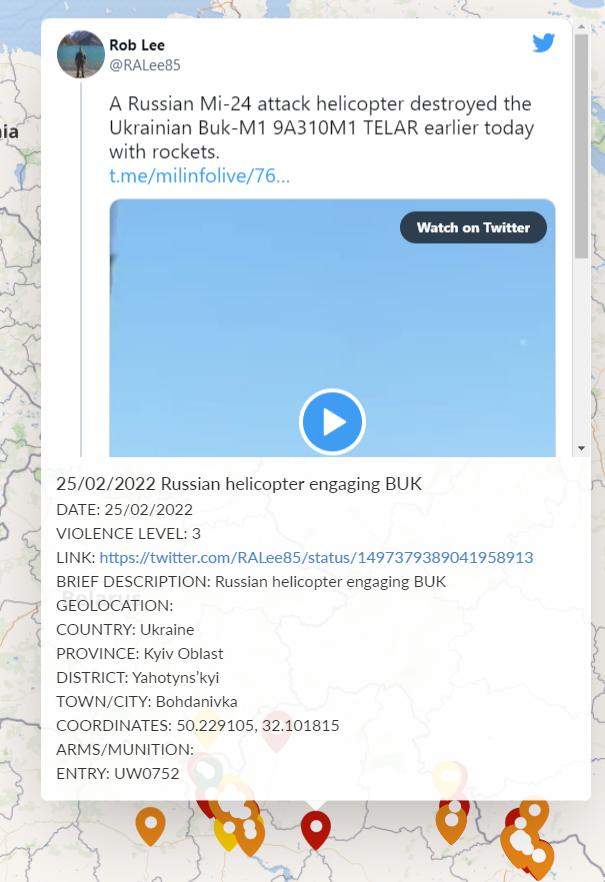
For instance, if you click on one of the icons, a verified post is shown. There is geolocation and other data attached.
POINT 1: Daily COVID-19 cases
This data will be updated every Thursday.
POINT 2: Vaccination Progress
This data will be updated every Thursday.
POINT 3: Tracking the seasonality of COVID-19
This data will be updated every Thursday.
More from the author
Articles Read 1/2
🎁 Unlock 1 extra article by joining our Community!
Stay up to date with the latest articles. You’ll even get special recommendations weekly.
Already have an account? Sign In 17fcf3-8a2f98-9350c0-ecd657-52a6b3
Already have an account? Sign In 17fcf3-8a2f98-9350c0-ecd657-52a6b3

