

3 reasons the Omicron panic cycle differs from past variants...Tracking for tradeable low 12/22-12/24 per M. Newton

Click HERE to access the FSInsight COVID-19 Daily Chartbook.
We publish on a 4-day a week schedule:
Monday
Tuesday – Thomas Lee’s 2022 Outlook @ 3pm
SKIP WEDNESDAY
SKIP THURSDAY
SKIP FRIDAY – Christmas Holiday
SAVE THE DATE: Fundstrat Thomas Lee’s 2022 Outlook – Tuesday (12/21) at 3pm ET…
While the S&P 500 managed to produce an impressive > 20% gain in 2021, the carnage and damage created by COVID-19 remains in place. Thus, as we look into 2022, the picture for markets remains very challenging. Please join us on Tuesday, December 21 at 3:00 PM ET for our 2022 outlook webinar and Q&A with Tom Lee, Co-Founder & Head of Research at Fundstrat. In our 2022 Outlook, we will discuss:
– Primary drivers for financial markets in 2022
– Impacts from policy normalization
– Impacts from midterm elections
– Investment themes to Overweight and Avoid
– Structural tailwinds and headwinds beyond 2022
Details and Specifics
Date: Tuesday, December 21, 2021
Time: 3:00pm – 4:00pm ET
Link –> Click here to register
Should you have any questions, please do not hesitate to email inquiry@fundstrat.com.
STRATEGY: Tracking for tradeable low 12/22-12/24 per M. Newton
3 reasons the Omicron panic cycle differs from past variants…
In the past week, Omicron has surged throughout the US, representing a large share of cases in many states and contributing to a rise in cases. This has been widely expected for some time, as it was apparent the border closures will not stop Omicron from surging globally. Generally speaking, we can expect:
– USA will see a surge in COVID-19 cases, reflecting the surge of Omicron
– Cases might soar to 250,000 to 300,000, maybe 500,000 within a few weeks
And while financial markets will likely panic at the prospect of 500,000 cases or more, we see 3 significant differences in Omicron versus prior surges:
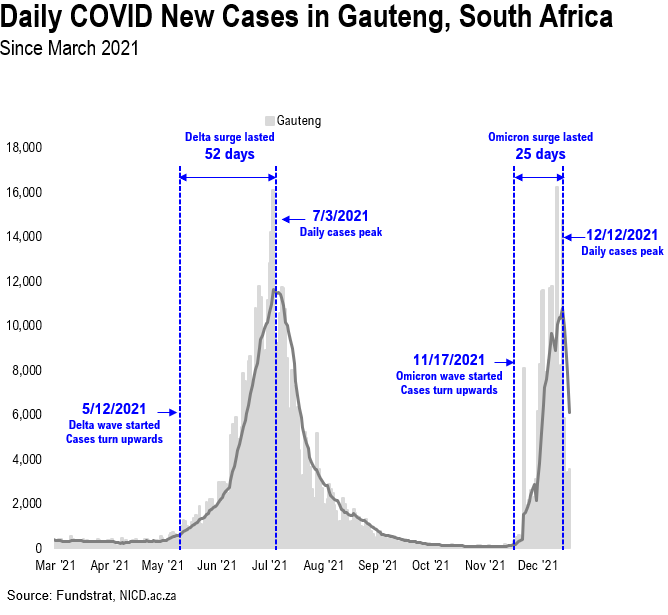
1. Omicron will burn out 2X faster than Delta
In South Africa, Omicron surge lasted 25 days and is already rolling over
Delta surge in SA lasted 52 days
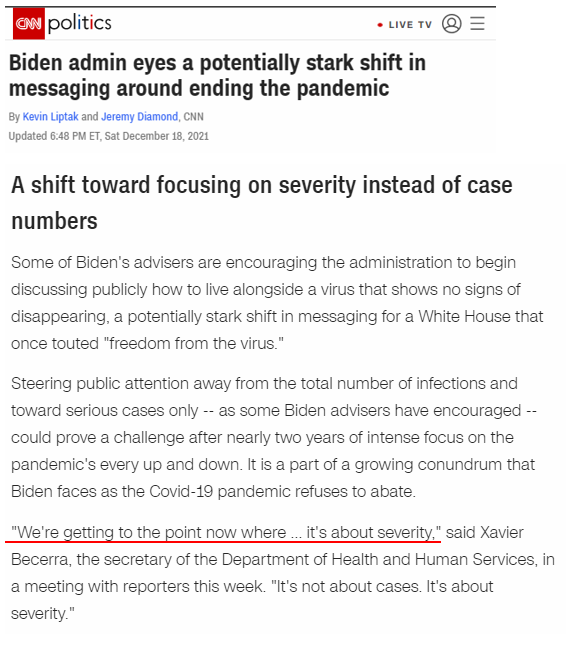
2. Policymakers, particularly the White House, are realizing “cases” is losing its relevance
It seems the White House is considering a “stark shift” in focus away from cases to “severity”
This is a huge shift in framework and would obviously lead to policies away from quarantine and lockdown
3. Consumers have panicked and reacted to Omicron far faster than Delta
Chase credit card data already shows a big hit to spending
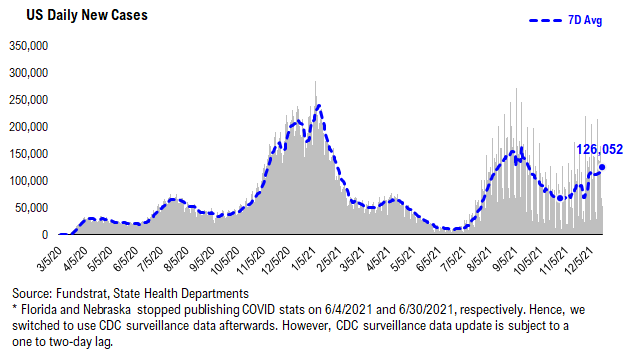
Visibly, cases in the US are curling upwards. And this is consistent with what we all see around us. There are many more COVID-19 cases taking place. Even among fully vaccinated and even fully boosted Americans. So there is a rise in cases. But as we discuss in this report, if Omicron proves to be less severe (but more contagious), cases are becoming less useful as the bogey. And the focus will shift towards severity and the resulting policy framework will also change.
…Stocks should bottom well ahead of the Omicron peak –> Omicron probably peaks in early January
Collectively, if one believes these 3 differences exist, these differences have important implications for financial markets.
– Financial markets have sold off sharply as Omicron has rolled across the world
– And Omicron still will roll across the US for the next few weeks (25 days in total?)
– Omicron started to impact case figures in the first week of December
– But because consumers and financial markets panicked
– And because the White House might reframe the “cases versus severity”
– arguably, equities will bottom WELL AHEAD of the peak in Omicron.
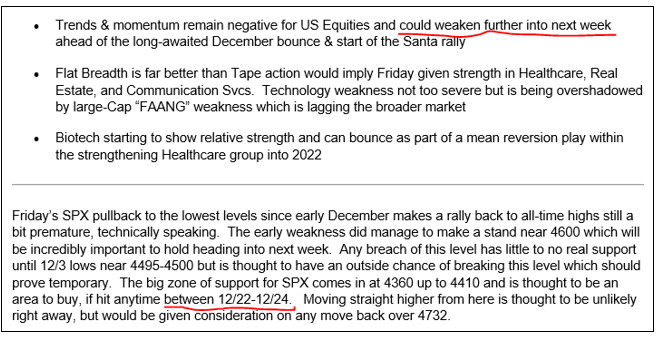
In other words, if Omicron peaks in January, we think stocks will actually bottom in late December. This coincides well with Fundstrat Head of Technical Strategy, Mark Newton’s view that the tradeable low will take place between December 22nd to 24th. In other words, the bottom will be next week. Below are Mark’s comments from this past Friday (12/17).
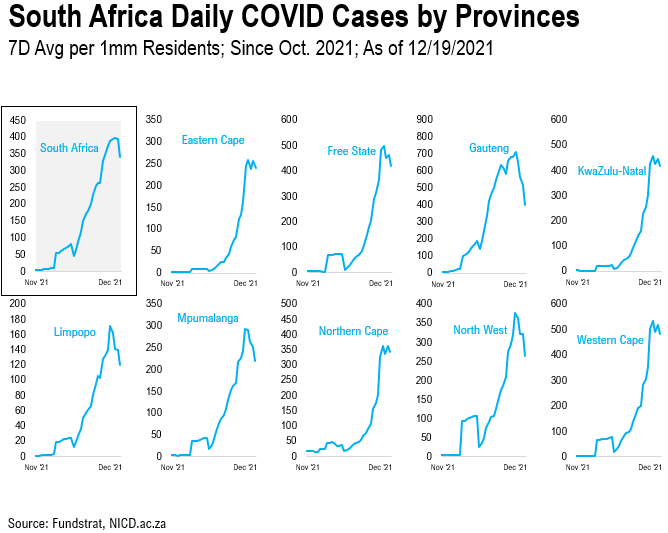
…South Africa cases are conclusively rolling over, after 25 days
South Africa cases are visibly rolling over. As you can see:
– Nationwide, cases peaked on 12/12
– that is 7 days ago
– cases are rolling over in 9 of 9 provinces
– most visibly in Gauteng, where Omicron first surged
…South Africa Omicron surge lasted 25 days versus 52 days for Delta
Notably, the Omicron surge lasted 25 days. The strain is so virulent, that it burned itself out quickly.
– the reported peak in cases is about the same, July 2021 versus December 2021
– but the speed to reach that peak is half the time
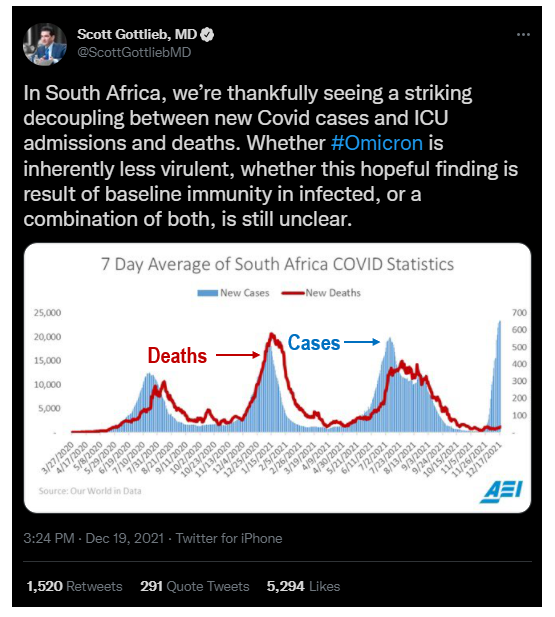
And as Dr Scott Gottlieb notes, the divergence between Omicron cases and deaths is striking:
– Delta variant caused a coincident surge in cases and deaths
– Omicron is merely showing up as cases
– No death uptick
…White House eyeing shift to severity away from cases
In one of the more important developments, Omicron is potentially forcing a stark shift in how the White House manages COVID. Instead of a focus on “zero cases” or even “freedom from the virus” the view is shifting towards focusing on severity. This is akin to the endemic view of COVID.
– this is a huge policy shift
– the emphasis would likely focus on protecting the vulnerable
– but reducing restrictions around those protected and healthy
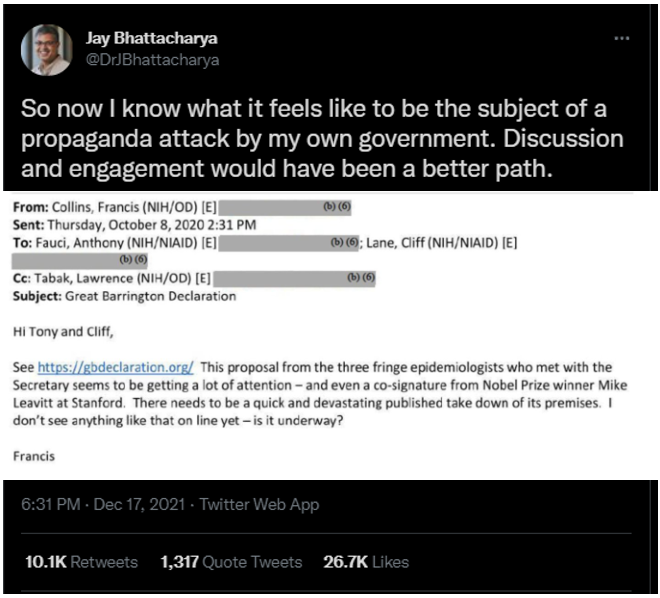
Ironically, this potential policy shift by the White House aligns with the view promoted by the group known as the Great Barrington Declaration. More than 80,000 scientists have signed this document. And it argues that COVID-19 policy risk from quarantines are far more damaging to mental health and the economy and thus, advocate a focus on severity.

Ironically, the NIH and many policy makers attacked these views in 2020 as “rogue” and “fringe” — so it is somewhat abrupt to see the White House shift towards this view.
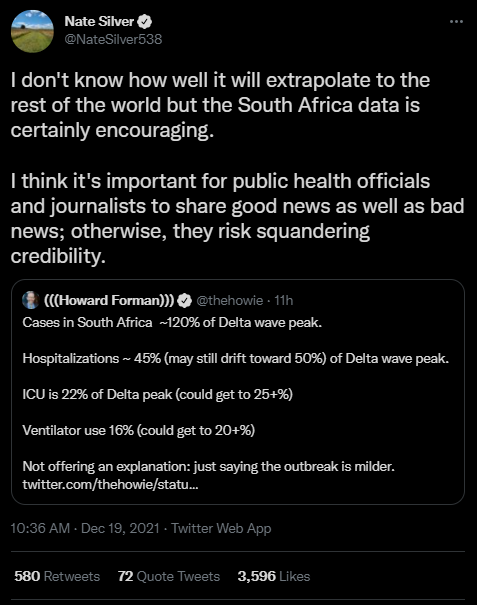
Well regarded policymakers have pushed for this view sometime. In fact, even Nate Silver, of fivethirtyeight.com, notes that SA Omicron experience seems to be relatively benign.
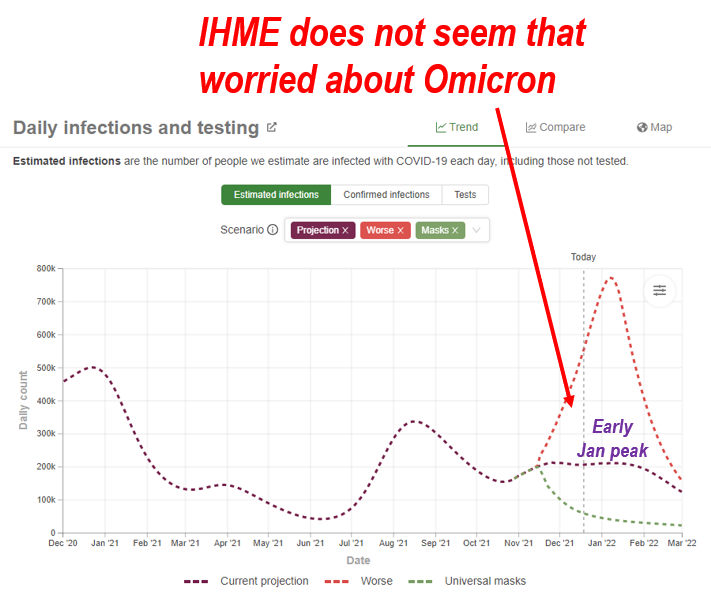
…IHME forecast shows that Omicron peak in early Jan, and lower than Summer 2021
As many of you are aware, we like to look at the forecasts of the IHME (Institute of Health Metrics, forecasters used by the White House) to see what their views are regarding COVID-19 trends.
– their current forecast is a modest uptick in cases from Omicron
– but this surge will be below the Summer 2021 surge
– thus, our view of 250,000 to 300,000 cases might be too aggressive
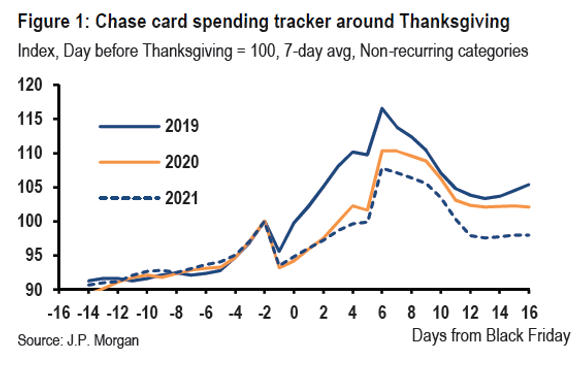
…US consumers already had Omicron panic
Yet, consumers are panicking. As JPMorgan Credit Card data shows (from JPMorgan Economists), credit card spending in 2021 diverges from 2020 and 2019. The level of spending is far weaker recently:
– this suggests consumers are reacting to the Omicron risks
– as we noted above, this reaction differs from Summer 2021
– as current panic is far faster and earlier
STRATEGY: Omicron is rattling market confidence, with its high amplitude, but market likely bottoms before Omicron cases peak
Omicron is sweeping across the globe and it’s unsettling. We know that there will be shocks:
– US consumer panic
– China and other nations pursuing “zero case” strategies will panic
But
– Omicron has peaked in South Africa
– It might be peaking in UK
– IHME forecasts a USA peak in early Jan
– White House likely to shift focus away from cases
So this is a multiple-phase reaction.
And it reminds me of the 2002 Movie Minority Report (20th Century Fox) about a pre-crime division. Citizens are arrested for future crimes that they potentially will commit.
– this is what we are seeing with equities now
– Omicron variant is causing a far swifter and earlier reaction to cases

But as we noted above, tactically speaking, Mark Newton is looking for a tradeable low to happen between 12/22 to 12/24. So, keep the eye on the larger prize.
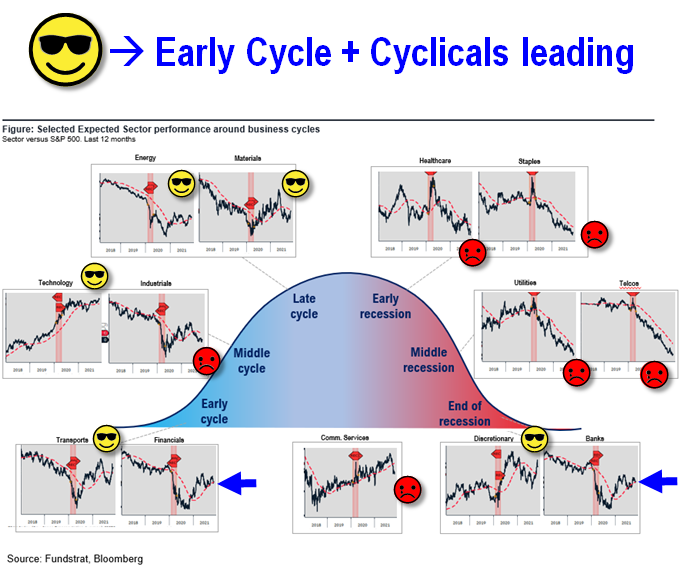
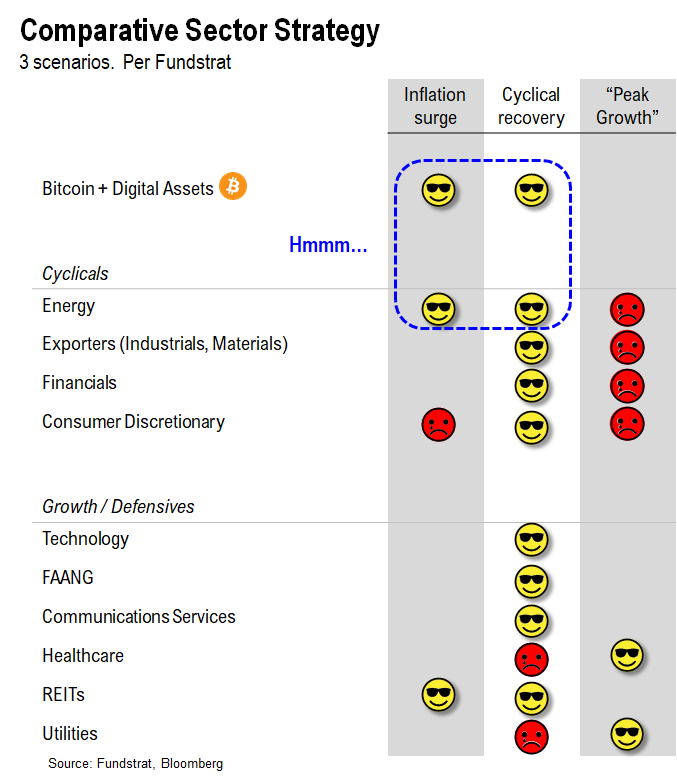
SECTORS: Leadership still Cyclicals/Early-cycle aka Epicenter
Relative sector performance is shown below and as we can see, 5 sectors are showing positive relative trend:- Energy
– Basic Materials
– Technology
– Transports
– Discretionary
– sort of Financials/Banks
These are all cyclical groups. And also have general positive exposure to reflationary trends. Inflation, incidentally, in isolation is not a bad word. The real risk to markets is:
– too much inflation hurting consumer confidence
– or unanchored inflation expectations, fear of uncontained inflation
This is not necessarily what markets seem to be pricing. If markets were worried about either of the above, Defensive stocks or Growth stocks would be leading. Instead, we are seeing Cyclicals lead.
Into YE, our recommended strategies are:
– Energy
– Homebuilders (Golden 6 months) XHB
– Small-caps IWM-0.49%
– Epicenter XLI-0.80% XLF-0.02% XLB0.07% RCD
– Crypto equities BITO-3.69% GBTC-4.10% BITW-2.64%
Into 2022…
– Industrials
30 Granny Shot Ideas: We performed our quarterly rebalance on 10/25. Full stock list here –> Click here
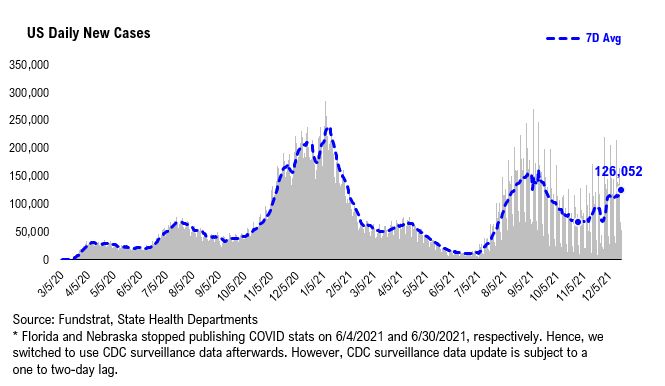
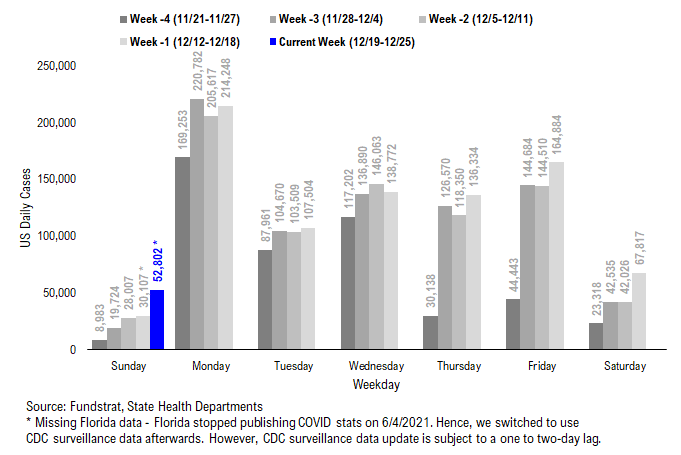
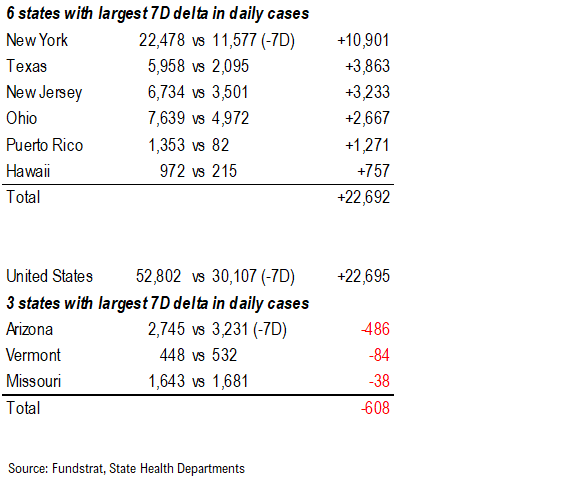
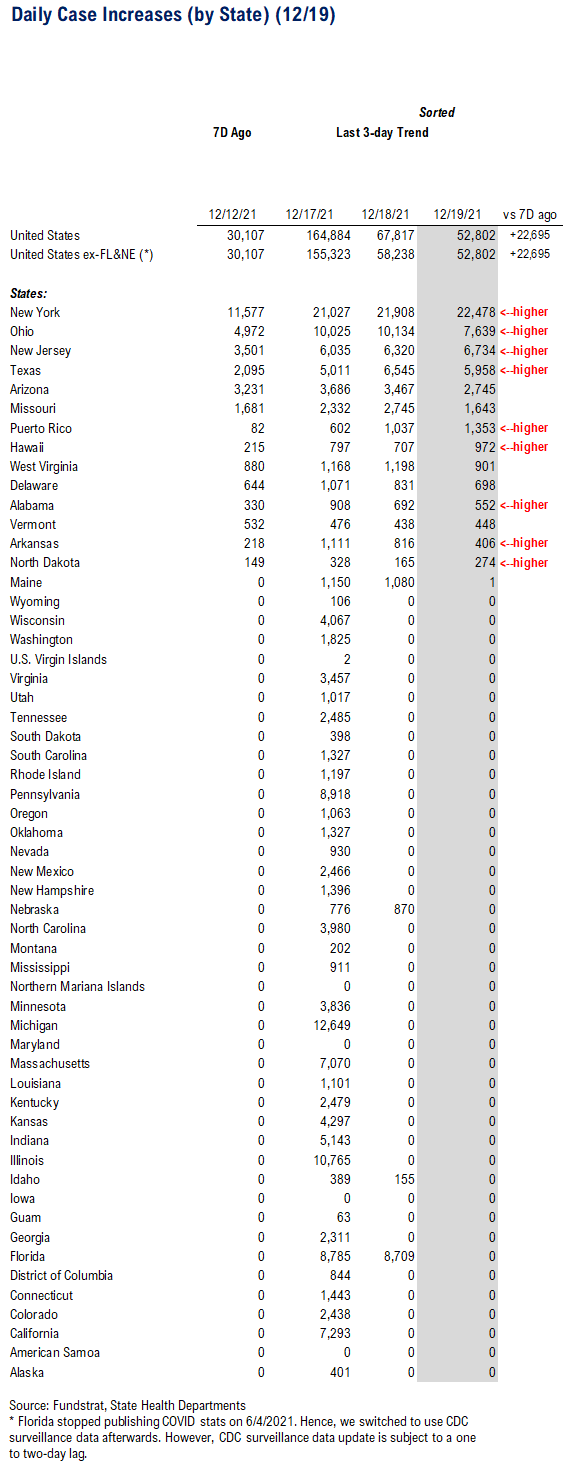
POINT 1: Daily COVID-19 cases 52,802, up +22,695 vs 7D ago…
Current Trends — COVID-19 cases:
- Daily cases 52,802 vs 30,107 7D ago, up +22,695
- 7D positivity rate 9.3% vs 8.2% 7D ago
- Hospitalized patients 64,711, up +7.8% vs 7D ago
- Daily deaths 1,288, up +1.8% vs 7D ago
On Sunday, 13 states + Puerto Rico reported a total of 52,802 new cases. As fewer states report COVID stats over the weekend, we normally see smaller increases in daily cases on these days. However, as Omicron variant continues to spread across the country, we see daily cases increase by 22,695 compared to 7D ago. Almost all states and PR reported a higher case figure except Arizona, Missouri, and Vermont. NY and NJ, the states with worst Omicron spread within US (see our notes last week), accounted for more than half of the new cases reported on Sunday. And both states see daily cases nearly doubled compared to 7D ago.
`
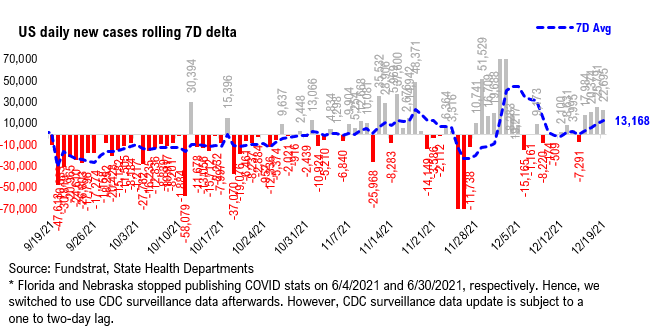
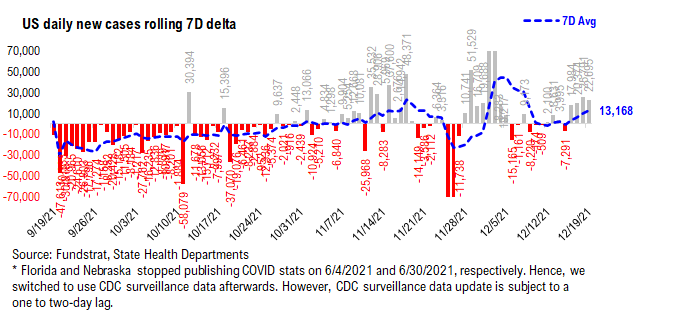
Rolling 7D delta Thanksgiving distortion beginning to clear out…
The rolling 7D delta Thanksgiving distortion is beginning to clear out as evident by the more consistent trend in the data. Not a surprise, 7D delta in daily cases is creeping higher – 7D delta has been > 20,000 over the past 3 days.
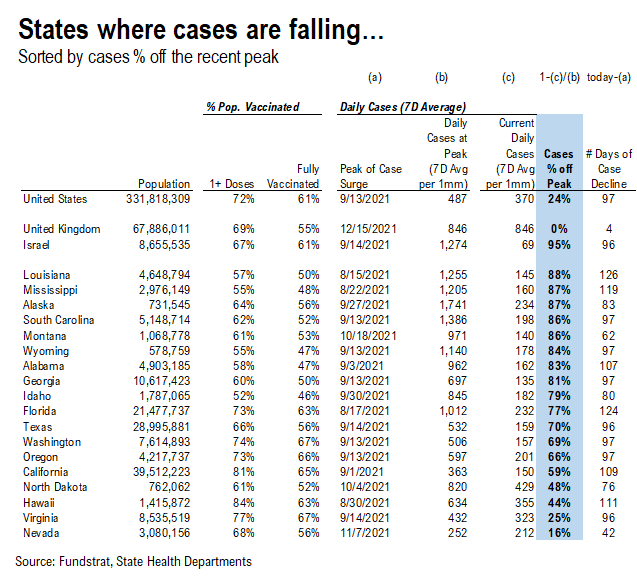
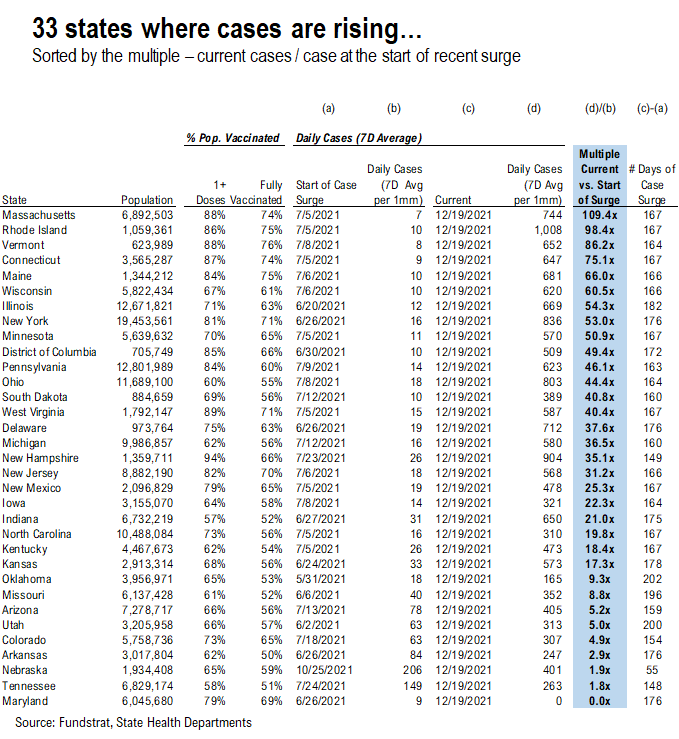
33 states are seeing a rise in cases while cases continue to decline in the remaining states…
*** We’ve split the “Parabolic Case Tracker” into 2 tables: one where cases are falling, and the other where cases are rising
In these tables, we’ve included the vaccine penetration, case peak information, and the current case trend for 50 US states + DC. The table for states where cases are declining is sorted by case % off of their recent peak, while the table for states where cases are rising is sorted by the current daily cases to pre-surge daily cases multiple.
- The states with higher ranks are the states that have seen a more significant decline / rise in daily cases
- We also calculated the number of days during the recent case surge
- The US as a whole, UK, and Israel are also shown at the top as a reference
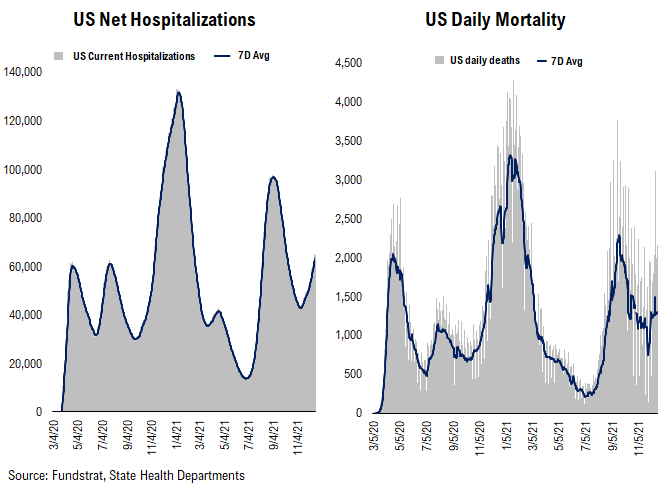
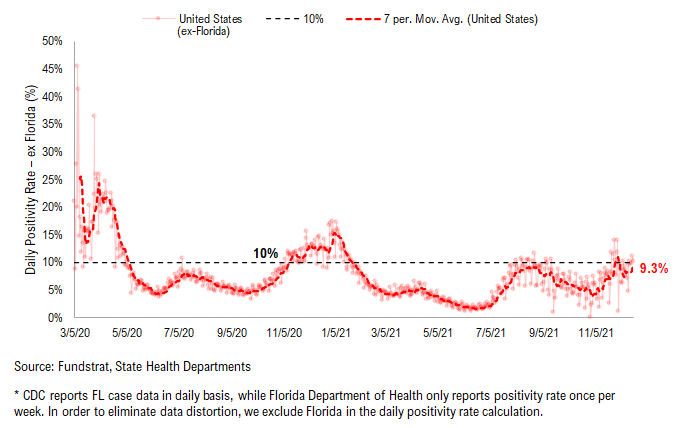
Hospitalizations, deaths, and positivity rates are rising…
Below we show the aggregate number of patients hospitalized due to COVID, daily mortality associated with COVID, and the daily positivity rate for COVID.
– Both net hospitalizations and daily death have turned upwards.
– After falling for a few days, positivity rate started to climb again. But good news is the positivity rate remains below 10%. This means 1) the spread of the virus is still “manageable”; 2) enough tests are performed each day – testing is the key to detect and gauge the situation of virus spread.
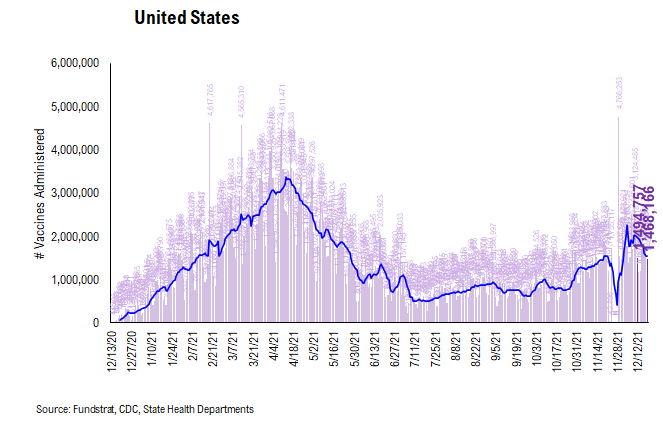
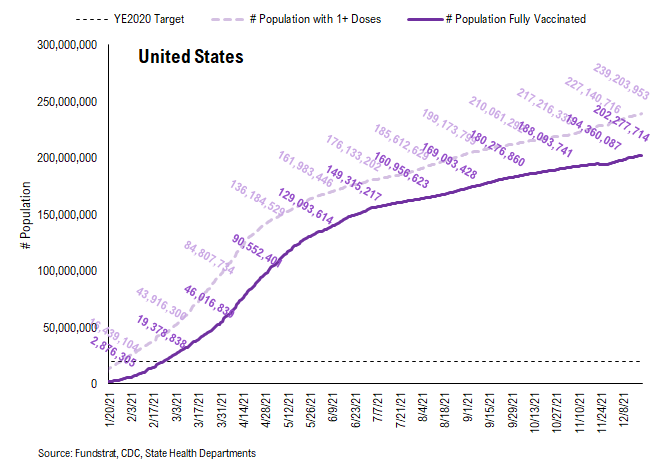
POINT 2: VACCINE: vaccination pace accelerates as boosters become more widely available…
Current Trends — Vaccinations:
- avg 1.5 million this past week vs 2.0 million last week
- overall, 18.1% received booster doses, 61.0% fully vaccinated, 72.1% 1-dose+ received
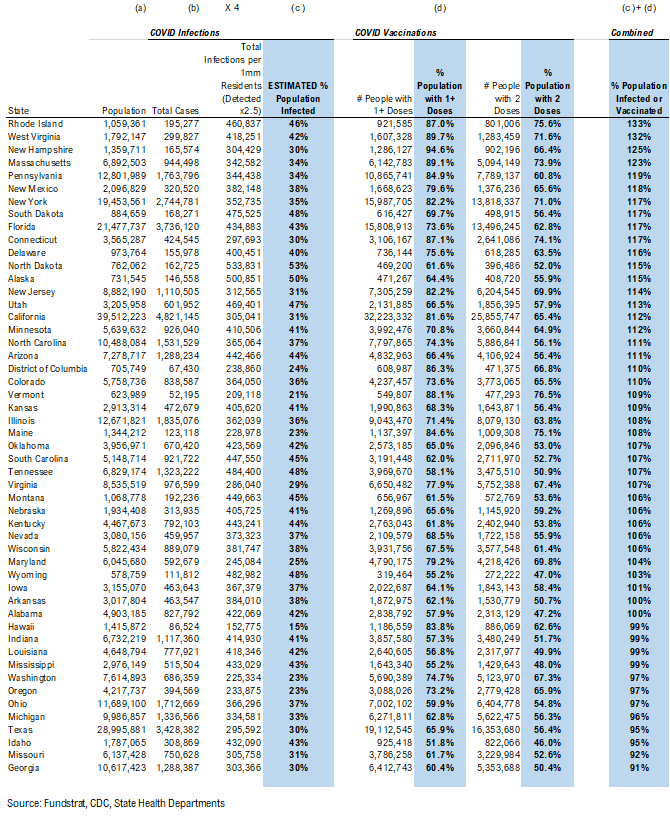
Vaccination frontier update –> all states now near or above 80% combined penetration (vaccines + infections)
*** We’ve updated the total detected infections multiplier from 4.0x to 2.5x. The CDC changed the estimate multiplier because testing has become much better and more prevalent.
Below we sorted the states by the combined penetration (vaccinations + infections). The assumption is that a state with higher combined penetration is likely to be closer to herd immunity, and therefore, less likely to see a parabolic surge in daily cases and deaths. Please note that this “combined penetration” metric can be over 100%, as infected people could also be vaccinated (actually recommended by CDC).
– Currently, all states are near or above 90% combined penetration
– Given the 2.5x multiplier, all states besides AR, HI, LA, MS, IN, WA, WV, OR, TX, OH, ID, MI, MO, and GA are now above 100% combined penetration (vaccines + infections). Again, this metric can be over 100%, as infected people could also be vaccinated. But 100% combined penetration does not mean that the entire population within each state is either infected or vaccinated
There were a total of 1,468,166 doses administered reported on Sunday. With the introduction of the Omicron variant, we’ve been seeing the vaccination pace accelerate compared to this Fall. Also, the same catalysts remain in place:
- Proof of vaccination required by many US cities and venues
- Booster shots
- Israel study shows efficacy of vaccines against Omicron variant (although reduced)
The daily number of vaccines administered remains the most important metric to track this progress and we will be closely watching the relevant data.
This is the state by state data below, showing information for individuals with one dose and two doses.
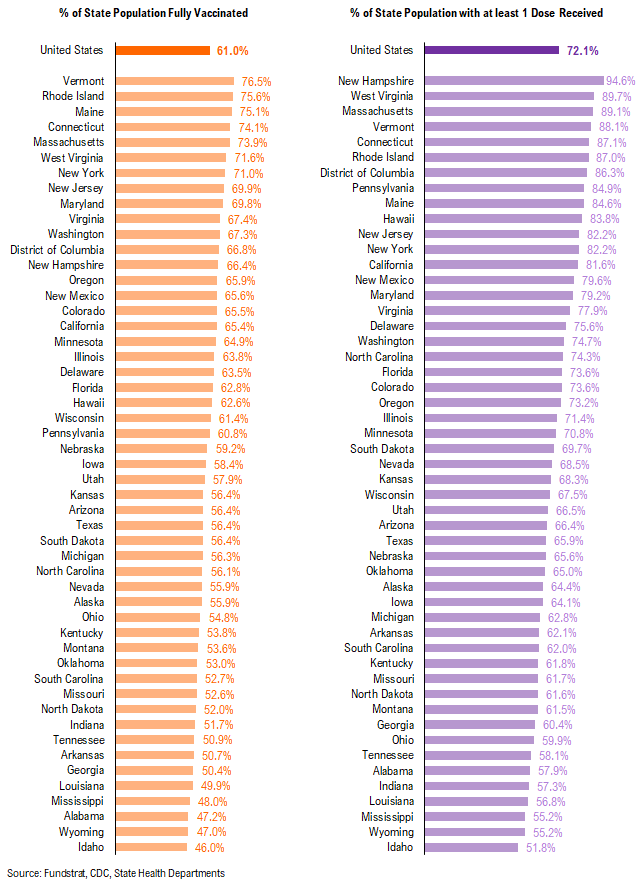
In total, 441 million vaccine doses have been administered across the country. Specifically, 239 million Americans (72% of US population) have received at least 1 dose of the vaccine. And 202 million Americans (61% of US population) are fully vaccinated.
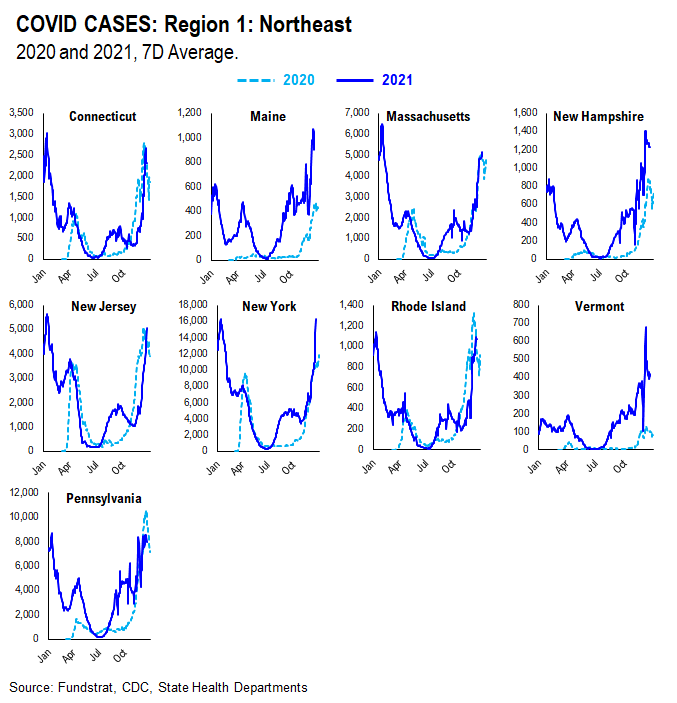
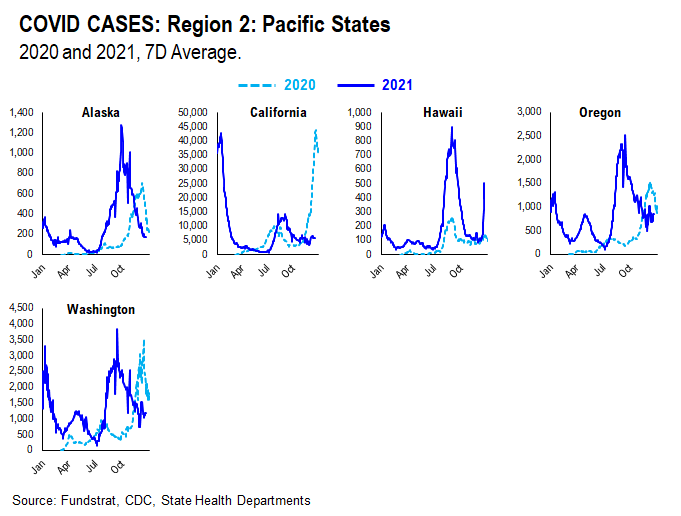
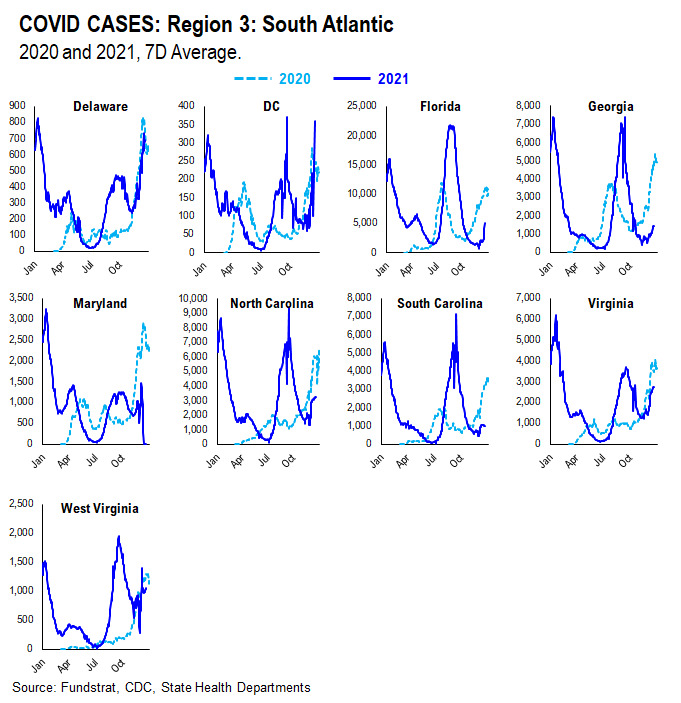
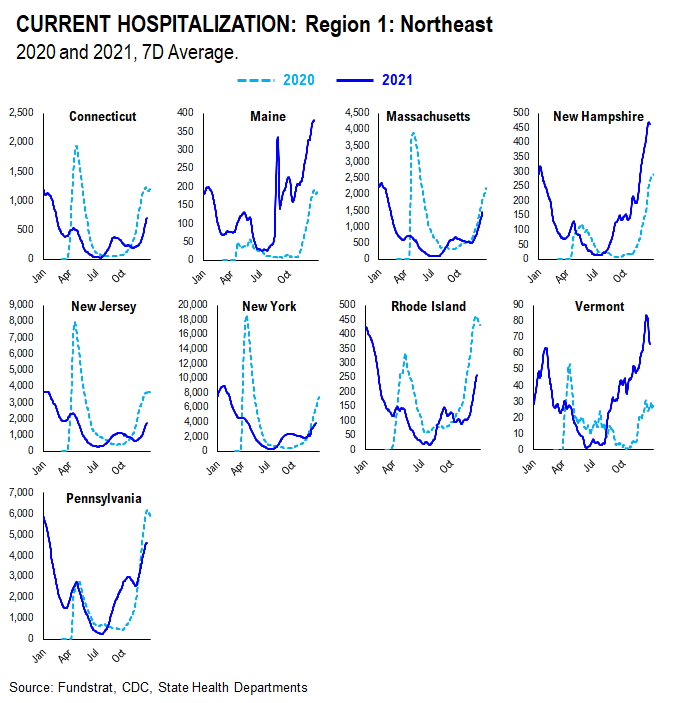
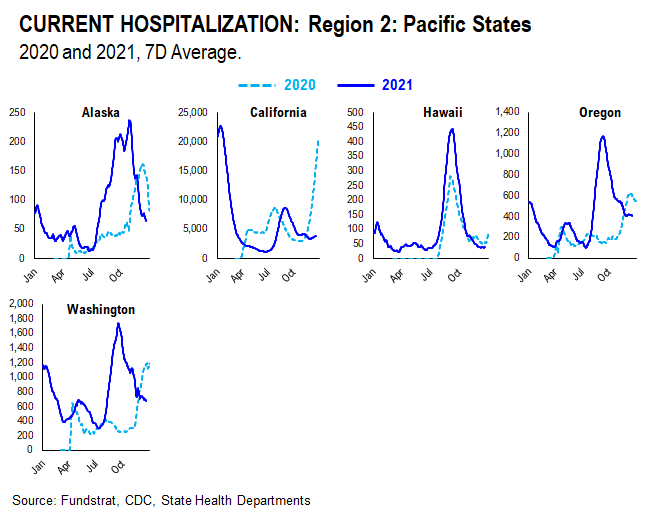
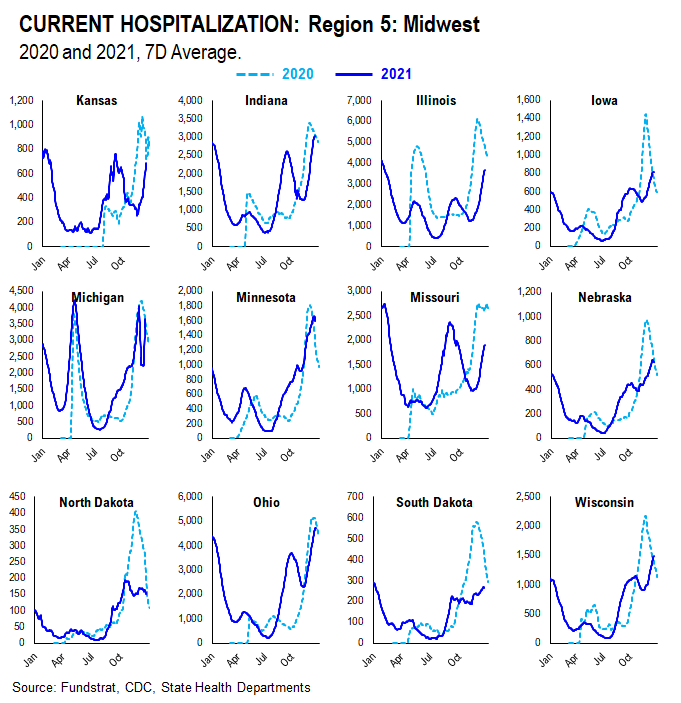
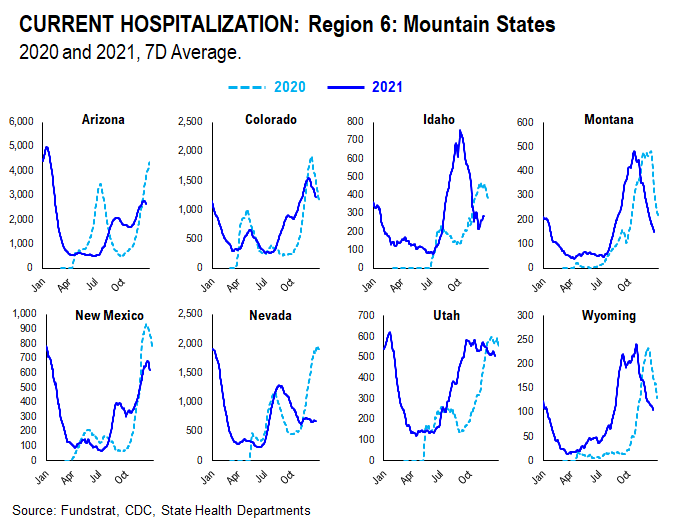
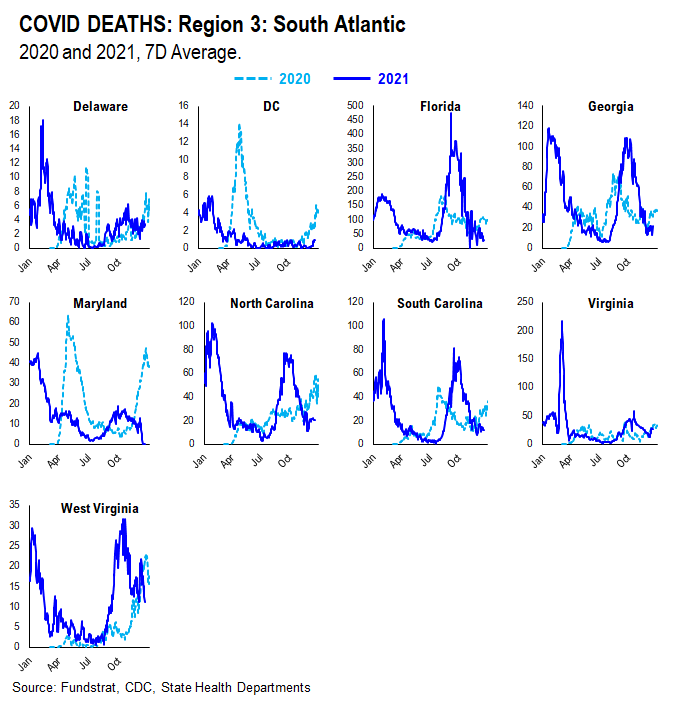
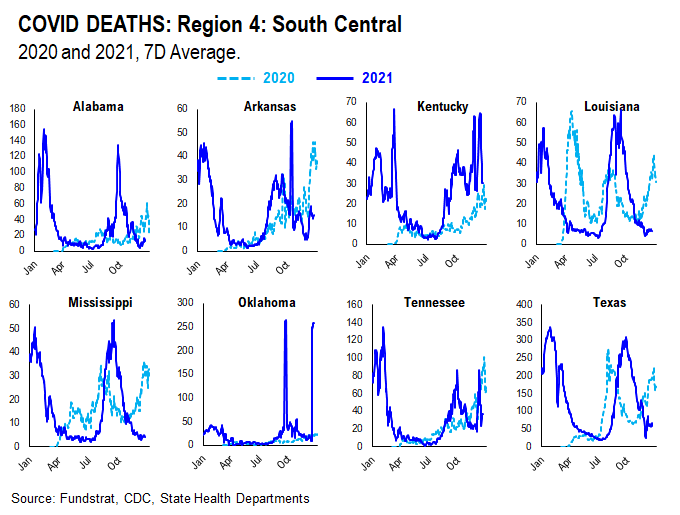
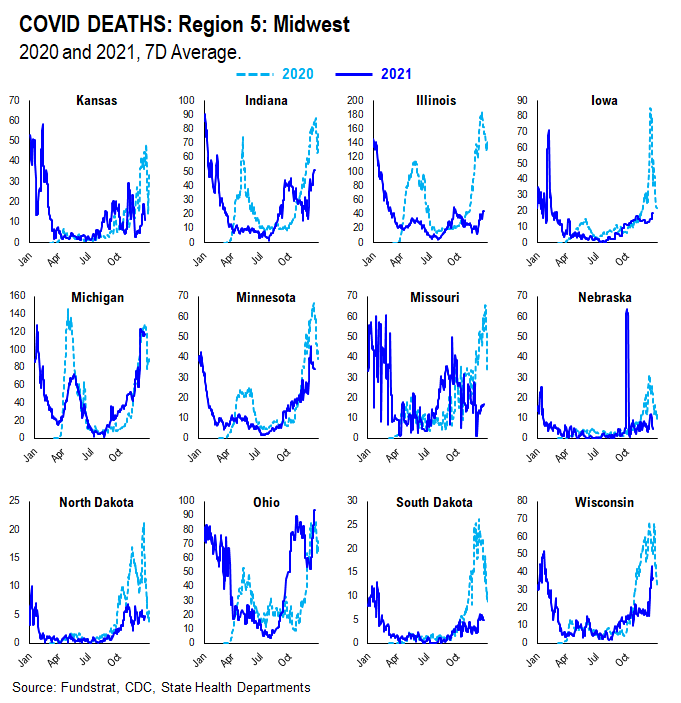
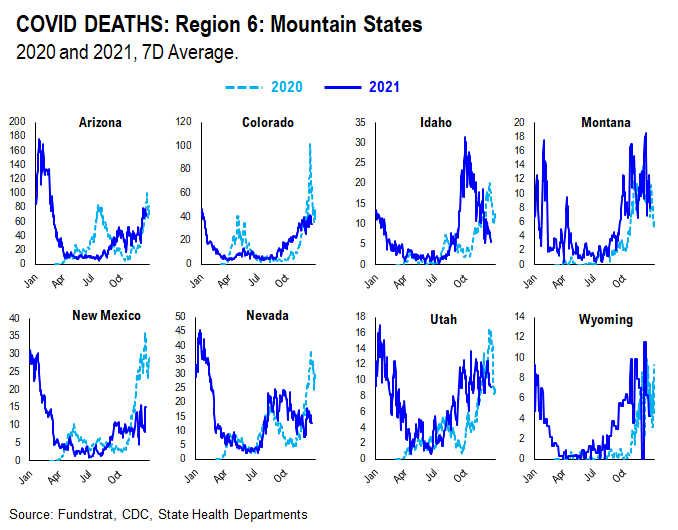
POINT 3: Tracking the seasonality of COVID-19
In July, we noted that many states experienced similar case surges in 2021 to the ones they experienced in 2020. As such, along with the introduction of the more transmissible Delta variant, seasonality also appears to play an important role in the recent surge in daily cases, hospitalization, and deaths. Therefore, we think there might be a strong argument that COVID-19 is poised to become a seasonal virus.
The possible explanations for the seasonality we observed are:
– Outdoor Temperature: increasing indoor activities in the South vs increasing outdoor activities in the northeast during the Summer
– “Air Conditioning” Season: similar to “outdoor temperature”, more “AC” usage might facilitate the spread of the virus indoors
If this holds true, seasonal analysis suggests that the Delta spike could roll over by following a similar pattern to 2020.
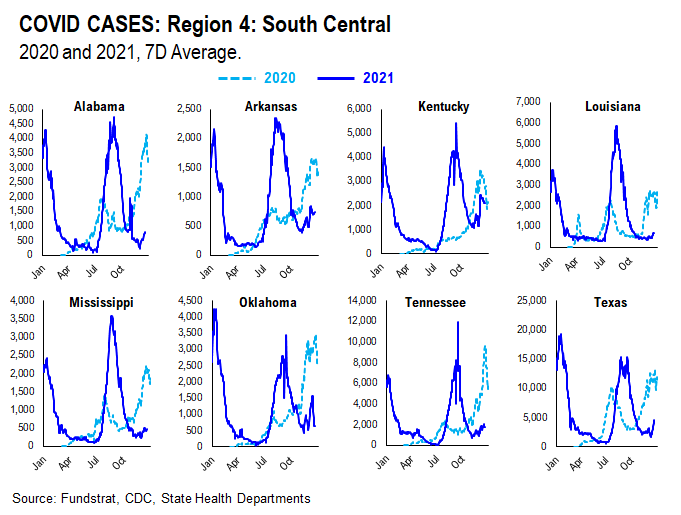
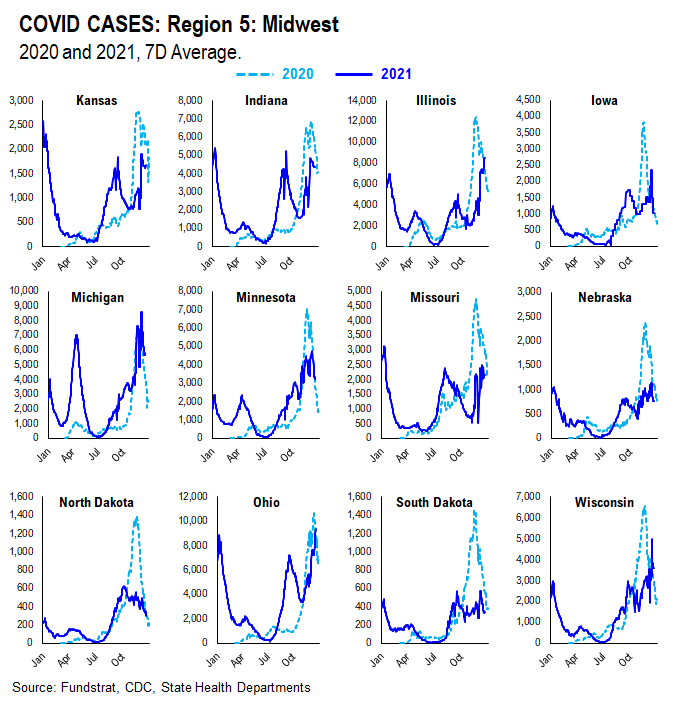
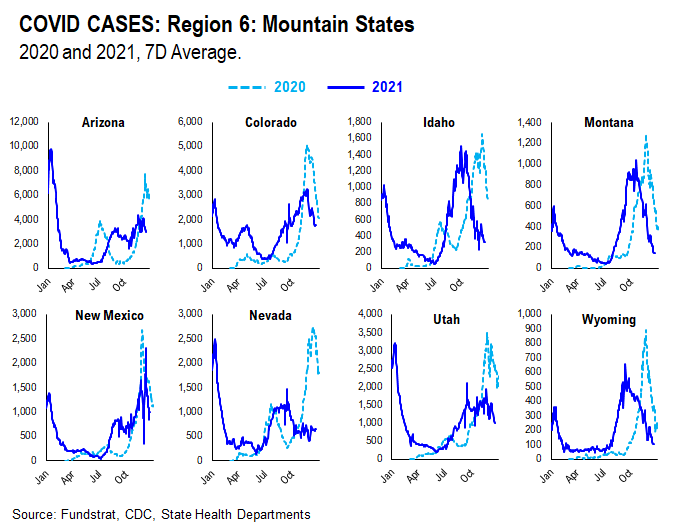
We created this section within our COVID update which tracks and compare the case, hospitalization, and death trends in both 2020 and 2021 at the state level. We grouped states geographically as they tend to trend similarly.
CASES
It seems as if the main factor contributing to current case trends right now is outdoor temperature. During the Summer, outdoor activities are generally increased in the northern states as the weather becomes nicer. In southern states, on the other hand, it becomes too hot and indoor activities are increased. As such, northern state cases didn’t spike much during Summer 2020 while southern state cases did. Currently, northern state cases are showing a slight spike, especially when compared to Summer 2020. This could be attributed to the introduction of the more transmissible Delta variant and the lifting of restrictions combined with pent up demand for indoor activities.
HOSPITALIZATION
Current hospitalizations appear to be similar or less than Summer 2020 rates in most states. This is likely due to increased vaccination rates and the vaccine’s ability to reduce the severity of the virus.
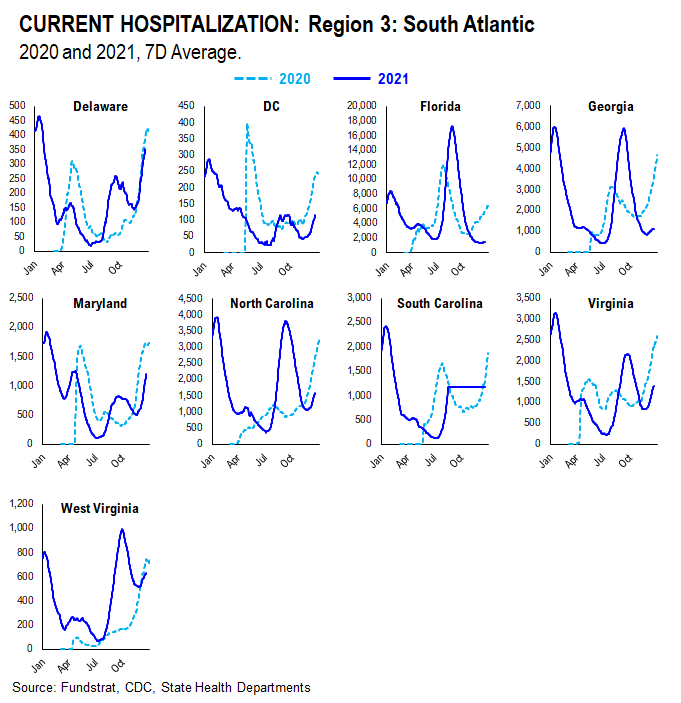
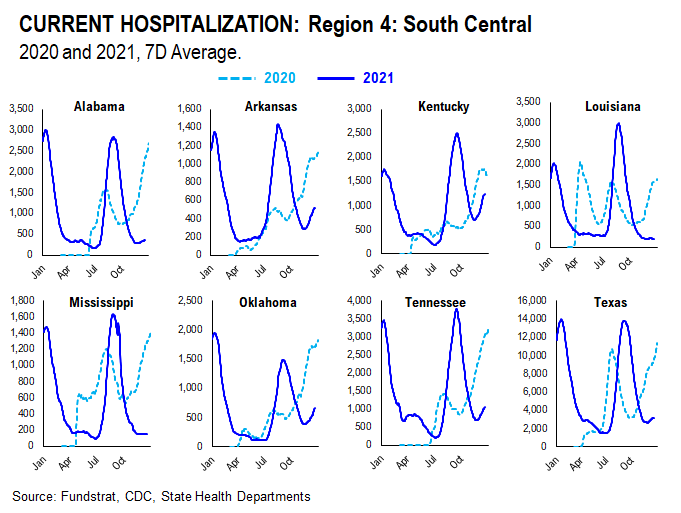
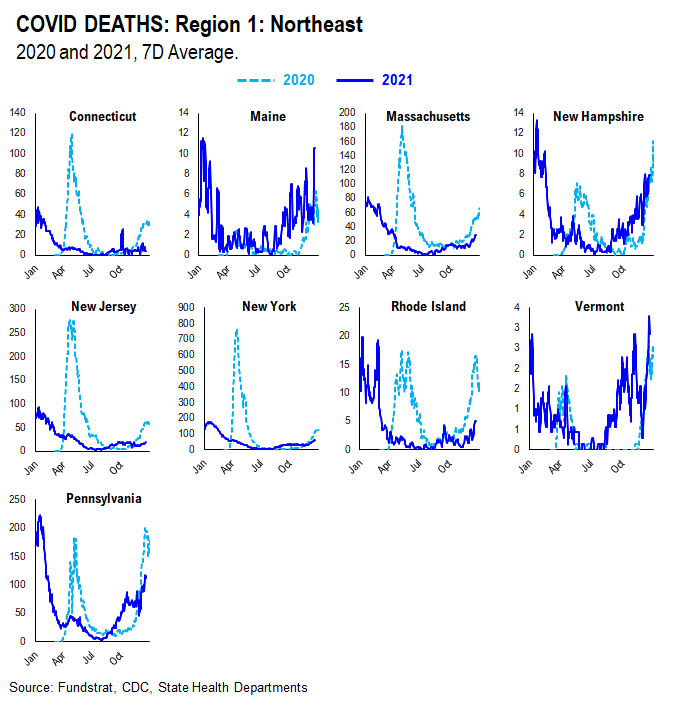
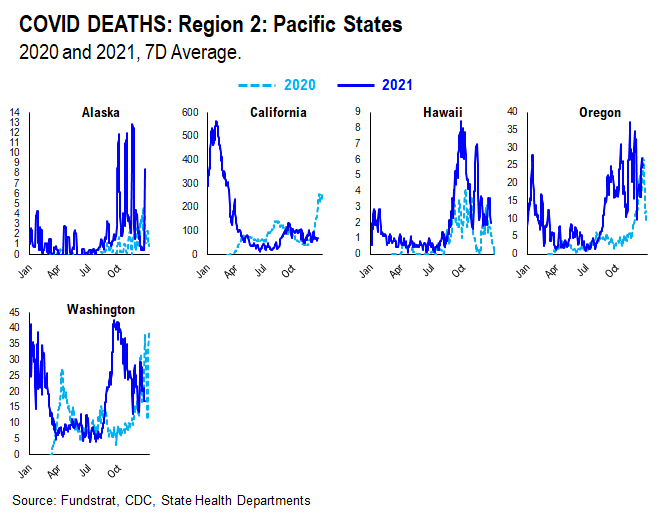
DEATHS
Current death rates appear to be scattered compared to 2020 rates. This is likely due to varying vaccination rates in each state. States with higher vaccination rates seem to have lower death rates given the vaccine’s ability to reduce the severity of the virus; states with lower vaccination rates seem to have higher death rates.
More from the author
Articles Read 1/2
🎁 Unlock 1 extra article by joining our Community!
Stay up to date with the latest articles. You’ll even get special recommendations weekly.
Already have an account? Sign In 28f644-097728-ceb031-a45c45-3c811e
Already have an account? Sign In 28f644-097728-ceb031-a45c45-3c811e

