
Taking Some Chips Off the Table (Core Strategy Rebalance)
Key Takeaways
- The U.S. government is confronted with a potential debt ceiling showdown as the Treasury General Account (TGA) balance is limited to $166 billion, creating an urgent need for resolution to prevent default. Historical precedent indicates that resolving the debt ceiling could impact private market liquidity and influence risk assets such as BTC.
- An increasing MVRV Ratio suggests that Bitcoin, which has risen above 1x to approach 1.5x and nears its long-term moving average of 1.7x, is no longer in a "deep value" territory.
- A declining SOPR indicates the possibility of investors realizing losses, potentially signaling a decrease in bullish market momentum and increased trading caution, which merits careful monitoring as it may reflect shifts in market dynamics and investor sentiment.
- Despite cautionary factors, we remain in the early stages of the crypto cycle with promising upside potential, supported by historical price trends and positive on-chain indicators, including a bullish turnaround in realized cap suggesting capital inflow into the bitcoin network. Additionally, given the rebound in major central banks' balance sheet assets since October, marking a bottom in global liquidity, we foresee the conclusion of the most severe monetary tightening period and the commencement of a long-term upswing in global liquidity.
- Core Strategy – In light of near-term risks, we deem it prudent to take some profits and reserve dry powder for potential drawdowns while maintaining a largely allocated position given the intermediate-term bullish outlook for crypto.
Tackling the Debt Ceiling Risk
Net Liquidity Refresh
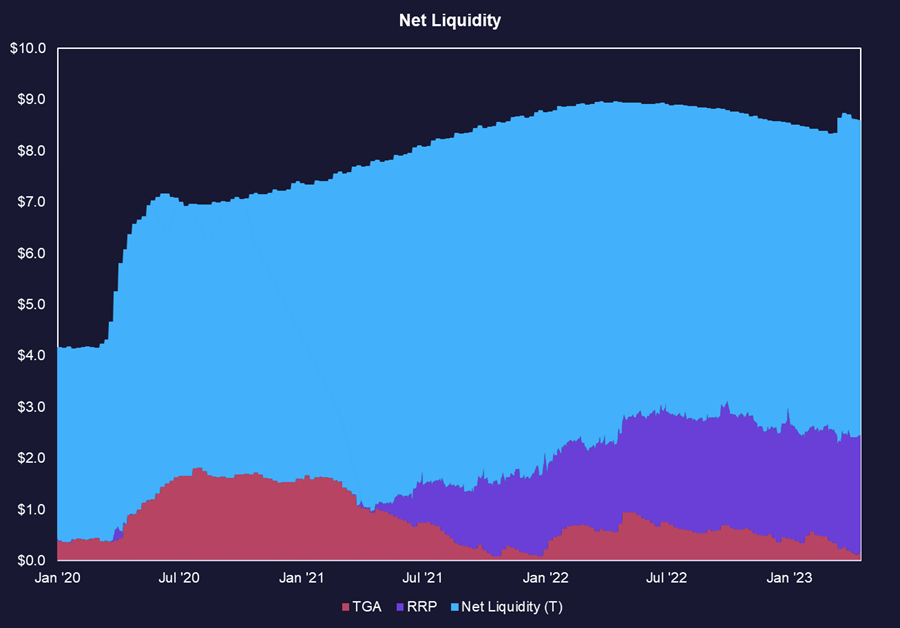
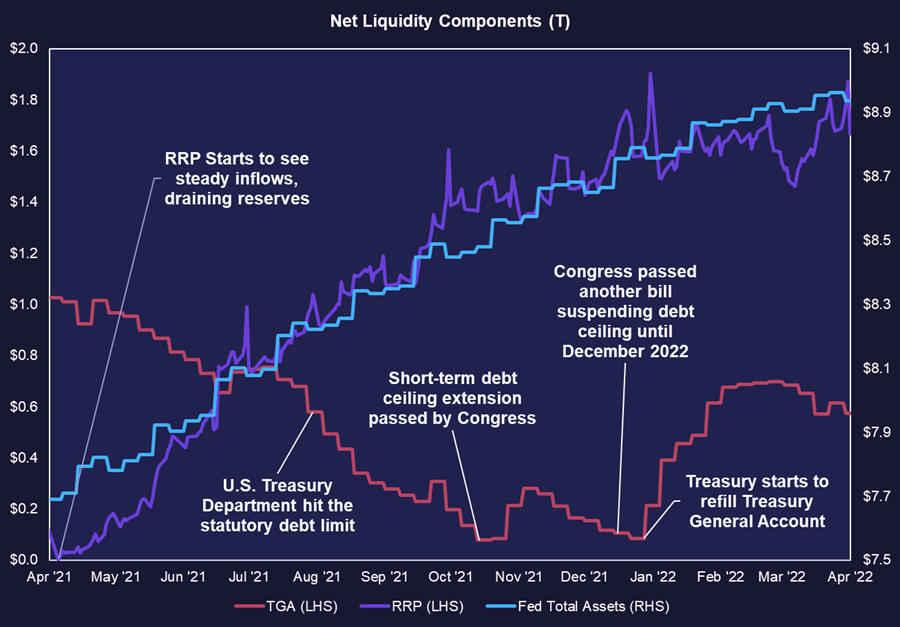
A major theme of this year has revolved around the shifting landscape of global liquidity. Stimulus measures from central banks like the People’s Bank of China (PBOC) and the Bank of Japan (BOJ), along with a unique domestic liquidity situation where the Fed is technically performing Quantitative Tightening (QT), but their efforts are counterbalanced by a declining Treasury General Account (TGA) and a fluctuating Reverse Repurchase Facility (RRP), have provided a significant tailwind for bitcoin and the broader crypto ecosystem.
Source: Fundstrat, TradingView
In January, in our note entitled Hitting the Debt Ceiling and the Buy Button, we discussed the implications of the debt ceiling for U.S. liquidity and its potential impact on bitcoin. We emphasized that bitcoin’s primary value comes from its resistance to censorship rather than its strict adherence to a capped supply. We also explored how bitcoin performs relatively well during periods of loosening monetary conditions and contracts during periods of tightening monetary conditions.
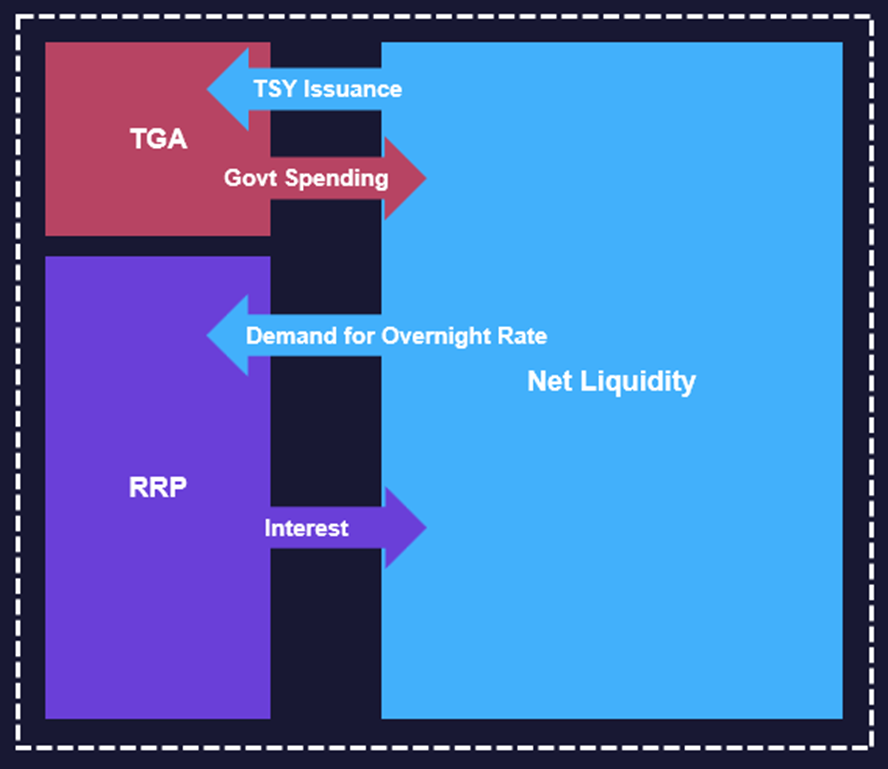
We highlighted the importance of understanding the relationship between the Treasury General Account (TGA), the Reverse Repurchase Facility (RRP), and private market liquidity. The debt ceiling impasse led to the TGA being drawn upon to pay government obligations, injecting liquidity back into the economy.
Source: Fundstrat
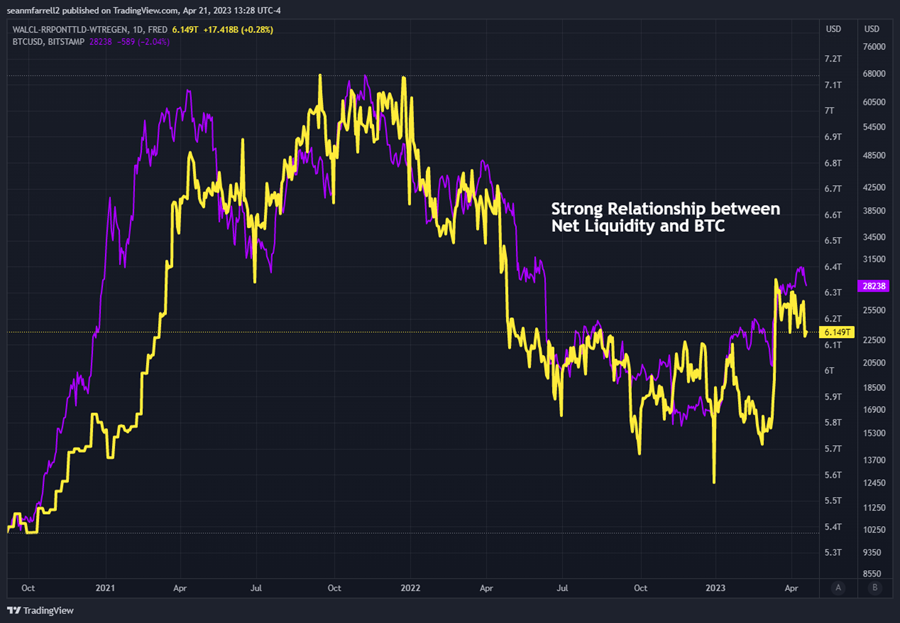
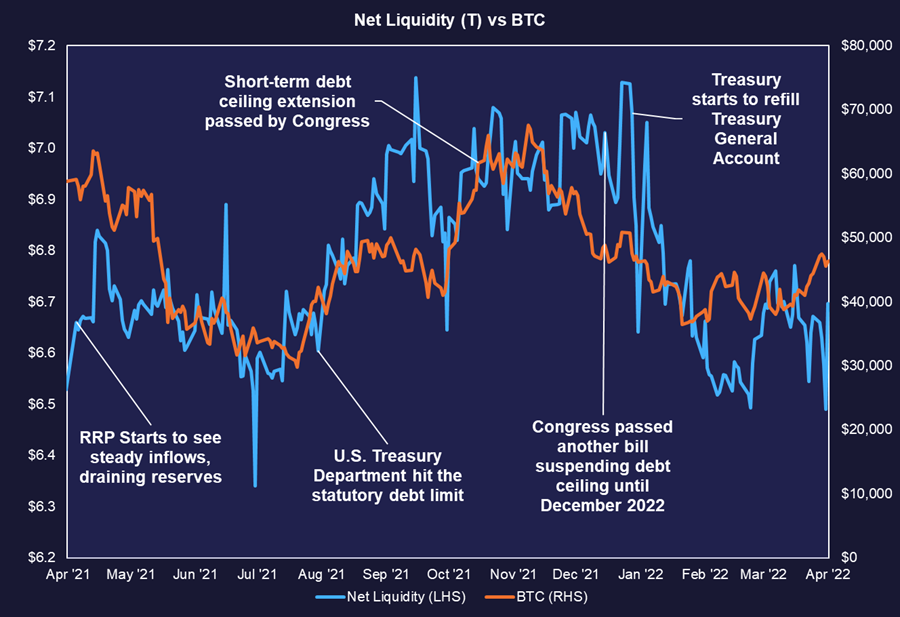
The chart below demonstrates the relatively close relationship between US net liquidity and bitcoin performance. We note that there are two noticeable divergences – one in the midst of the FTX implosion, and one during Q1, when the People’s Bank of China (PBOC) and the Bank of Japan (BOJ) started to accelerate their economic stimulus.
Treasury Has Bills to Pay
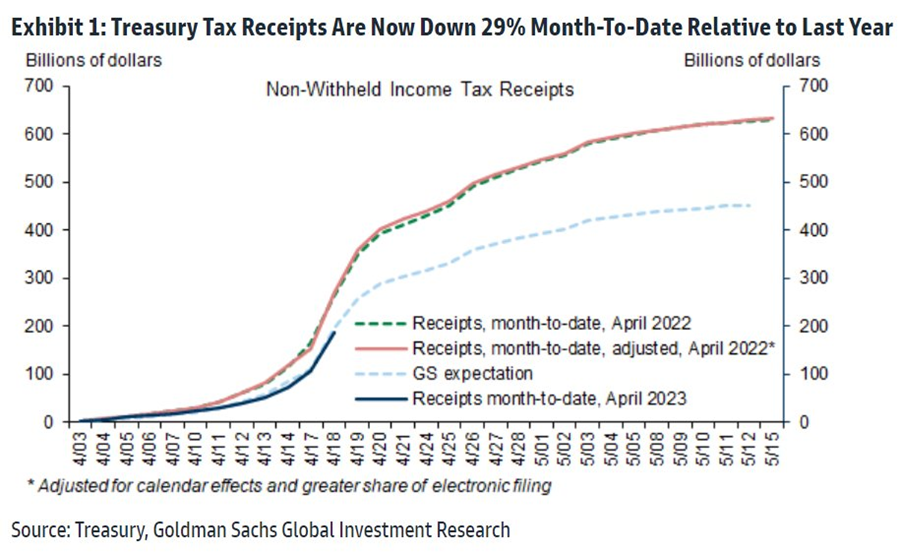
With only $166 billion remaining in the Treasury General Account (TGA), the U.S. government faces limited runway to fund its obligations without raising the debt ceiling. This situation increases pressure on policymakers to address the debt ceiling before the TGA is depleted to avoid potential default on the national debt or other negative consequences for the economy.
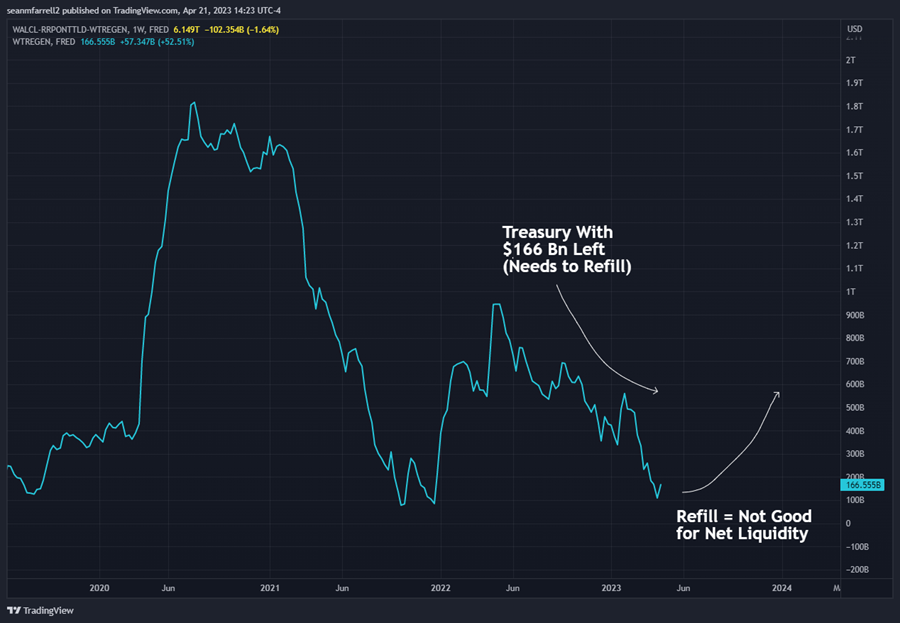
The results from the 2022 tax season could alter the picture regarding the federal debt ceiling deadline. Stronger-than-expected tax collections might provide the government with more time to pay its obligations without raising the debt ceiling, while weaker tax collections could bring the deadline closer, heightening the urgency for addressing the debt ceiling issue. The complete picture will become clearer once all tax receipts for April are accounted for. A clearer understanding of the situation may not emerge until early May, when April receipts are complete.
Historical Precedent
Historical precedent sheds light on the net effects of private market liquidity in response to debt ceiling resolutions. In 2021, the last debt ceiling crisis took place when the U.S. Treasury hit the statutory debt limit in late July. This prompted a rapid outflow from the Treasury General Account (TGA) into the private market, bolstering bitcoin and other risk assets.
In October of the same year, Congress passed a short-term debt ceiling agreement. This led the Treasury Department to sell Treasuries, effectively drawing private market liquidity back into the TGA.
Ultimately, Congress enacted another bill that suspended the debt ceiling until December 2022. This resulted in a significant replenishment of the TGA and a substantial withdrawal of liquidity from the market. This situation underscores the interconnected relationship between debt ceiling resolutions and private market liquidity.
Source: Fundstrat, TradingView
In the chart below, we overlay BTC price on top of net liquidity to illustrate the relationship between the two. As a reminder, net liquidity is derived from the three metrics observed in the previous chart (Fed Assets – RRP – TGA). It’s worth noting that during this entire timeframe, an increasing number of participants sought a safe overnight yield, leading to a growing RRP balance.
Worthy of note, if the Fed were to stop their rate hikes and short-term rates decrease, or if the Fed decided to reduce the RRP rate, the RRP balance could potentially act as a form of quasi-QE. However, such a development does not appear to be imminent at this time.
Source: Fundstrat, TradingView
Considering the dynamic described above, it’s reasonable to believe that an impending debt ceiling resolution is the number one reason to consider taking some chips off the table. The historical relationship between debt ceiling resolutions and private market liquidity, particularly its impact on bitcoin and other risk assets, suggests that a resolution could lead to a (short-term) withdrawal of liquidity from the market, potentially affecting asset prices negatively.
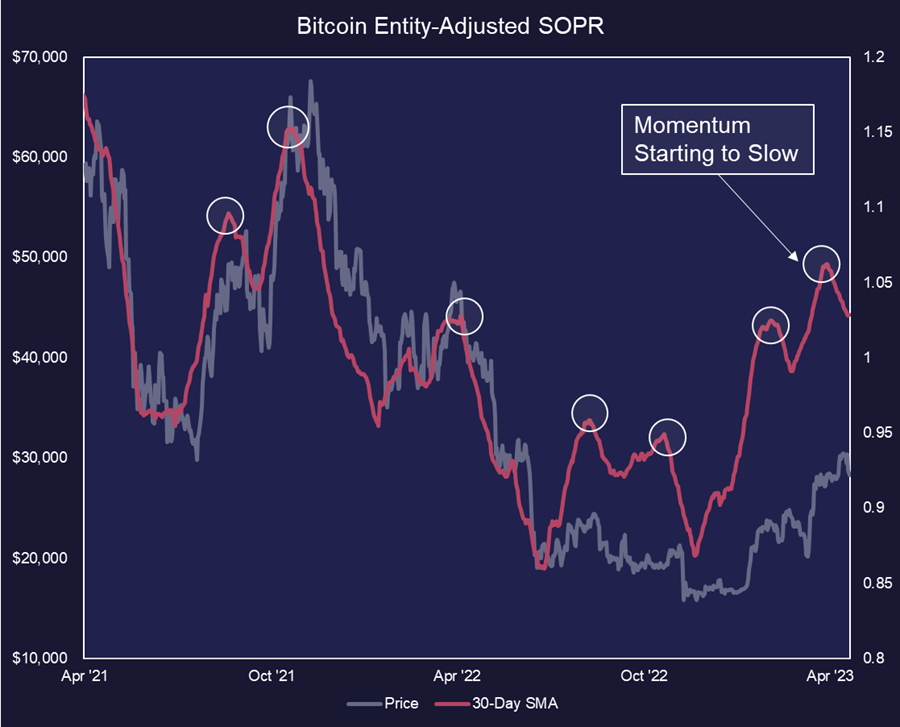
Momentum Looks to Be Slowing
Momentum in the bitcoin market appears to be slowing, as indicated by the recent trend in the SOPR (Spent Output Profit Ratio) metric. SOPR measures the average profit or loss of coins that have been transacted on a given day. A SOPR value greater than 1 suggests coins are being sold at a profit, while a value less than 1 implies coins are being sold at a loss.
Lately, SOPR has shown signs of turning over, potentially signaling a shift in market sentiment. The 30-day moving average of SOPR seems to have reached a local peak and could be on a trajectory to move lower.
This declining SOPR trend suggests that investors may be realizing losses, and there may be less willingness to spend coins that are currently profitable. The result is a decrease in bullish momentum in the market, and a potential increase in investor caution.
It is important for market participants to monitor this downward trend in SOPR, as it may signal changes in market dynamics and behavior among investors. A continued decline in SOPR could point to a more cautious and risk-averse environment.
Source: Fundstrat, Glassnode
No Longer in “Deep Value” Territory
The MVRV Ratio is a metric that evaluates the speculative value of a cryptoasset relative to its realized value, acting as a multiple of the network’s cost basis. Realized value, or realized capitalization, measures the aggregate value of all coins based on their last on-chain transaction price.
An MVRV Ratio above 1x suggests that the market value surpasses the cost basis, indicating average investor profitability, while an MVRV Ratio below 1x implies average investor losses. Bitcoin’s MVRV has risen above 1x and is nearing 1.5x, approaching its long-term average of around 1.7x, signaling that it is no longer in “deep value” territory and may not be as attractively priced for investors with a time horizon under 6 months, despite not being overvalued.
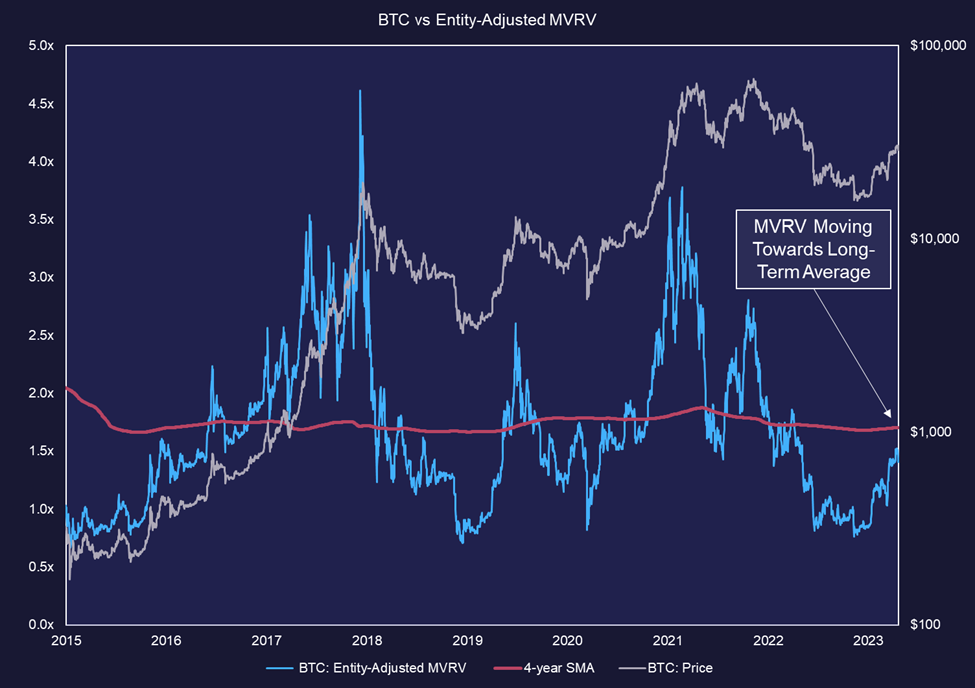
Source: Fundstrat, Glassnode
Ample Reasons to Stay Bullish
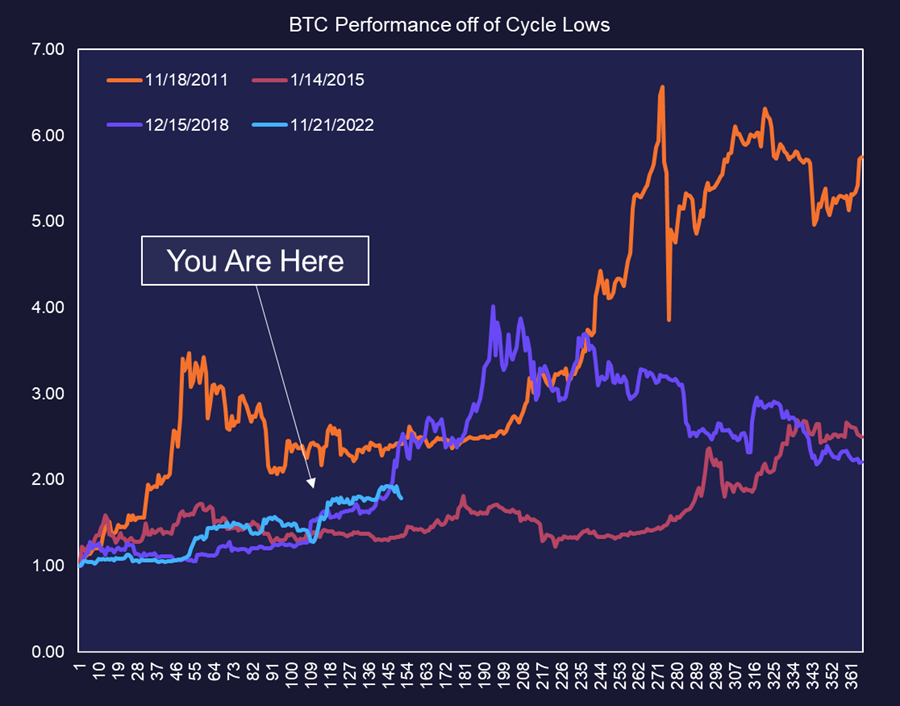
Despite the cautious rhetoric, it’s important to recognize that we are still in the early stages of this crypto cycle, and the intermediate-term risk asymmetry favors upside potential. When comparing current price performance to previous cycle bottoms, we gain insights into our current position and potential future trajectory if the current cycle follows historical patterns. For passive investors, staying allocated to crypto at this stage of the cycle is a sensible approach, given the potential for continued growth.
Source: Fundstrat, Glassnode
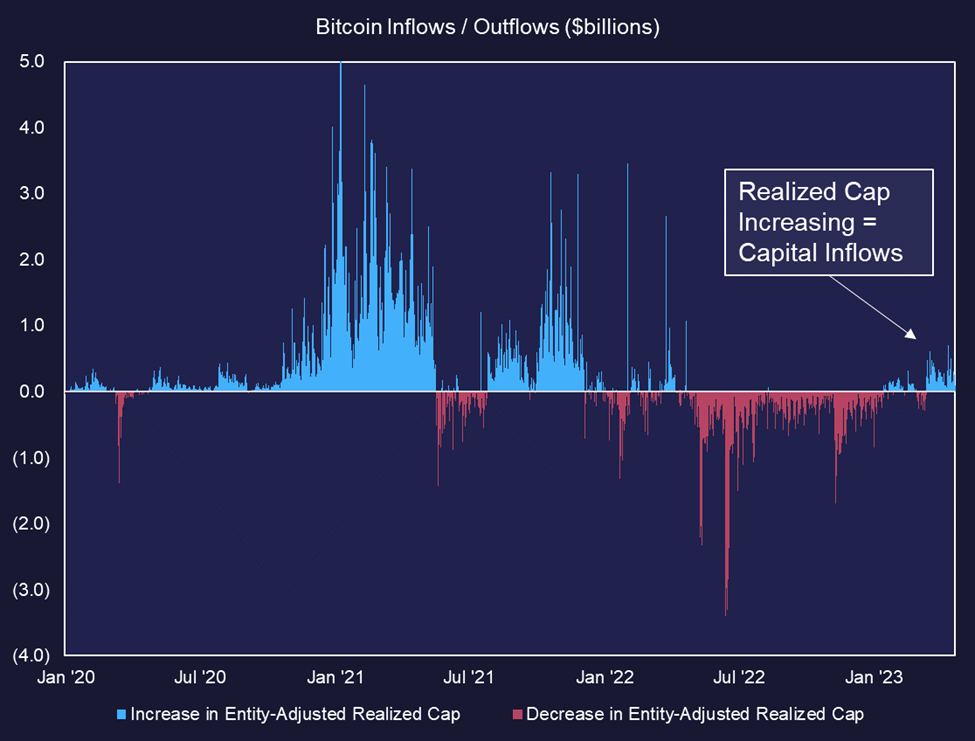
Further, on-chain metrics point toward a long-term bullish trend re-starting. Realized cap, a metric that values each unspent transaction output (UTXO) in a blockchain network based on the price at which it was last moved, serves as an indicator of the value stored in the asset and reflects inflows and outflows into/out of the network. In the past couple of months, realized cap has experienced a notable turnaround, signaling a structurally bullish development for the network. The shift suggests an influx of capital into the crypto space, possibly spurred by the recent rally, and bodes well for the network’s overall health and potential for growth.
Further, on-chain metrics point toward a long-term bullish trend re-starting. Realized cap, a metric that values each unspent transaction output (UTXO) in a blockchain network based on the price at which it was last moved, serves as an indicator of the value stored in the asset and reflects inflows and outflows into/out of the network. In the past couple of months, realized cap has experienced a notable turnaround, signaling a structurally bullish development for the network. The shift suggests an influx of capital into the crypto space, possibly spurred by the recent rally, and bodes well for the network’s overall health and potential for growth.
Source: Fundstrat, Glassnode
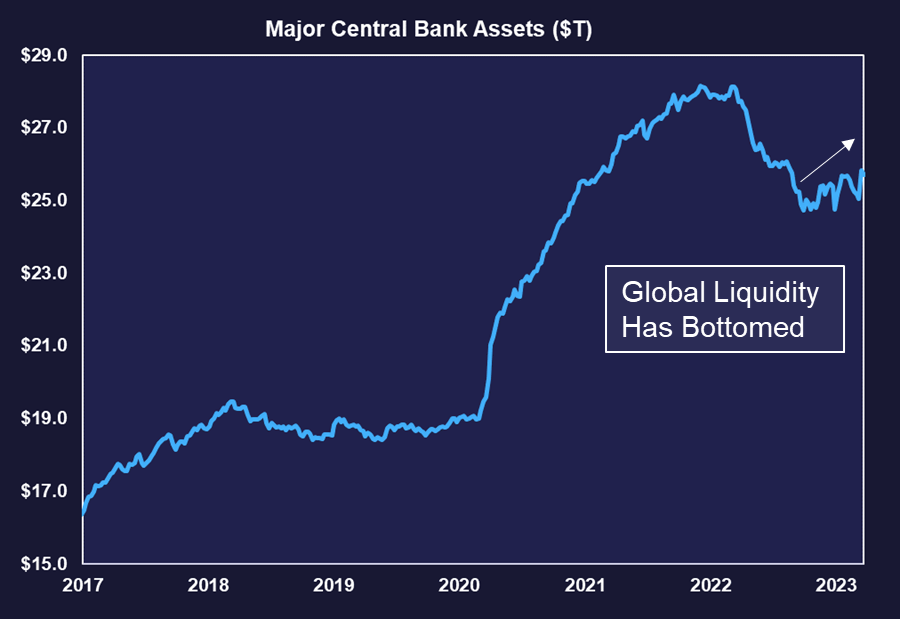
While acknowledging the possibility of reduced market liquidity in the short term, we are confident that global liquidity has reached its long-term bottom and that we are now entering a sustained upswing in global liquidity. Analysis of a frequently referenced chart indicates a bottoming of major central bank balance sheet assets (Fed, PBOC, BOJ, ECB) in October 2022. Although the upward trajectory may not be a straight line, we believe that the harshest phase of global monetary tightening has passed.
Source: Fundstrat, Bloomberg
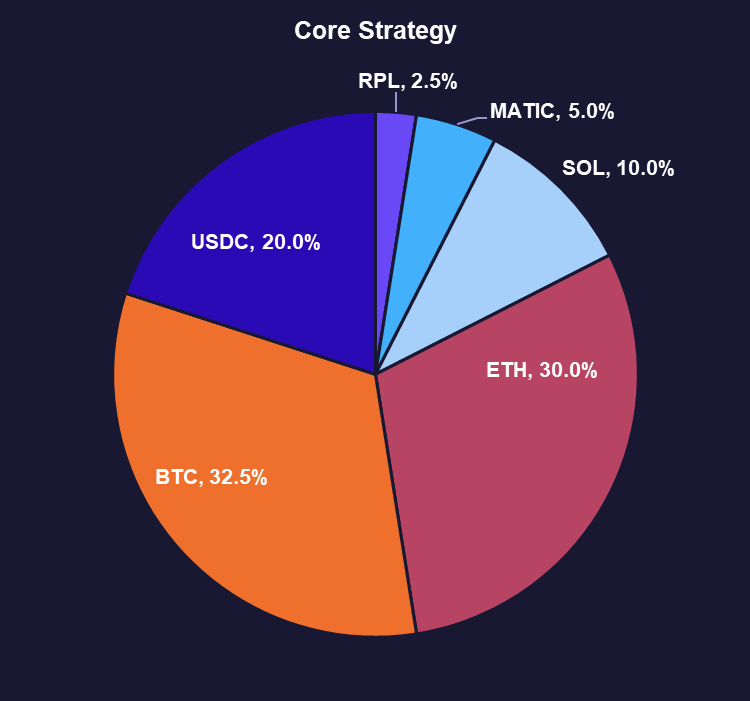
Core Strategy
In light of major near-term risks and the Core Strategy’s strong performance (+26%) since the last March rebalance, we are implementing the following adjustments:
- Realize profits on successful positions and reserve dry powder for potential debt ceiling drawdowns or seasonal-driven downturns.
- Remain mostly allocated, as various indicators point to a continued bullish outlook. Should the market continue its upward trend, altcoins may experience gains, leading to potential outperformance despite holding stablecoins in the Core Strategy.
- Scale back on narrative-driven trades by reducing allocation to MATIC, given the absence of expected tailwinds from Polygon’s zk-rollup launch, and to LDO following the passage of a key catalyst in Shapella, and apparent supply-side overhang from several in-the-money institutional investors. We plan to elaborate more on the latter in future notes.
Source: Fundstrat
Tickers in this Report: $BTC, $ETH, $SOL, $MATIC, $RPL, $LDO
Reports you may have missed

INFLOWS RESUME On Monday, market sentiments were rattled by a surprisingly strong manufacturing PMI figure, marking the first expansionary reading in 18 months. This led to a rise in rates, with risk assets across the board experiencing selloffs amid renewed inflation concerns and fears that the Federal Reserve might need to implement further measures to cool the economy. However, in our crypto comments video on Tuesday, we outlined a couple...

Adding RON and IMX As a Different Flavor of ETH-beta and Gaming Exposure (Core Strategy Rebalance)
MARKET SHRUGS AT HOT CPI The latest Consumer Price Index (CPI) data indicated a hotter inflationary environment than forecasted for February. Despite the surprise in the numbers, market participants appeared largely unmoved, suggesting that the potential impact had already been factored into their calculations prior to the release. This resilience reflects a broader sentiment that a rates-driven selloff, in response to the CPI figures, is not a significant near-term risk....

RESEND: Bitcoin ETF Equilibrium Price Dynamics: ETF likely to drive significant rise in daily demand
BY POPULAR DEMAND, WE ARE RE-SENDING THIS BITCOIN PRICE IMPACT OF SPOT ETF REPORT FROM JULY 24, 2023 The Bitcoin spot ETF was finally approved. And we are seeing the surge in price of Bitcoin because of attractive supply and demand dynamics.We received multiple requests to resend this report from July 24, 2023 which looked at supply and demand dynamics if a spot ETF was approved.In short, we believe a...

FLOWS BEGET MORE FLOWS We have recently discussed the potential return of crypto being correlated with equities due to the new category of market participants entering the fold. However, price action this week suggests that inflows into the BTC ETFs may be throwing water onto that theory. It seems apparent that, at least in the near-term, that the ETF flows narrative is gaining steam, and it is likely that the...

