
Waiting for Yields to Steady, “Digital Silver” Looks like A Good Trade

Key Takeaways
- The crypto market experienced a $200 million liquidation cascade on Thursday evening. An illiquid spot market exacerbated the ensuing drawdown in prices. Open interest remains high, but falling funding rates on perps suggest futures traders may be taking their feet off the gas.
- Market liquidity has experienced a slight pullback due to stubborn short-term rates and a pause in capital injections from PBOC and BOJ. However, the overall change in the global liquidity profile (the flattening of domestic liquidity and Asian central banks' easing) is why crypto has outperformed regional equities. Despite the market increasing the probability of a 50 bps rate hike, there is no indication that the Fed will deviate from its plan, and it would be disconcerting if they amended their views based on one month of hot data.
- The Goerli testnet will undergo the Shanghai upgrade on March 14th, with the mainnet upgrade expected in the second week of April. The update aims to enable withdrawals of staked ether on the mainchain. The potential sell pressure from stakers selling their ETH after the upgrade may be mitigated by (1) the fact that many stakers already have access to liquidity, (2) there is a waiting line for withdrawals, and (3) the market may have already priced in this potential outcome.
- Trade Idea: The Litecoin (LTC) halving event occurs every four years and is scheduled for August this year. Historical data shows a trend of buying before the halving, creating an opportunity for returns in the coming months. However, investors should consider de-risking around mid-June as the "sell the news" trend typically starts 1-2 months before the halving. While Litecoin may present a trade opportunity, it is not part of our Core Strategy.
- Core Strategy: We maintain the asymmetry from here remains to the upside in 1H and that this dip is worth buying. The lack of retreat in crypto prices relative to the increase in yields over the past few weeks is quite impressive. We think this is a function of investor composition, improving global liquidity conditions, and a market for risk assets that have already experienced the worst of the ongoing tightening cycle.
Another Rinse
Last week, we talked about the futures market getting ahead of its skis, trading with increased leverage despite a continued lack of follow-through in spot market demand. Well, rates and the dollar have remained stubbornly high on the back of continued hawkish rhetoric from central bankers, and as we will discuss below, global liquidity has pulled back in recent weeks.
Thus, bulls received another blow on Thursday evening when, in the span of an hour, the crypto market experienced a good old-fashioned liquidation cascade.
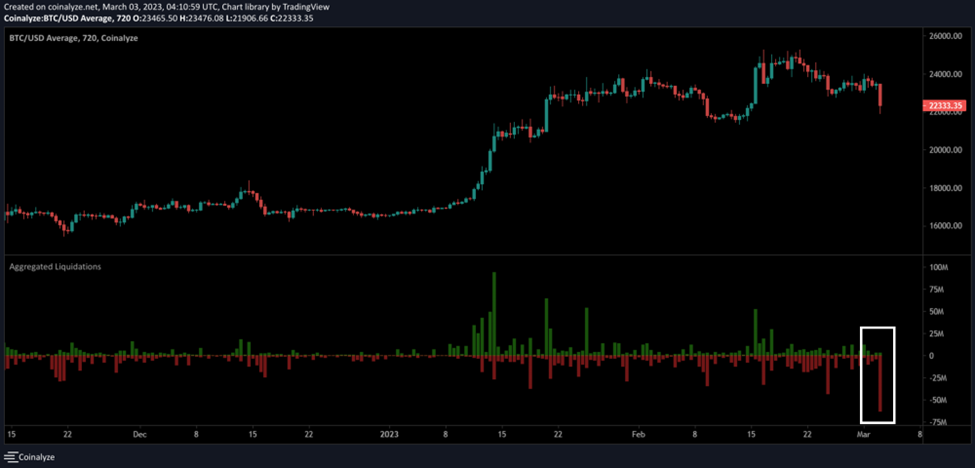
Total liquidations would amount to nearly $200 million in the span of an hour. The effect on spot market prices was exacerbated by the low liquidity environment that we are in and will likely remain in for the near future.
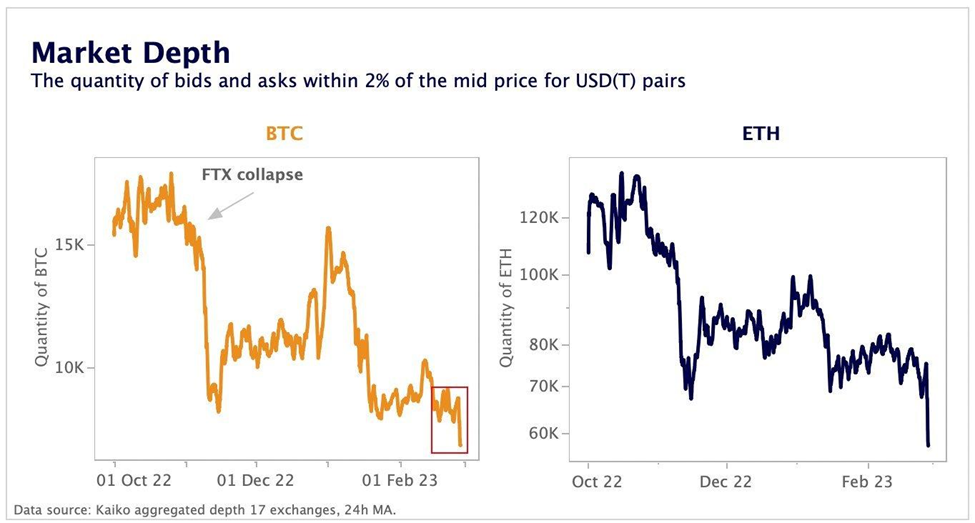
Below we can see the current market depth – exchange liquidity is anemic. This is important to keep in mind moving forward. Illiquidity is conducive to large candles in both directions.
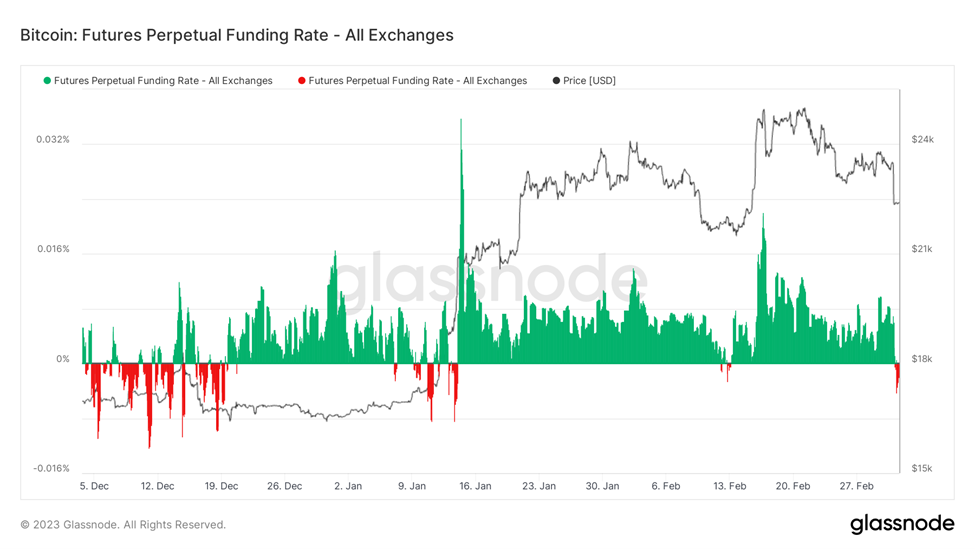
While open interest remains elevated compared to the total crypto market cap, the good news is that futures traders may be starting to take their feet off the gas, evidenced by falling funding rates on perps.
Market Liquidity Update
Shifting from micro liquidity dynamics to macro-ones, a key theme we have been covering is the trough in YoY global liquidity. Late last year and into this one, domestic liquidity has flattened – bond volatility started to decline, which has a strong inverse relationship with the amount of capital tied up in the RRP. Further, the US Treasury can no longer finance its expenses via the issuance of new debt and thus removes another asset that private market cash must be allocated to. Liquidity reserved for the private sector has effectively been flat.
Then we had Asian central banks start to revisit their respective monetary policies and begin easing in the face of slowing economic growth. The overall change in global liquidity profile is a big reason we think that crypto has outperformed regional equities since it is a better “pure” proxy for liquidity conditions.
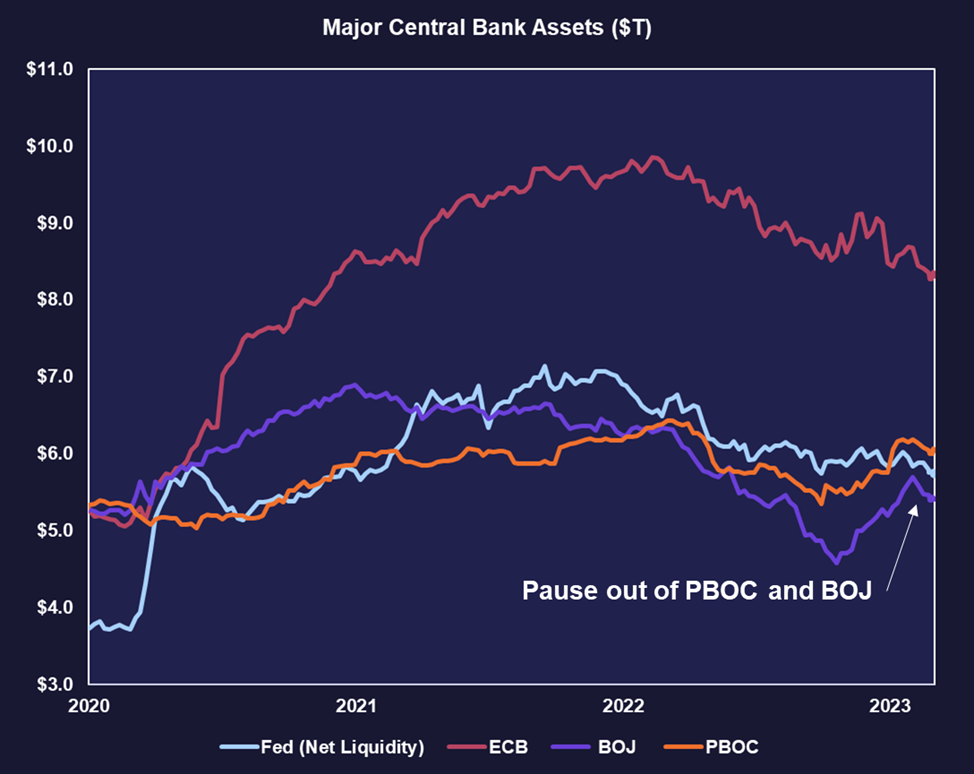
It should be to no one’s surprise that over the past couple of weeks, we have experienced a slight pullback in market liquidity on the back of a stronger dollar and a pause in capital injections from the PBOC and BOJ.
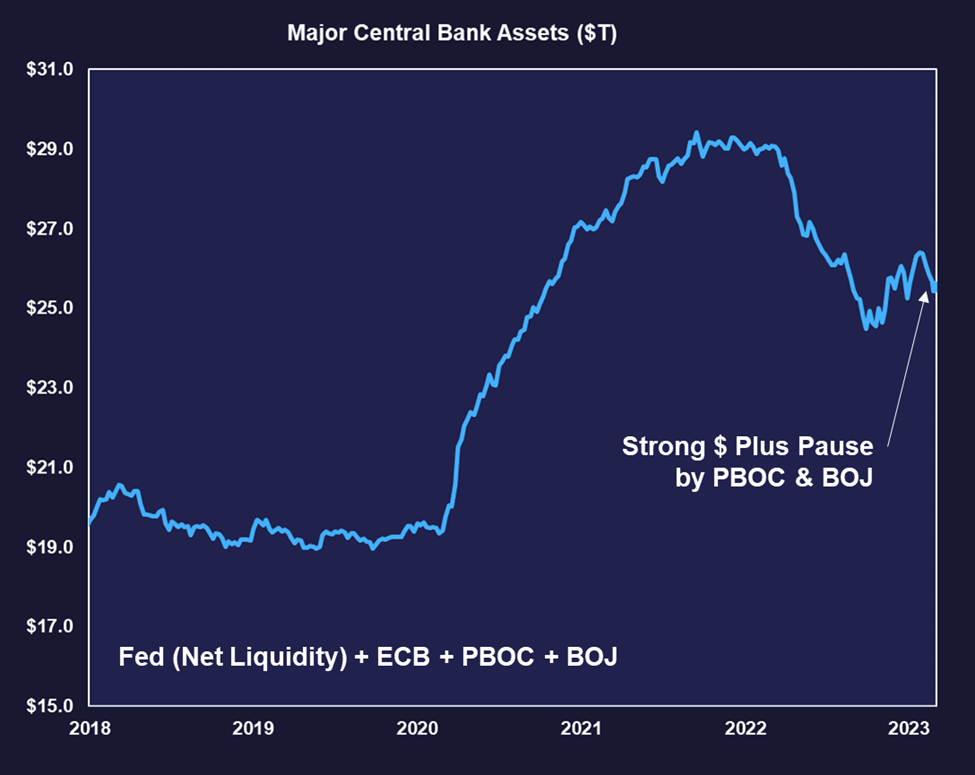
Below is the chart above broken down into respective components. Note that we are applying net liquidity in lieu of total Fed assets.
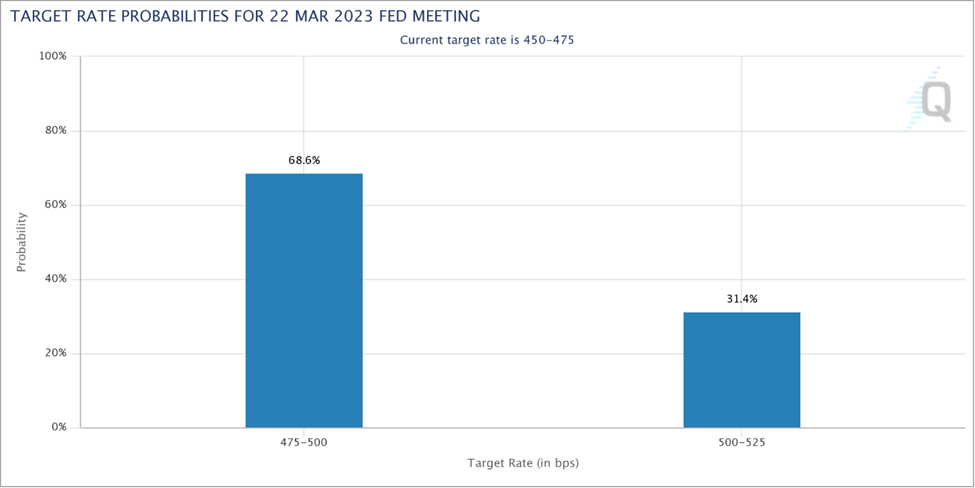
Further, as discussed last week, the dollar strength and move higher in yields has been caused by a reactive, violent repricing of rates. Despite there being no indication that the Fed will deviate from its plan, the market has taken 1 month of hot data and increased the probability of a 50-bps rate hike from 0% to 31% over the past month.
It is important to remember that the Fed responded to disinflationary data last meeting by reducing the Fed Funds rate increment from 50 bps to 25 bps, and signaled that additional 25 bps hikes would be necessary. For an organization that is working to reestablish some semblance of credibility, it would be awfully disconcerting if they amended their views based on one month of hotter-than-expected data.
The good news, as we have also repeatedly discussed, is the relatively robust performance of crypto compared to equities (due to liquidity conditions alluded to above). We maintain that crypto’s relatively strong performance in the face of rising rates and the strengthening USD should be encouraging for crypto investors.
Rates Rolling Over Could Lead to Increased Net Liquidity
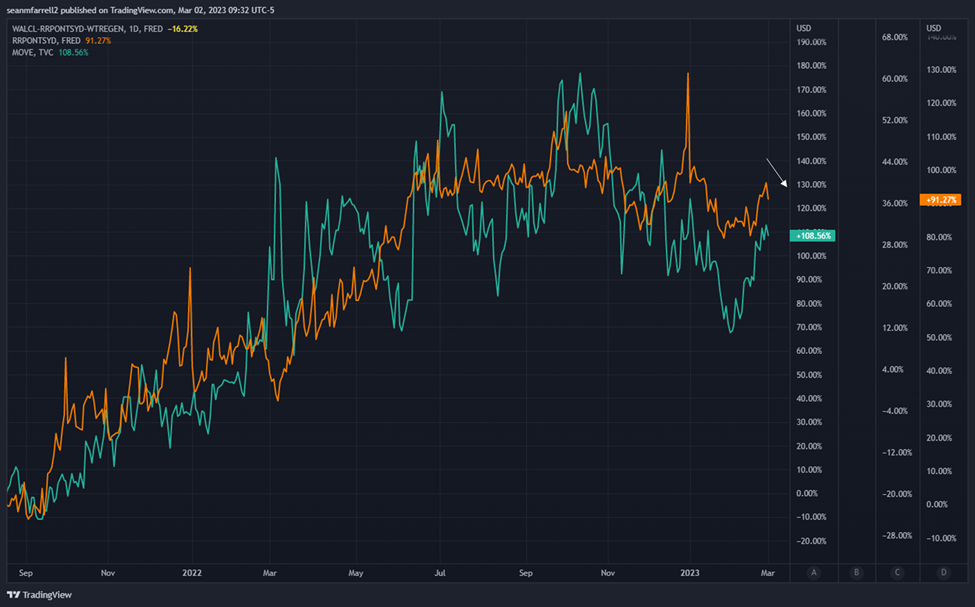
Below is the RRP balance plotted alongside the MOVE index. The MOVE index, also known as the Merrill Lynch Option Volatility Estimate, is a measure of the implied volatility of US Treasury bond options. The index is calculated based on the prices of options on 2-year, 5-year, 10-year, and 30-year Treasury bonds.
Implied volatility is a measure of the market’s expectation for how much the price of an underlying asset, in this case, US Treasury bonds, will fluctuate in the future. High implied volatility indicates that the market expects bond prices to be more volatile, while low implied volatility indicates that the market expects bond prices to be less volatile.
The MOVE index is used by traders and investors to monitor and manage the risk of their bond portfolios, as well as to gain insights into the market’s expectations for future bond price movements. High levels of the MOVE index can indicate that the bond market is experiencing heightened uncertainty or risk, while low levels of the index can indicate that the market is relatively stable.
Knowing this, it makes sense that capital would be drawn from the RRP when the MOVE index rolls over. We think that as rates find a ceiling and bonds start to catch a bid, we could start to see bond volatility start to inch lower again, possibly leading to a more favorable liquidity situation in the US.
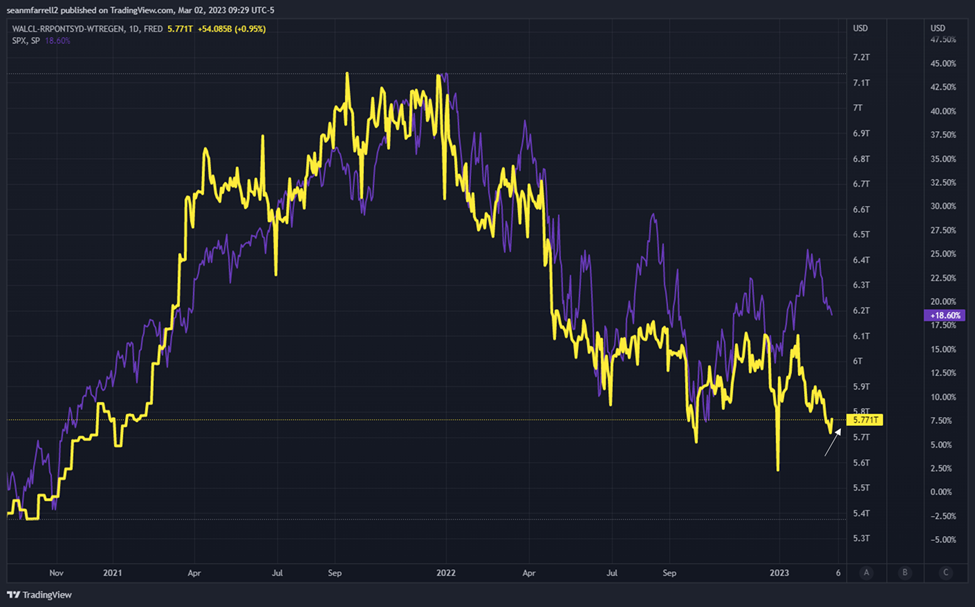
A draining of the RRP would lead to an increase in net liquidity, which, as demonstrated below, has acted as a reliable indicator for risk asset performance over the past several years.
Shanghai Timeline Formalized
Ethereum developers have agreed to run the Goerli test network through the Shanghai upgrade on March 14th, intending to enable staked ether withdrawals on the mainchain by the second week in April. This is the last chance for staking providers to ensure that staked ETH is withdrawable before Shanghai reaches the mainnet. After the Goerli test, the developers will set an exact date for the mainnet upgrade. This timing is a slight delay from the original outlook at the start of the year, but is generally in line with market expectations.
As we have discussed before, we believe that Shanghai will be less of a supply overhang on the market than many believe it might be. There are three main reasons:
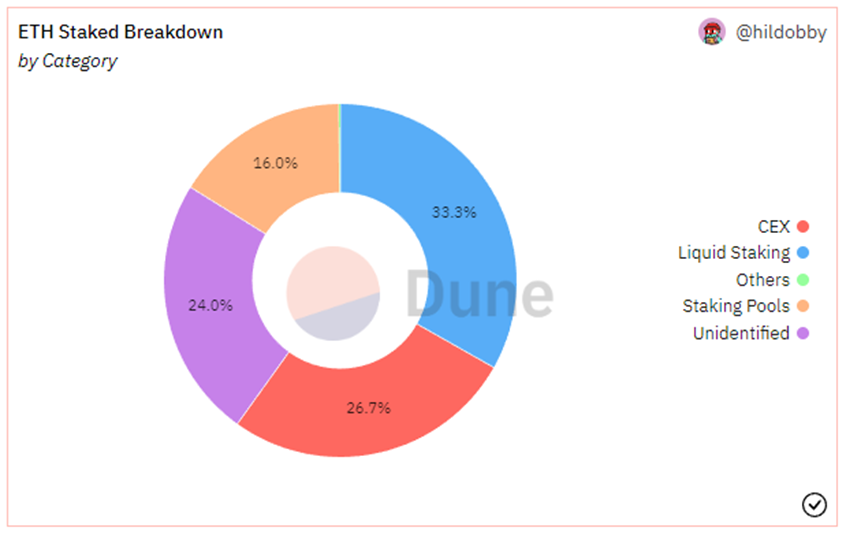
- Most stakers have had access to liquidity. Over half of the ETH supply staked is done through a liquid staking provider or CEX, meaning that if an entity wanted to achieve liquidity, it could have done so already.
2. There is a waiting line. After the Shanghai upgrade, the maximum number of validators that can exit the Ethereum Beacon Chain in each epoch (32 blocks, ~6.4 minutes) will be limited to 8 due to the current active validator count of 548,478. This limit increases by 1 every time the active validator count increases by 65,536. Validators who want to withdraw their staked ETH can do so through partial withdrawals or full withdrawals. Partial withdrawals can bypass the exit queue and proceed directly to the withdrawal queue, while full withdrawals must go through the exit queue first. The withdrawal queue processes both types of withdrawals, and during each block, 16 partial withdrawals will be processed. The actual withdrawal period is based on the churn limit, which rounds down with respect to the total number of validators, resulting in a minimum and maximum value based on the percentage of validators exiting. After successfully going through the exit queue, validators must wait a predefined withdrawal period before receiving their ETH, which is 256 epochs (approximately 27 hours) for non-slashed validators and 8,192 epochs (approximately 36 days) for slashed validators (Helpful Resources: WestieCapital, Understanding the Exit Queue on Ethereum’s Shanghai Upgrade).
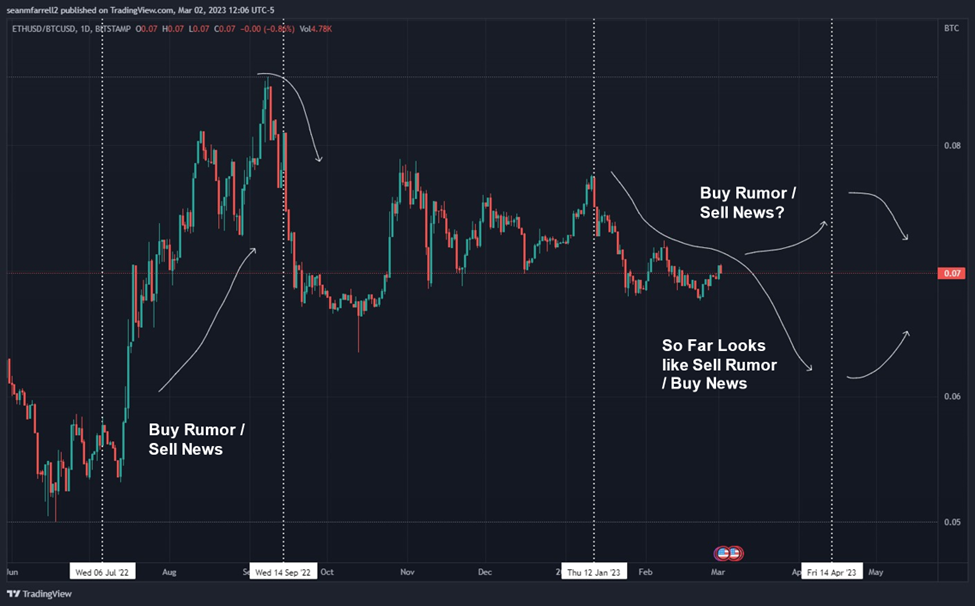
3. Thus far, the market has de-risked. Based on the ETH/BTC ratio this year, which helps normalize ETH performance irrespective of the macro backdrop, it would appear that many holders have de-risked ahead of the event. Of course, for those concerned with managing immediate-term risk around the event, it will be important to monitor price action leading up to the upgrade. There is certainly a world where the prevailing narrative shifts from thinking that ETH will sell off post Shanghai to one that rallies into the event. If the market begins pricing in a lower level of supply of ETH on the open market due to increased staking, price could rally into the upgrade and experience a brief profit taking sell-off around the actual upgrade. We would adjust our risk appetite appropriately should this begin to play out.
Trade Idea: Litecoin Halving
We are all quite familiar with Bitcoin’s halving. The Bitcoin halving is a scheduled event that takes place every 210,000 blocks mined on the Bitcoin network, which occurs approximately every four years. Following the halving event, the reward that miners receive for mining a new block on the Bitcoin network is cut in half, meaning they receive half of the number of bitcoins they previously received for mining a block. The purpose of the halving is to slow the rate of new Bitcoin production, ultimately leading to a total supply cap of 21 million. Due to the rules of supply and demand, a steady growth rate in demand naturally leads to an increase in BTC price around the halving event as the growth in supply is constrained. Thus, bitcoin’s historical price cycles have centered around these halving events. Of course, some price appreciation is organic, and some of it is narrative, but the returns are 100% real.
Well, bitcoin isn’t the only large-cap digital asset that undergoes a halving event. Like Bitcoin, Litecoin (LTC) also undergoes a halving event approximately every four years or after every 840,000 blocks have been mined.
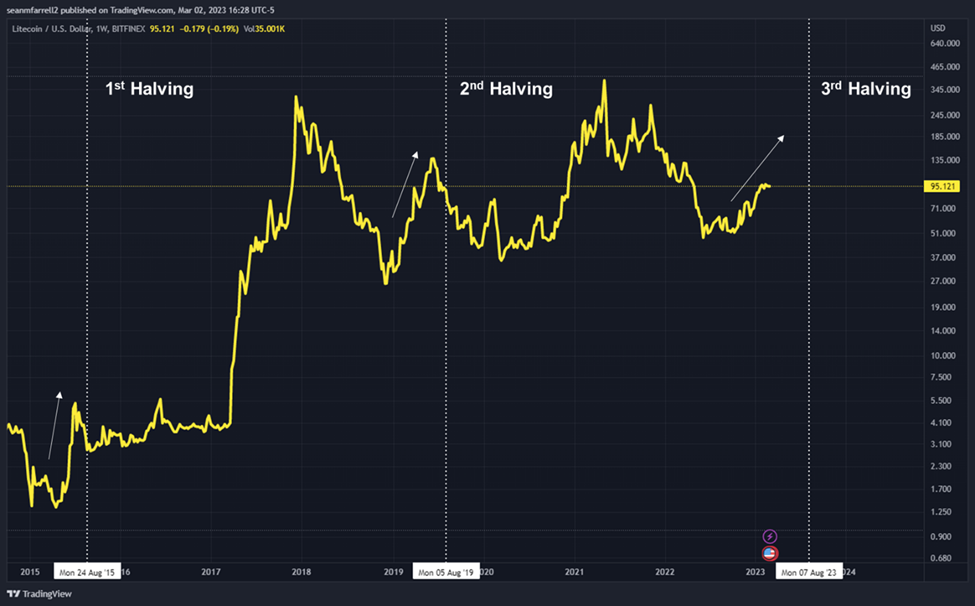
During the first Litecoin halving in August 2015, the block reward was reduced from 50 LTC to 25 LTC. Similarly, during the second halving event in August 2019, the block reward was reduced from 25 LTC to 12.5 LTC. The next halving is scheduled for August of this year.
And as one might expect, the performance of LTC leading up to its historical halvings has been quite impressive. However, contrary to bitcoin’s continued positive price performance post-halving, the chart below demonstrates a clear “buy-the-rumor / sell-the-news” dynamic for the previous two events.
We are approximately 150 days out from the reduction in block subsidy. Below we compiled the historical returns from an array of dates leading up to the event itself (t = halving date).
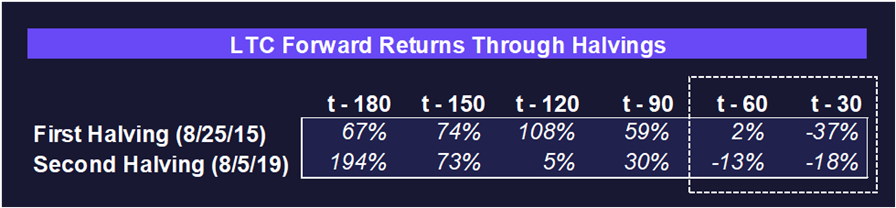
As both the chart and the table above suggest, now is the time to take advantage of this potential catalyst. Obviously, a sample size of two certainly reduces the level of certainty in this trade, but we think there is ample opportunity for returns over the next few months in LTC.
It is also worth highlighting that the “sell the news” portion of this trend has historically taken place starting 1-2 months prior to the halving. Thus, those putting on this trade will likely want to look to de-risk around the mid-June timeframe.
Note: Some reading this will wonder why LTC wouldn’t be included in our Core Strategy. In short, there are trades, and there are allocation strategies. The former is more ephemeral and requires more precision around entry and exit points. Further, as is the case with Litecoin, the names we include in our Core Strategy will usually have a long-term investment thesis that we think is worth paying attention to. It is our opinion that Litecoin will certainly stick around but is by no means destined to be the future of money or payments. After all, it wasn’t too long ago that the founder of Litecoin sold his bag on his acolytes at the top of a roaring bull market.
Core Strategy
We maintain the asymmetry from here remains to the upside in 1H and that this dip is worth buying. The lack of retreat in crypto prices relative to the increase in yields over the past few weeks is quite impressive. We think this is a function of investor composition, improving global liquidity conditions, and a market for risk assets that have already experienced the worst of the ongoing tightening cycle.
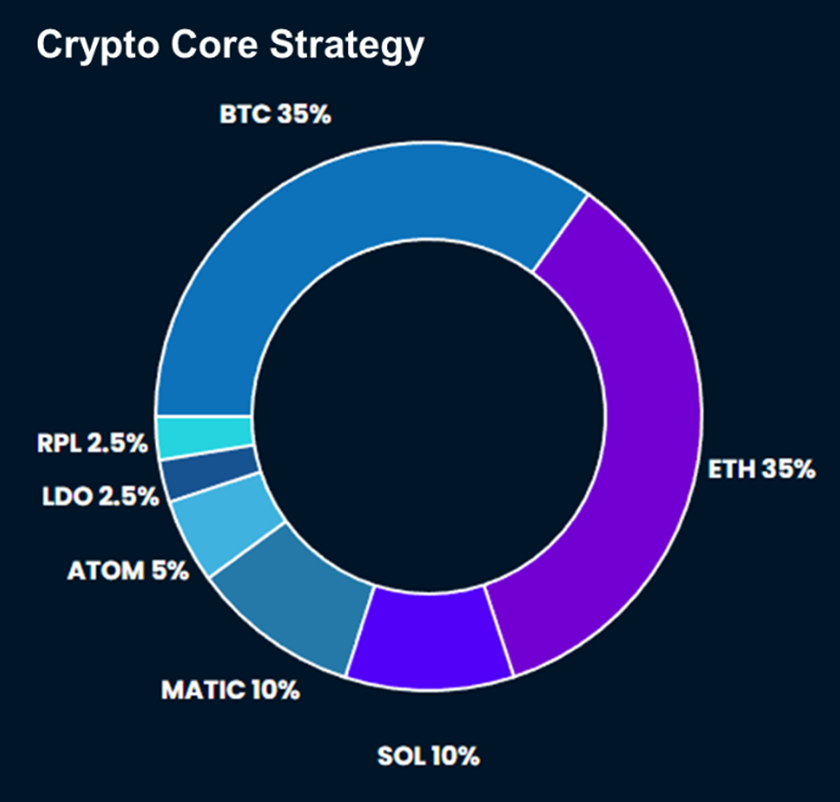
Tickers mentioned in this report: $BTC, $ETH, $ETHBTC, $SOL, $ATOM, $MATIC, $LDO, $RPL, $LTC
Reports you may have missed

INFLOWS RESUME On Monday, market sentiments were rattled by a surprisingly strong manufacturing PMI figure, marking the first expansionary reading in 18 months. This led to a rise in rates, with risk assets across the board experiencing selloffs amid renewed inflation concerns and fears that the Federal Reserve might need to implement further measures to cool the economy. However, in our crypto comments video on Tuesday, we outlined a couple...
Adding RON and IMX As a Different Flavor of ETH-beta and Gaming Exposure (Core Strategy Rebalance)
MARKET SHRUGS AT HOT CPI The latest Consumer Price Index (CPI) data indicated a hotter inflationary environment than forecasted for February. Despite the surprise in the numbers, market participants appeared largely unmoved, suggesting that the potential impact had already been factored into their calculations prior to the release. This resilience reflects a broader sentiment that a rates-driven selloff, in response to the CPI figures, is not a significant near-term risk....

RESEND: Bitcoin ETF Equilibrium Price Dynamics: ETF likely to drive significant rise in daily demand
BY POPULAR DEMAND, WE ARE RE-SENDING THIS BITCOIN PRICE IMPACT OF SPOT ETF REPORT FROM JULY 24, 2023 The Bitcoin spot ETF was finally approved. And we are seeing the surge in price of Bitcoin because of attractive supply and demand dynamics.We received multiple requests to resend this report from July 24, 2023 which looked at supply and demand dynamics if a spot ETF was approved.In short, we believe a...

FLOWS BEGET MORE FLOWS We have recently discussed the potential return of crypto being correlated with equities due to the new category of market participants entering the fold. However, price action this week suggests that inflows into the BTC ETFs may be throwing water onto that theory. It seems apparent that, at least in the near-term, that the ETF flows narrative is gaining steam, and it is likely that the...

