


Welcome to “Uptober”
Key Takeaways
- A FUD-free week combined with shifting regulatory sentiment catalyzes a 33% weekly increase for $BTC and a 28% increase for $ETH. Bitcoin’s market cap returns to $1 trillion and trades above the 200-day moving average.
- Data points to a spot-driven market for Bitcoin as just over $100 million in short positions were liquidated on Wednesday’s move and leverage remains relatively subdued despite the bullish price action.
- $BTC transfer volume data demonstrating a higher percentage of transactions above $10 million in aggregate value suggests increased participation from institutional players.
- Bitcoin dominance appears to be gaining steam as the leading cryptoasset diverges from the altcoin market. This potentially indicates the start of wider rotation out of altcoins and into Bitcoin.
- On-chain supply dynamics may finally be bearing fruit as the current illiquid supply levels may have led to outsized impact from today’s spot demand.
- Bottom Line: Bitcoin and Ethereum’s performance in the face of a seemingly murky macro landscape is a positive sign for investors. We continue to view the remainder of Q4 as bullish for $BTC and $ETH and will continue to approach any near-term pullbacks as opportunities to add to our positions.
What a difference a week makes
This time last week, we were still licking our wounds from yet another bout of crypto FUD courtesy of Beijing. Chinese authorities laid out their intentions to “ban” crypto for the 6th or 7th time, sending $BTC on a downward spiral until finding support around $40,000 and beginning a gradual ascent higher.
Although $BTC was trading well below the 200-day moving average (a pivotal trading level that generally precedes strong forward performance), we noted to clients our steadfast view that any near-term selling was an opportunity to increase one’s position. Fast forward to today, and Bitcoin is testing the $55,000 level for the first time since early May, having registered a 33% gain since last Wednesday. The leading cryptoasset once again eclipsed $1 trillion in market cap this morning and now trades comfortably above the 200-day. We note that Ethereum has moved higher as well, albeit at a slower pace, trading around $3,600 at the time of writing, the result of a similarly impressive 28% weekly increase.
Sentiment Swings
This move for $BTC was catalyzed by an overwhelming change in market sentiment coupled with healthy underlying fundamentals that we have discussed ad nauseam in our letters to clients over the past few months and will further discuss in sections below.
This week marked a much-needed respite from negative headlines that have plagued Bitcoin for the better part of this year. The government’s fiscal year ended last week, and many traders were reluctant to enter long positions in anticipation of impending regulatory measures from authorities. There were minor instances of regulatory actions, such as Kraken’s relatively innocuous $1.25 million fine from the CFTC, but overall, the regulatory overseers did not drop any significant hammers on crypto.
On another positive note, we received a relatively positive statement from SEC Chairman Gary Gensler claiming that he has no interest in banning crypto (although he did leave the door open for regulation from Congress).
We even had a member of Congress introduce what we would consider as “pro-crypto” legislation. On Tuesday, Rep. Patrick McHenry, the top Republican on the House Financial Services Committee, introduced the Clarity for Digital Tokens Act of 2021. The bill would amend the Securities Act of 1933 to provide token issuers a 3-year safe harbor to prove decentralization before registering their tokens as securities. This bill mirrors a proposal set forth by SEC Commissioner Hester Pierce, who has long advocated for a similar Safe Harbor. This would strike a palatable balance between regulation and an ability to innovate.

Market Update
On Wednesday morning, North American markets opened to an hourly green candle on the $BTC chart that brought us from around $51,000 to $55,000 per $BTC.
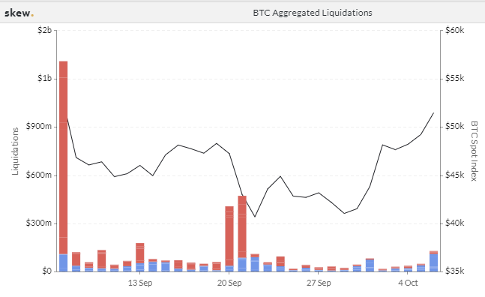
The chart below displays daily liquidations over the prior month. Based on this data, approximately $100 million of short positions were liquidated this morning. While this is constructive of $BTC price, $100 million is a relatively tame figure compared to the long liquidations of nearly $1 billion just a few short weeks ago. This chart indicates to us that this morning’s price action was not driven by a mispositioned market, but rather an increase in spot demand combined with favorable supply conditions, which we will elaborate on below.
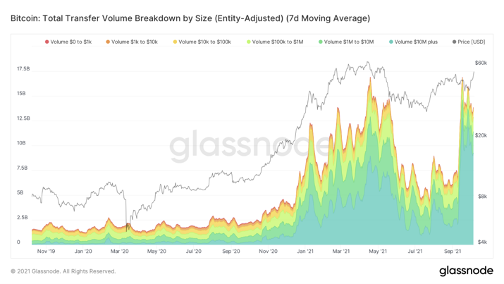
An increase in spot demand would also be consistent with recent data indicating that institutions are starting to enter the $BTC market at a higher rate. Below is a chart that breaks down the 7-day moving average of $BTC transfer volume placed into several buckets categorized by relative transaction size. There has been a recent uptick in transaction volume largely comprised of transactions sized over $10 million. This trend began a couple of weeks ago and has continued through today. We note that during its prior run to an all-time high, $BTC benefitted from a similar increase in larger-sized transactions, likely from institutional allocations and deep-pocketed traders entering long positions.
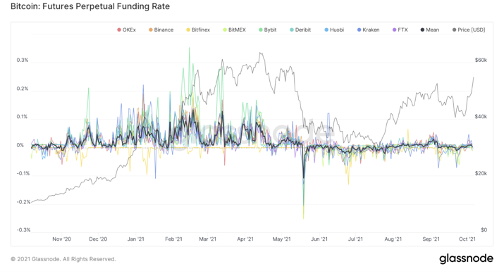
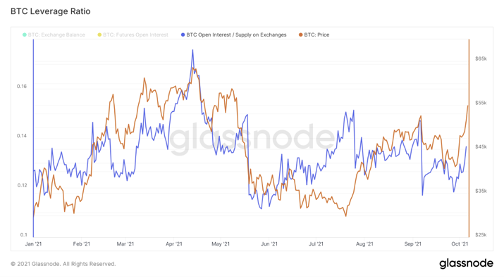
Further supporting the institutional spot-buying thesis are the charts below, speaking to the current leverage profile of the market.
Futures perpetual funding rates are net positive, but as compared to the euphoric levels experienced in early 2021, they might as well be negative.
Below is the $BTC leverage ratio that we often use to gauge how “overheated” the market is. As a reminder, this is a ratio of $BTC open interest over the total supply on centralized exchanges. The ratio has inched higher this afternoon, but still sits well below the YTD high, and matches the leverage ratio maintained prior to Bitcoin’s bullish run this past winter. We do note that the trajectory of today’s increase in leverage was rather sharp, so this is something we will keep an eye on over the next few days.
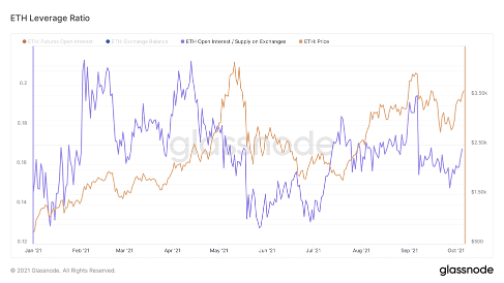
$ETH leverage appears to remain relatively low as well. This makes sense given that bitcoin is currently leading the charge.
The Return of the King
One metric that we have not discussed extensively, but is useful in assessing capital rotations within crypto is “Bitcoin Dominance”, or the $BTC market cap as a percent of the total crypto market cap.
In recent months, we have witnessed the emergence of play-to-earn tokens, metaverse tokens, and several layer 1 platforms that outperformed bitcoin from a price perspective. We have also witnessed $ETH pull away from its highly correlated counterpart as it has benefitted from the growth of NFTs and a disinflationary supply schedule brought on by a recent software upgrade. Given these recent dynamics $BTC dominance has wavered since its run to $64,000 last April and has yet to fully recover.
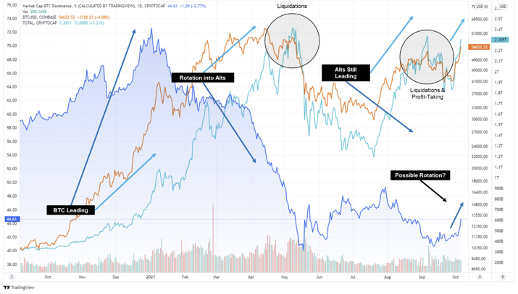
We sense that this trend is reversing due to the increased appetite for $BTC from institutions and the sentiment changes noted above. Below, we do our best to demonstrate how $BTC dominance has changed over the past 12 months and how we see a potential rotation starting to take place.
In the chart below, the orange line is $BTC price, the light blue line is total crypto market cap, and the dark blue line is $BTC dominance. We can see that $BTC dominance starts around 55%, increases to 72% at the beginning of 2021 and subsequently starts to decrease BEFORE the industry drawdowns in April and May. This is indicative of gains from $BTC rotating into other “altcoins.” We can observe that this dominance level remains depleted even after the market starts to recover, demonstrating the continued success of altcoins.
Starting this week, we have finally seen bitcoin come to life, as dominance has increased nearly 3% from Sunday evening on the back of bullish $BTC price action combined with a stagnant altcoin market. We think that further capital inflows from institutions (as discussed above) may cause further rotation from other crypto native investors into $BTC as we progress into Q4.
ETF Update
Last week we pointed out the increasingly positive sentiment surrounding the possibility of a futures-based Bitcoin ETF. Through industry conversations this excitement has reached a fever pitch as many believe that if it does not happen in Q4, we may be waiting an awfully long time for a $BTC ETF.
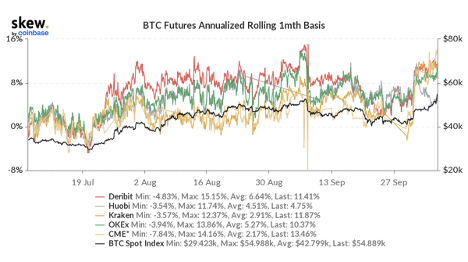
Below is a chart that got us excited on Wednesday morning. It is the annualized rolling 1 month basis for $BTC futures. It may be difficult to tell by the lines themselves, but this chart indicates a basis on CME futures that is considerably higher than the basis on other exchanges.
Many were speculating that this was a sign that an ETF approval was imminent. We think that this may be a combination of improved ETF sentiment coupled with increased institutional participation as CME is a popular destination for the traditional (non-crypto-native) investor crowd.
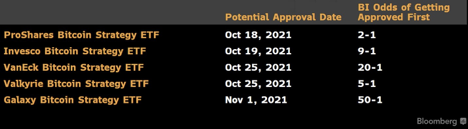
We noted this in our letter last week and maintain a position that investors should be optimistic about a Q4 approval of a Bitcoin ETF. If this does transpire, we think this would be beneficial for $BTC price regardless of the demand for the actual product.
Below is a list of a few ETFs that are up for approval over the next few weeks.
On-Chain Update – Fundamentals Back in Vogue
Over the recent period of weak price action – driven by futures liquidations and China FUD – we’ve paid close attention to on-chain metrics which have helped separate noise from digital asset fundamentals. With Bitcoin testing $55,000 at the time of writing, many of the strong fundamental trends we’ve identified – HODLer accumulation, increasing illiquid supply, decreasing exchange balances, among others – are manifesting in price.
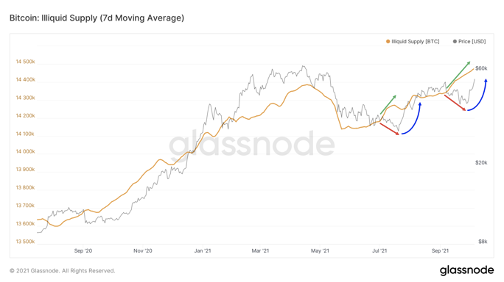
One of the clearest examples of this is through the analysis of Bitcoin’s illiquid supply – which refers to the supply of tokens that are held by long-term investors and unlikely to be spent. Last week, we identified that illiquid supply has diverged from price:
Most recently, since the liquidation cascade on 9/7 and rehashed China FUD on 9/24 drove prices lower, illiquid supply has diverged to the upside. A similar bullish divergence can be observed in early July, as well.
This week price has corrected to the upside, now tracking back towards illiquid supply in similar fashion to early July.
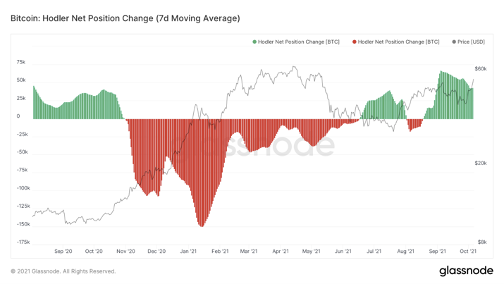
Supporting the continued increase in illiquid supply are HODLers who tend to accumulate when prices are depressed despite positive fundamentals while selling into speculative price run-ups. Notably, HODLers have been accumulating more coins over the trailing 30-day period (approximately 43k bitcoins) than they were in July when it was trading at $30k (approximately 28k bitcoins).
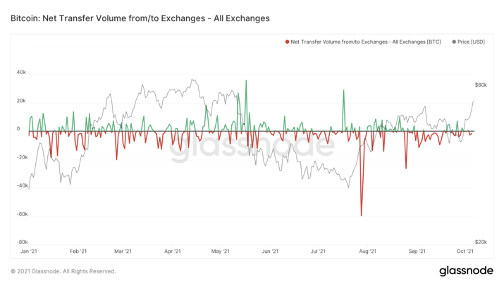
We also note that despite the positive price action, net transfer volume from/to exchanges is still in the negative territory. During times of froth, we normally see coins start to migrate back onto exchanges to be sold. We recently witnessed a small uptick in exchange volume due to migration of Chinese coins onto exchanges, but that dynamic was short-lived.
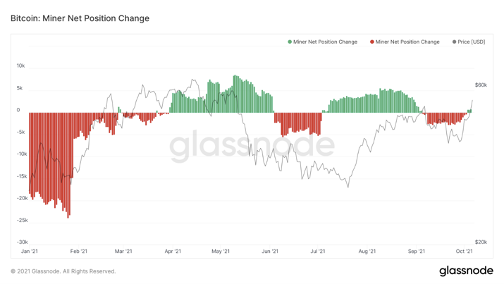
Below is new chart that provides us with insight into both miner profitability and market sentiment. Although they are the backbone of an emerging technology, miners are industrial companies that require capital investment and expenses to operate. In order to pay for said expenses, miners must convert a portion of the $BTC that they mine into fiat currency so that they are able to pay whichever account they owe. Therefore, we can infer that miners are much more likely to sell when (1) their margins are being squeezed and they need capital, (2) they anticipate price decreases, or (3) a combination of both. As demonstrated by the chart below, miners had been net sellers over the rolling 30-day periods ending throughout the month of September. However, just this week, as price started to recover, miners have become net-HODLers of $BTC.
The Bottom Line
As sentiment shifts and bullish on-chain patterns start to bear fruit, we will start to observe the buying appetite at these higher levels.
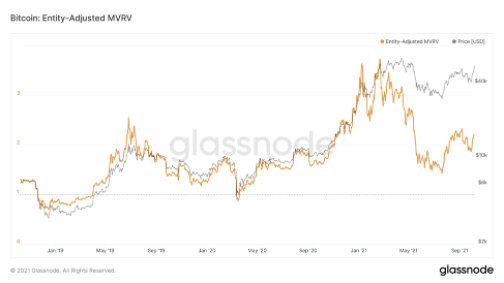
Below is a chart demonstrating Bitcoin’s Market-Value-to-Realized-Value (MVRV) ratio with $BTC price as a backdrop. As a reminder realized value, or realized cap, simply measures the value of the network based on the price at which each $BTC was last transacted. This metric can more simply be thought of at the network’s cost basis. MVRV is the Bitcoin market cap over the total realized cap of $BTC. As MVRV increases, coins in profit are more likely to sell.
The chart below clearly indicates that, although we have increased in market cap by approximately 30% over a 7-day period, there are many coins just starting to come into profit, and therefore we may need to see further price appreciation before we see any substantial levels of selling pressure. This is one metric that we will continue to observe going forward.
An enormously positive sign for $BTC and $ETH is that they are both performing well in the face of a seemingly murky macro landscape. While we still anticipate a rally in traditional equities through year-end, recent price action suggests that it may not be completely necessary for us to see $100k and $10k for $BTC and $ETH, respectively. With that in mind we continue to view the remainder of Q4 as bullish for $BTC and $ETH and will continue to view any near-term pullbacks as opportunities to add to our positions.
Reports you may have missed

INFLOWS RESUME On Monday, market sentiments were rattled by a surprisingly strong manufacturing PMI figure, marking the first expansionary reading in 18 months. This led to a rise in rates, with risk assets across the board experiencing selloffs amid renewed inflation concerns and fears that the Federal Reserve might need to implement further measures to cool the economy. However, in our crypto comments video on Tuesday, we outlined a couple...

Adding RON and IMX As a Different Flavor of ETH-beta and Gaming Exposure (Core Strategy Rebalance)
MARKET SHRUGS AT HOT CPI The latest Consumer Price Index (CPI) data indicated a hotter inflationary environment than forecasted for February. Despite the surprise in the numbers, market participants appeared largely unmoved, suggesting that the potential impact had already been factored into their calculations prior to the release. This resilience reflects a broader sentiment that a rates-driven selloff, in response to the CPI figures, is not a significant near-term risk....

RESEND: Bitcoin ETF Equilibrium Price Dynamics: ETF likely to drive significant rise in daily demand
BY POPULAR DEMAND, WE ARE RE-SENDING THIS BITCOIN PRICE IMPACT OF SPOT ETF REPORT FROM JULY 24, 2023 The Bitcoin spot ETF was finally approved. And we are seeing the surge in price of Bitcoin because of attractive supply and demand dynamics.We received multiple requests to resend this report from July 24, 2023 which looked at supply and demand dynamics if a spot ETF was approved.In short, we believe a...

FLOWS BEGET MORE FLOWS We have recently discussed the potential return of crypto being correlated with equities due to the new category of market participants entering the fold. However, price action this week suggests that inflows into the BTC ETFs may be throwing water onto that theory. It seems apparent that, at least in the near-term, that the ETF flows narrative is gaining steam, and it is likely that the...

