


FDV No Longer A Meme

Key Takeaways
- Similar to equities, crypto market caps are calculated by multiplying the circulating supply by the current market price. However, many dynamics exist exclusively in crypto that may skew this metric when used. Digital assets have ongoing inflationary dynamics that increase their circulating supply. Digital asset investors should consider how vesting timelines and allocations will impact a protocol's emissions schedule as it can negatively affect price action at key unlocking milestones, as we see below.
- The entrance of VCs in the space has carved out token allocations for themselves, seemingly default terms in equity deals. This leaves a smaller proportion of freely tradable tokens at launch, making price easily manipulatable.
- We examine the differences between Ethereum and Aptos' launch to illustrate this difference. Ethereum had what most consider one of the fairest launches in the space, while newly launched Layer 1 Aptos had launched with 2% of tokens out of total supply.
- VCs recognize this skewed dynamic and launch low float, high FDV coins to achieve significantly shorter payback periods relative to traditional VC. As if this doesn't misalign incentives enough between projects and financiers, SBF borrowed against these illiquid tokens from centralized lenders.
- It is reasonable to project that token unlock events moving forward will put downward pressure on price. To illustrate our point, we examine token unlocks for insiders (team, advisor, and private sale) charted against price for AXS.
- To gauge tokens with the highest upcoming selling pressure, we utilize Market Cap / FDV, Token Unlocks / Circulating Supply, and Daily Linear Unlocks / 24H Volume. While these metrics do not account for fundamentals, we believe sidelined buying pressure will be insufficient to absorb crypto-nuanced emissions.
Figure: Pepe Simpson Reminding Himself That FDV Is No Longer a Meme

In light of recent events, it’s safe to assume that crypto winter has come to an end and that we have officially entered crypto’s ice age. SBF et al not only defrauded investors of Alameda Research and customers of FTX, their actions also destroyed ~600m in TVL from the Solana ecosystem.
Figure: Solana Projects by TVL
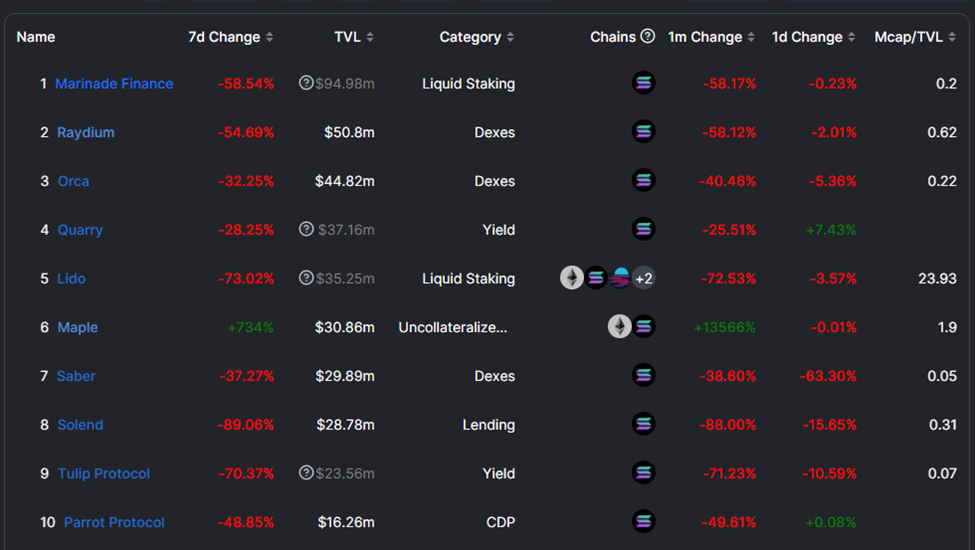
Wrapped assets lost their peg because the collateral was held by the intertwined firms. soBTC lost 95% of value since FTX held the underlying bitcoin and was the only place traders could redeem the sollet-wrapped derivatives for their underlying assets. Projects that held their treasuries on FTX or accepted market-making deals by Alameda lost their whole budgets.
If ‘bullish unlocks’ were a thing before, the latest fall of dominoes from the summer credit crunch has significantly decreased the chance of such a reoccurrence. Put simply, we believe sidelined buying pressure in bear markets will be insufficient to absorb crypto-nuanced emissions parameterized during bull markets. We dive deep into some of the launch and supply dynamics that played into FTX’s downfall and attempt to gauge which other protocols face inflationary headwinds moving forward.
Circulating Market Cap vs. Fully Diluted Market Cap
One of the most common metrics investors use to value protocols is its market cap[1]. Similar to equities, crypto market caps are calculated by multiplying the circulating supply[2] by the current market price.
Market Cap = Circulating Supply * Current Price
While doing the same calculation for equities using outstanding shares paints a holistic picture of the value ascribed to a specific business, many dynamics exist exclusively in crypto that may skew this metric when used.
When a company is publicly traded, the number of shares outstanding represents the majority of underlying claims to ownership of that company. When needed, the firm can fundraise from equity markets by performing an equity issuance, diluting existing shareholders. There are nuances with employee options that can dilute existing shareholders, but the ownership changes typically amount to rounding errors once these are accounted for. For crypto protocols, this dilution risk is far greater.
Digital assets have ongoing inflationary dynamics that increase their circulating supply. Detailed in whitepapers, tokens’ breakdown and distribution schedules constitute funds used to pay for operating expenses, incentivize liquidity, and reward early investors and users of a protocol. With time, the circulating supply of a token converges with its fully diluted supply[3] as more tokens are emitted (and are circulated) in the market.
Followingly, Fully Diluted Valuation (FDV) is calculated as all tokens that will ever exist for a protocol multiplied by the current market price.
Fully Diluted Valuation = Max Supply (or Total Supply if N/A) * Current Price
Depending on a team’s priorities and investors, projects usually have different allocations and vesting schedules for their tokens. Digital asset investors should consider how vesting timelines and allocations will impact a protocol’s emissions schedule as it can negatively affect price action at key unlocking milestones, as we see below.
Launch and Supply Dynamics
While public raises were a norm in the days of the ICO boom, the entrance of venture capitalists in the space carved out token allocations for themselves. Specifically, seed or early-stage venture capitalists typically provide funding in exchange for equity and a percentage of token supply. These terms quickly became the default and birthed two classes of the same token: unlocked tokens traded on the open markets and locked tokens that are subject to vesting timelines.
VC’s allocations left a smaller proportion of tokens to be freely tradeable at launch, the dynamics of which are even more perverse at the extremes. Low circulating supply means that whatever buying demand before launch had to be filled by thinly-traded markets, increasing the market price immediately post-launch. However, market price affects both market cap and fully diluted valuation. Should fully diluted (locked) supply be multiples that of circulating supply, FDV can get quickly inflated especially if prices can be easily manipulated upwards.
To illustrate the launch and supply dynamics described above, we dive into two starkly different protocols in terms of allocations and vesting: Ethereum and Aptos. Ethereum was one of the first ICOs (Initial Coin offerings) launched in 2014, while Aptos is a new L1 launched this year, each with starkly different tokenomics.
Ethereum
Widely regarded as one of the fairest launches in the space, Ethereum’s launch sold 83.3% of the initial supply to the public at an average price of $0.31 USD. The sale of 60m $ETH allowed the Ethereum Foundation to raise over 31,000 $BTC or $18.3m at the time, constituting its initial market cap. The remaining 12m ETH was allocated to the Ethereum Foundation and early Ethereum contributors, contributing 3.7m to its $22m FDV.
Figure: ETH Allocation
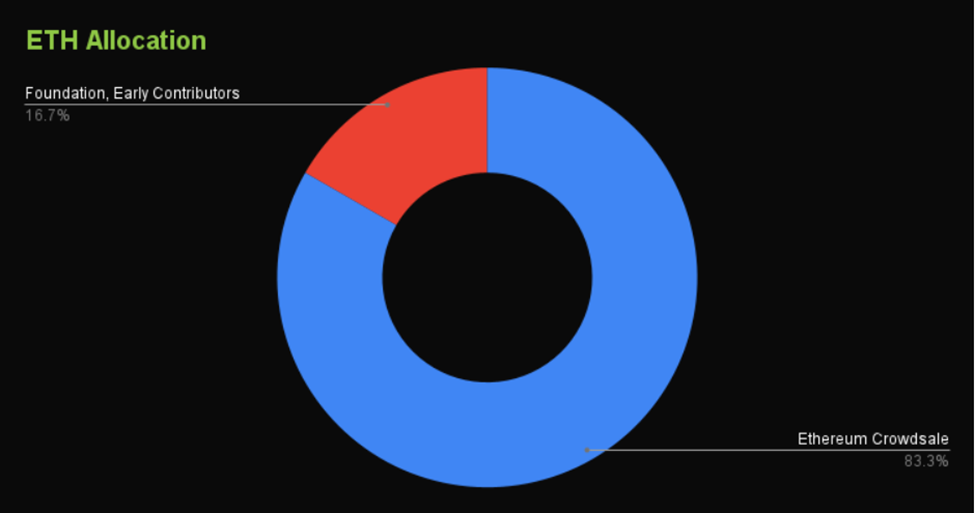
The fact that the majority of supply was circulating at launch allowed for organic price discovery. Apart from the 16.7% earmarked for insiders (EF and early contributors), the vast majority of ETH’s supply was traded publicly or predictably issued via its emissions schedule for proof of work rewards. Due to this dynamic, ETH’s circulating market cap at launch was a reliable indicator of the project’s true market valuation.
Without examining ETH’s emission schedule, it is clear from the allocations above that unlock risk from insider selling is minimal. While the ETH foundation could have theoretically sold their allocation as they pleased (no vesting schedule applied), they were incentivized to hold their tokens to provide grants to ecosystem contributors and initiatives. Even if they did, the sales would have been via TWAPs on the open market instead of around specific unlock events, minimizing price disruption.
Aptos
Having raised $350m at a valuation of over $3b earlier this year from institutional investors, Aptos instead has a significantly higher insider allocation relative to Ethereum.
Figure: APT Allocation
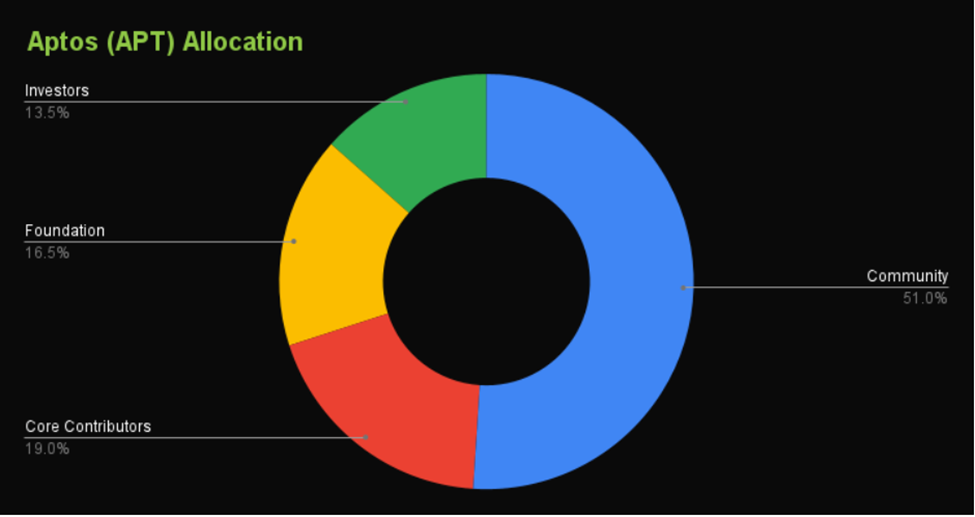
For starters, 13.5% of the Aptos supply is allocated towards investors (insiders), from which its aforementioned Series A investors receive a portion. 16.5% of supply is earmarked for the Aptos Foundation (insiders), while core contributors (insiders) are eligible for 19.0%. This leaves 51% of the token supply to community (outsiders), r..rr…rrright?
Whether intentional or not, this is a bit of a misnomer. While the community tokens are intended for grants to builders or liquidity incentives, they are still under the complete discretion of the Aptos Foundation and team.
Figure: Clarification on Community Tokens
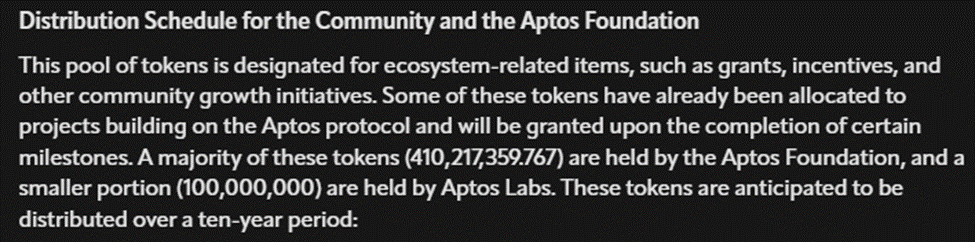
Although 51% of tokens are earmarked for Aptos’ ‘community,’ 98% (all but 2% airdropped) of APT supply is controlled by insiders, with 86.5% controlled by the Aptos team. To make things worse, the only way to participate in APT upside as a non-insider was to qualify for the 20m airdrop awarded to early testnet users or purchase one of the 110m remaining circulating tokens under ‘Community’ and Foundation.’ This implied that only 13% of Aptos was circulating at launch.
On its launch day, $APT proceeded to sell off ~45% from $13.73 to $7.78. Despite this massive drop, the token stood at a Market Cap of $1.1b and an FDV of $8.3b at the end of its first trading day. If an investor only used market cap to value Aptos (13% of supply, ~$1 billion market cap), Aptos would (arguably) seem fairly valued relative to other L1s. If the investor had used FDV instead, they would have come to a different conclusion.
Market capitalization is thus analogous to the market demand for a token. ‘Given a circulating supply of x, what is the price that can express (and support) existing market demand?’. On the other hand, FDV (or rather its discrepancy between market cap), is a measure of supply (and impending selling pressure) for a specific token.
If circulating supply and fully diluted supply were the starting point and destination, token emission and unlock schedule represent the speed and routes of the journey. Principally, investors need to ascertain the following: can market demand offset the supply of tokens coming onto the market when tokens are vested? But before we can comprehensively answer that question, it is important to understand participants’ incentives.
The VC Game
Recognizing this skewed dynamic from low-float tokens, the typical VC portco handbook would follow:
- Launch with a low amount of tokens in circulation relative to maximum supply
- List the tokens on an exchange, with perpetual futures to follow
- Let the demand for the token inflate price on low supply
- Short the token on perpetual futures
- Close both the long spot position and short perpetual futures on the unlock date
For the most predatory of ‘Sam’ deals, locked tokens are staked to earn staking rewards, which are unlocked and can be multiples of the initial investment. This led to significantly shorter payback periods relative to traditional VC and misaligned long-term incentives between projects and their financiers.
Figure: ‘SBF’ tokens Circulating (Unlocked) Supply at Launch
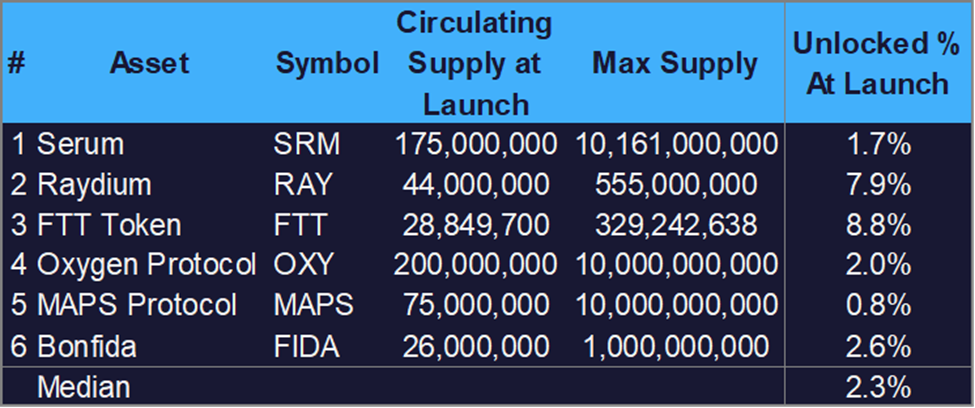
As if this advantage weren’t risk-seeking enough, SBF opted to use the low-supply, price-inflated tokens as collateral to borrow against centralized lenders. Because they pledged these illiquid tokens as collateral, they were incentivized to maintain specific price levels (famously above $22) to prevent their positions from getting liquidated. While the FTX saga was undoubtedly a story of fraudulent mishandling of user funds, the ease with which SBF borrowed against these illiquid tokens also reflects a poor understanding of these supply and liquidity risks by once-revered centralized lenders.
Bearish Unlocks
When liquidity was rife, it was not uncommon to observe inflated prices in the periods following unlock events. This may seem counterintuitive from the outside, as unlock events increase the circulating supply.
However, it is difficult to estimate the cost basis and ownership of tokens getting unlocked due to an active OTC market for locked coins. Wanting to de-risk their locked allocations in profit, some investors will opt to sell unvested tokens at a discount to the current price. This increases the cost basis to which the locked tokens are sold, at times with an extended lock. When the unlock date arrives, holders have a higher cost basis than the initial seed investors. Apart from not being as motivated to sell because of lower unrealized profits, some of them have longer outstanding vesting durations.
Additionally, the narrative overhang of a large proportion of supply coming onto the market is suddenly removed. Because of opaque OTC deals between firms and the removal of the headwind of increasing supply, some unlock events in the past have proved constructive to price action.
Given that we are in crypto’s ice age, however, it is reasonable to project that token unlock events moving forward will put downward pressure on price. To illustrate our point, we examine token unlocks for insiders (team, advisor, and private sale) charted against price for $AXS.
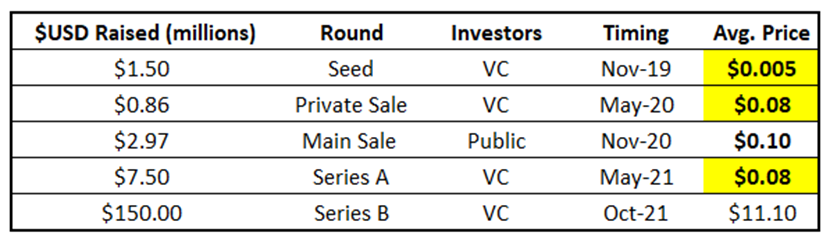
Private sale unlocks matter because, unlike the team or advisors, VCs arguably have a ‘fiduciary duty’ to provide a return to the fund’s LPs, regardless of whether PortCos fulfill their intended long-term vision. Referring to funding terms for the Axie Infinity token ($AXS) below, it is clear that early investors had already exceeded return targets despite ongoing work to build Axie’s ecosystem. Even as $AXS sold off in anticipation of the unlock, early investors had made massive multiples on their initial investment.
Figure: AXS Token Sale Terms
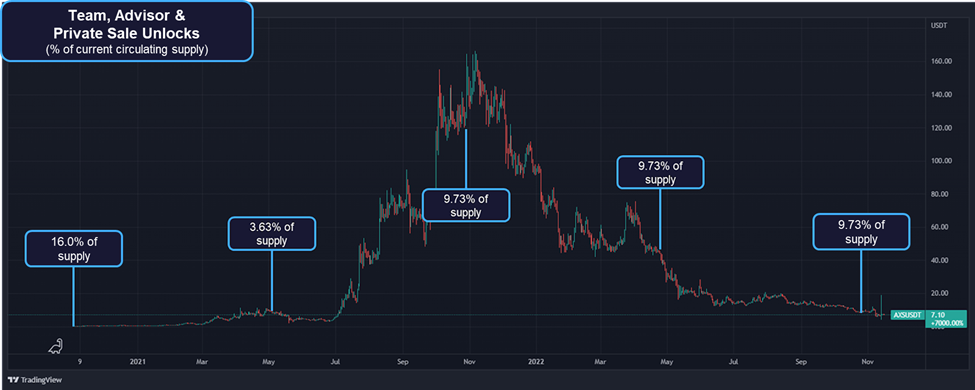
The current team and advisors do not have the duty to provide a return to LPs, but they too want to be compensated by their efforts and lock in runway (in non-native tokens) for the future. The team, advisor, and private sale tokens constitute the majority of cliff unlocks[4], which increases the circulating supply in a stepwise function, as opposed to linear unlocks[1] that increase supply gradually. Evidently, each of the unlock events were followed by periods during which the $[2] AXS token depreciated in price.
Figure: Token Unlock and Proceeding Price Action for AXS
Metrics to Gauge Selling Pressure
Having understood the different dynamics that play into token supply, we provide a few metrics below to gauge tokens with the highest impending sell pressure.
Market Cap / FDV Ratio
Alike [1] Market Cap / TVL, the Market Cap / FDV ratio is perhaps one of the most commonly used metrics to gauge tokenomics design and outstanding supply expansion. Since market cap and FDV are both a function of price, the metric actually alludes to the ratio of circulating supply to maximum supply. The lower the ratio, the higher the proportion of locked tokens relative to total issuable tokens, and vice versa.[2]
Figure: Top 20 Coins with Lowest Mcap / FDV Ratio
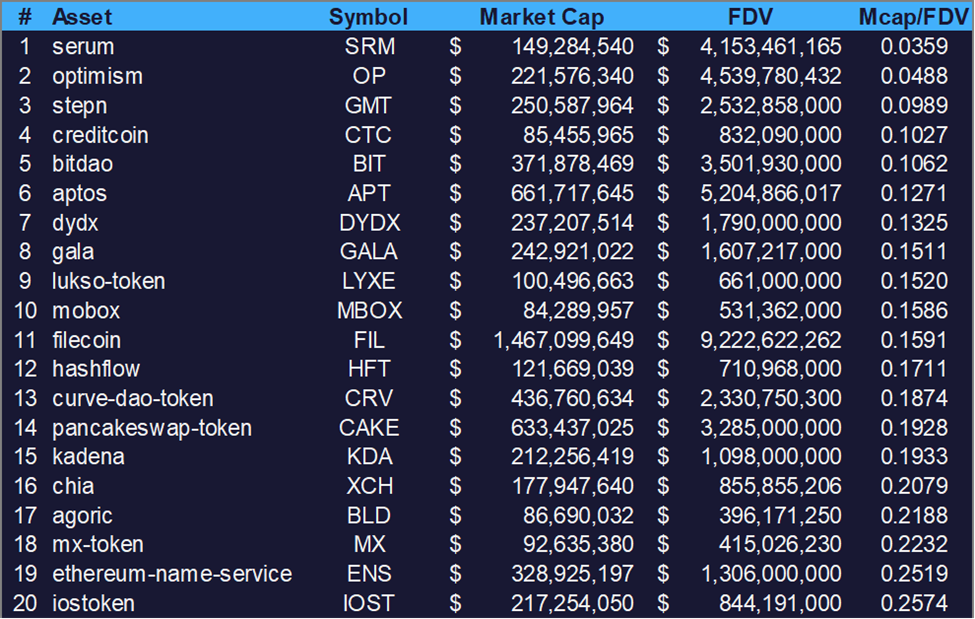
It is worth noting that different tokens have wildly varied distribution schedules. While this ratio provides a good preliminary gauge of impending selling pressure, it does not account for the speed with which these locked tokens will come onto the market.
Token Unlocks / Circulating Supply
To account for speed, we peruse token unlocks in the coming month to the next year. By contextualizing token unlocks as a percentage of circulating supply, we can observe which tokens will expand the most in these coming periods.
Put simply, if supply increases by x%, demand needs to increase by y% to keep prices constant.
Figure: Highest Upcoming Token Unlocks (% of Circulating Supply)
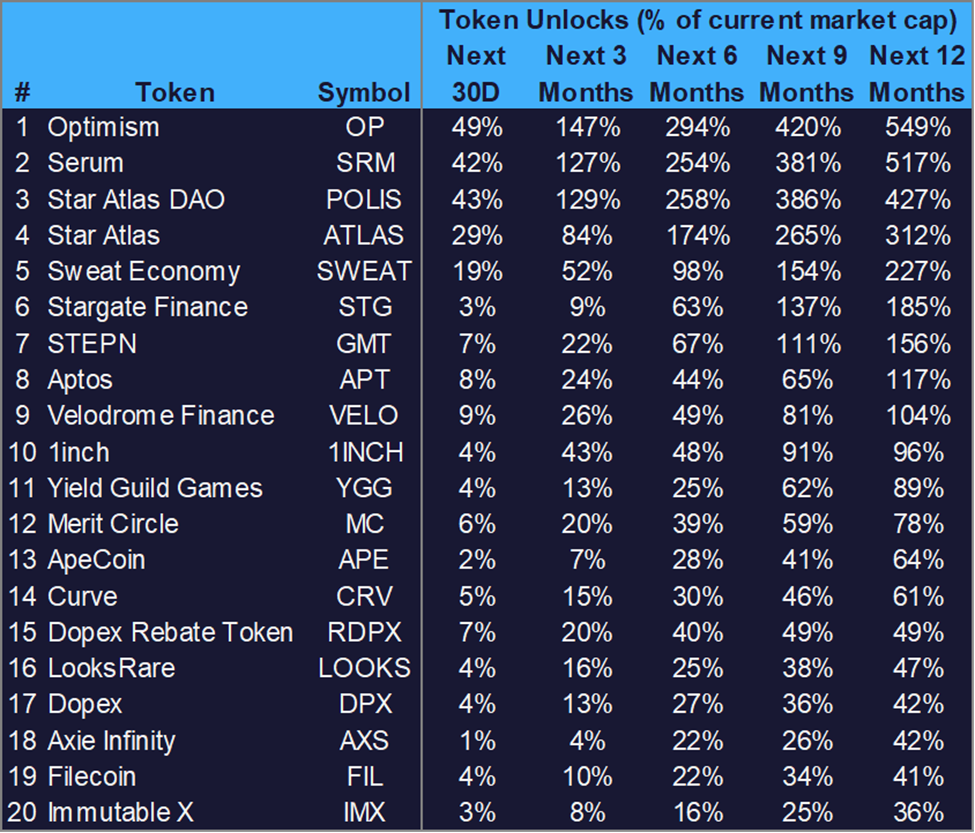
Token Unlocks / Circulating Supply indicates the speed with which circulating tokens inflate, but offers no color on whether there is sufficient liquidity to absorb the impending supply.
Daily Linear Vesting Unlocks / 24 H Volume

For that, we compare the daily average of token unlocks in the coming year to average 24H volume over past 30 days. The prorated sell pressure does not account for the stepwise nature of cliff unlocks, but is a good measure for whether markets have the depth to absorb supply in the coming year.
Bottom Line
We believe sidelined buying pressure in these bear markets will be insufficient to absorb crypto-nuance demissions. Launch dynamics that were designed during bull markets will have over-indexed for retail liquidity and will face significant headwinds in price action. We outline a few metrics to identify large token unlocks relative to their circulating supply and liquidity.
Special thanks to Henry Contreras for his help in writing this piece.
[1] Market cap is an abbreviation for market capitalization.
[2] Circulating supply refers to the amount of coins that are circulating in the market and are tradeable by the public. It is comparable to looking at shares readily available in the market (not held & locked by insiders, governments).
[3] Fully diluted supply refers to max supply (or total supply if max supply is not applicable).
[4] Cliff unlocks are that batch unlocks that give emission schedule a step-wise increase. Linear unlocks are typically scheduled in the form of staking rewards and incentives and increase linearly.
Reports you may have missed

BRC-20 FEVER Ordinal transactions on Bitcoin have skyrocketed in the last few months, leading to an all-time high for daily transactions and pushing Bitcoin network fees to 2-year highs. The activity throttled BTC’s network so much that Binance was forced to temporarily shut down withdrawals and implement Lightening Network to service outflows without paying excessive fees. There are currently two types of Ordinal transactions on the network: 1) Ordinal NFTs...

Fundstrat’s recently launched Crypto Core Strategy offers subscribers a digestible tool to manage their crypto portfolio, with the goal of outperforming bitcoin. For those looking to amplify the returns of their long positions, this complementary issue of DeFi Digest strives to cast light on some of the best risk-adjusted yields. We first describe our methodology to filter for yield opportunities, then dive into the protocols offering the yields, and describe...

FIGURE: A TEAM OF PEPES CONCOCTING THE PERFECT TOKENOMICS Tokenomics (a portmanteau for token and economics) represents the monetary policy of tokens that directly contributes to their price fluctuations. In bull markets, tokenomics were given utmost priority, sometimes constituting full theses for investment decisions. When the euphoria wears off in the bear, however, founders and market participants are left realizing that tokenomics can delay a weak project’s demise, but cannot...

FIGURE: QUANT PEPES TAKING TURNS PREACHING DECENTRALIZED OPTIONS INTRODUCTION AND OPPORTUNITY Options are one of the most popular derivatives in traditional markets among institutional and retail investors. Due to their versatility, traders use options to hedge existing positions, speculate on a security's directional moves, or generate income. In 2021 alone, 33.3b options contracts were traded, up 35% from 2020. Much of this growth can be attributed to retail traders, who...

