Near-term and intermediate-term technical trends remain bullish for US Equities and recent underperformance in Technology has not resulted in US Equities showing much weakness, despite the minor consolidation of the past two days. The resilience of the broader market in the face of Technology weakness is thought to be one key reason why this recent weakness is thought to represent just a minor pullback within the ongoing uptrend. While Equities are entering a seasonally tough time between now and mid-October, it’s going to be difficult to avoid Equities given a dovish Fed, coupled with a resilient economy, better-than-expected earnings season in the face of bearish sentiment.
For now, trends remain intact. If/when SPX gets under early August lows at 6212.21, it will be proper to discuss a pullback getting underway. For now, this minor weakness makes SPX attractive for a push back to new highs, and it remains difficult to get too bearish.
September is here, a month that normally results in sub-par performance. However, given that Goldman’s Flow data has shown institutions preparing for possible volatility over the last couple weeks, it’s tough to expect too much weakness just yet. Moreover, popular individual investor polls like AAII mirror what Consumer confidence reports are suggesting and still paint a rather bleak picture for sentiment.
Overall, it’s proper to mention that ^SPX hit its 25th record high of the year last week, and August proved to be much more resilient than many, including myself, thought might be possible. ^SPX has now risen more than 33% in the last 20 weeks.
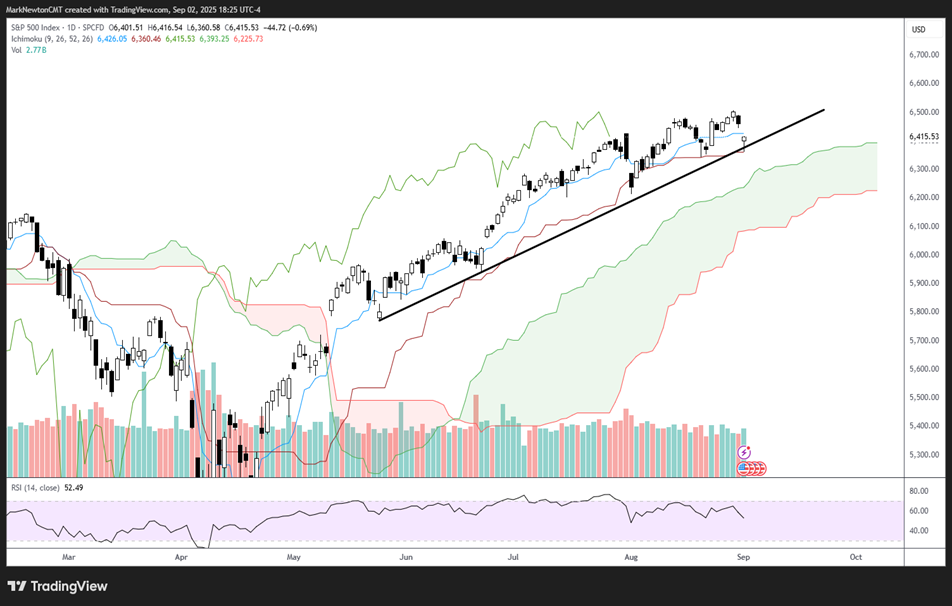
However, the uptrend from late May, as shown below on ^SPX daily charts, has still not been broken, and the mid-August lows have not been breached.
Until this happens, it’s proper not to give this pullback much validity. It’s right to still favor a recovery back to new highs, along with expecting that both Treasury yield and US Dollar index can move lower in the weeks to come.
While the slowdown in momentum is something to watch carefully in the weeks to come, it doesn’t portend an immediate breakdown. To that point, daily RSI 0.09% on ^SPX charts shows the negative momentum divergence as the rally to new highs into August did not result in RSI moving above July peaks. ^SPX largely is still trading at similar levels as it did back in late July, and this will need to change quickly to expect ^SPX to avoid a larger drawdown in the fall.
My own feeling is that a selloff likely will happen between now and mid-October. However, at present, the near-term path of least resistance remains higher. If/when ^SPX pushes back to new highs on sub-par breadth in the next week and/or the US Dollar and/or ^TNX start to push aggressively higher in a way that might cause technical trends to turn higher, then it would be right to pay close attention to the uptrend for ^SPX.
For now, no damage has been caused on this minor “backing and filling”. Until it does, it’s right to remain bullish.
S&P 500 Index
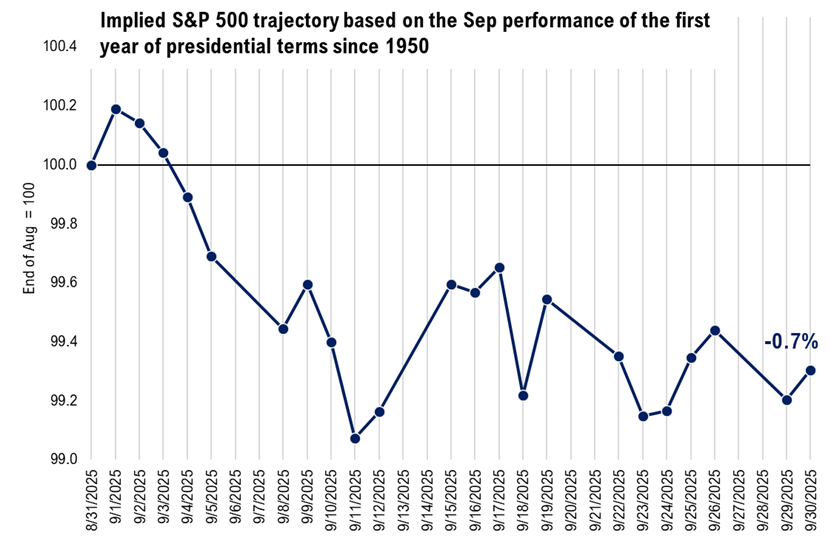
September seasonality doesn’t look kind for Equities; However, neither did August, which worked out just fine
Here’s a snapshot of the possible trajectory for SPX given seasonal trends in post-election years going back since 1950.
As can be seen, the first half of September typically proves to be worse than the back half. However, the bearish trajectory shown last month in possible August seasonality proved to be a failure, as price action proved to be far more resilient.
Overall, while charts like this are interesting, it’s always vital to pay attention to trends, first and foremost. Both seasonality trends and cycles always take a backseat to near-term price trends, which at present, remain bullish.
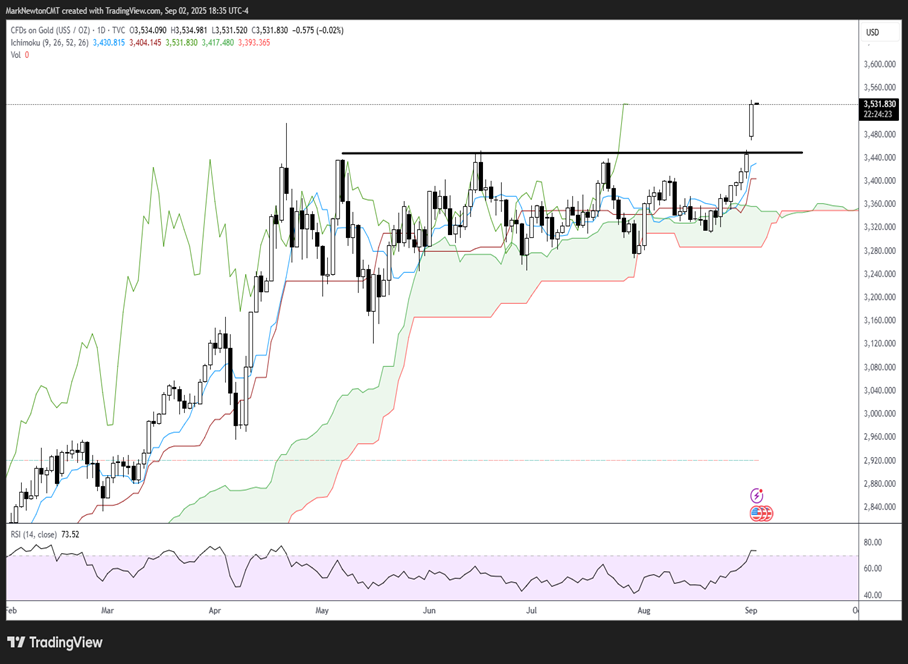
Gold’s breakout back to new all-time highs worth following
Those investors who have been patiently waiting for Gold to make its breakout move were rewarded in recent days, as Monday’s close resulted in the first-ever close for Gold above $3500/oz.
Monday’s gains helped to exceed the intra-day peaks from 4/22/25 highs, resolving a consolidation pattern that’s lasted more than four months.
This is quite bullish on a 1-2 month basis, technically speaking. Consolidations following multi-month uptrends, which are resolved by breakouts to the upside, typically experience further gains in the weeks that follow.
While Gold’s momentum (based on RSI as a gauge) is now firmly back in overbought territory on a daily and monthly basis (and showing negative momentum divergence on a weekly) this is a clear structural breakout which bodes well for upside follow-through up to $3800 in the next month.
Any evidence of weaker economic data later this week that results in Treasury yields and the US Dollar retreating would help to make an even stronger case for near-term technical strength.
At present, given an 88% likelihood of a coming FOMC rate cut, with three more being priced into the market by traders between now and next July, it’s right to stay long precious metals, along with industrial metals like Silver.
ETF’s like IAU -1.50% , GLD -1.49% , are excellent vehicles which can offer exposure to Gold. Moreover, Gold metal and mining ETF’s like GDX -0.57% , and NUGT -1.06% are also appealing technically, and should make further progress over the next month.
CFD’s on Gold (US$/OZ)
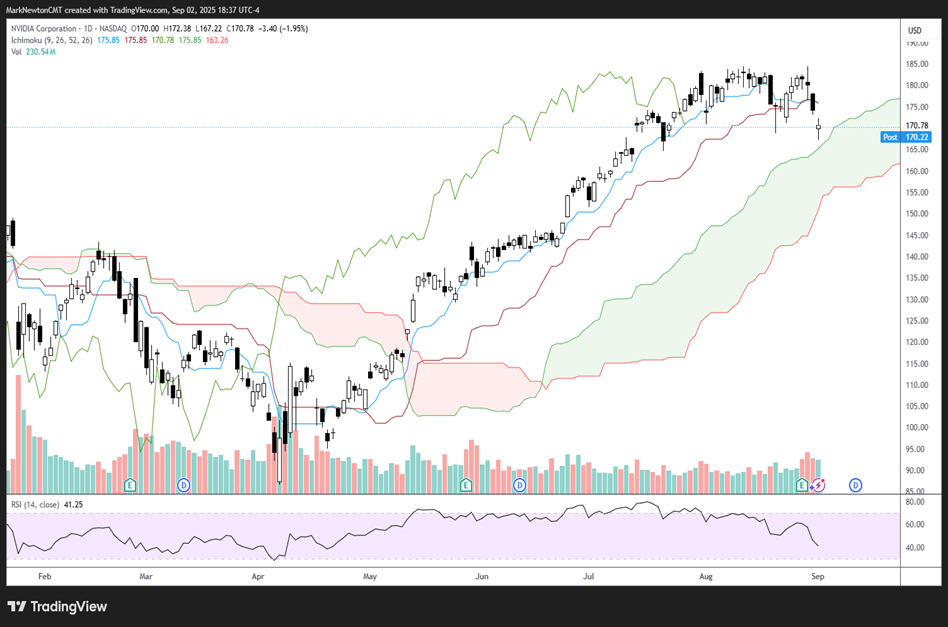
NVDA’s breakdown attempt could likely prove to be a shakeout, for now
While many investors felt NVDA 1.74% had experienced a technical breakdown on Monday, it’s important to note two key technical observations:
- First, price held above its daily Ichimoku cloud pattern and closed up meaningfully off its lows today.
- Price managed to rally back to recoup the prior lows from 8/20/25 that were breached in early trading today as well.
While the slowdown in momentum in NVDA 1.74% is indeed something to monitor closely over the next month, I am still expecting a push back above $184, which might reach $200 before any selling pressure gets underway. Such a move would align with daily NVDA 1.74% cycle composites, and its current pattern appears more like a wave 4 consolidation pattern than a real top from an Elliott perspective. I had written in Flash Insights mid-day Monday that NVDA 1.74% ’s pullback should not likely undercut $176 on this pullback, and I believe it’s right to say that Monday’s recovery likely could set the stage for a rally back to test $184 again over the next couple weeks.
NVIDIA Corporation