

Upcoming 1Q EPS Season a Test of Market Bottom. Social Distancing Working in NYC

Stocks broke a pattern last Wednesday, March 25, managing two successive days of gains, something not seen since February 28th. That’s not a long time but it might feel that way to investors who have experienced this downdraft.
Nevertheless, this trading action generally reinforces our belief that the “structural bottom” for stocks was registered last week (ala Oct 2008) and affirmed by Tom DeMark’s comments to our clients on Tuesday: “The bulk of the downside is behind us…but we might trade sideways for a while….Markets bottom on bad news, not good.”
Investors realize that freakishly bad economic data is coming. On Thursday, jobless claims surged to 3.3 million for the week ended March 21, a record and far above consensus expectations for 1.64 million and the previous record, 695,000 in Oct.,1982. Some economists are projecting weekly jobless claims to surge to as high as 5 million.
Many of our more active and tactical clients are short into this, arguing that such wildly bad news cannot be discounted and thus, this “tape bomb” should lead to a big sell-off. That hasn’t happened—yet—as stocks rose Thursday. The next important test with be the 1Q20 earnings season, which begins about first week of April. The fact is, that the S&P 500 index EPS will be distorted by “depression economic conditions.”
But as we move into April, the cadence of incoming news and data will likely turn more positive. If such is the case, equity markets should be bottoming soon. In fact, the 50% retracement of a decline generally only takes half as long as the decline, exemplified by the ten 30% declines since 1920. This implies we could be back to 2,800 by mid to late April. That is food for thought.
I estimate the SPX monthly EPS runrate has fallen from around $13/month to as little as $4/month because of the massive stoppages, a kind of heart attack for the economy. However, it does not make sense to apply a 15 times P/E multiple to that temporarily lower base. A 15X P/E means investors are paying for 15 years of earnings. The sum of the next 60 quarters for S&P 500 EPS (7% CAGR) is $4,890. Thus, at 2,500, the S&P 500 is valued at exactly half the value of EPS for the next 15 years. That seems extreme.
Moreover, it is important to note that there are some early signs that “social distancing” working in New York City, the hardest hit U.S. region, and it looks like linear COVID-19 growth not exponential. In Italy, fortunately, it seems like total cases indeed peaked on March 21, 2020 and 12 days after instituting stricter quarantine measures.
New York City is now ground zero, but the city and the state have instituted fairly strict social distance measures for some time. We have compiled “daily new cases” for the 5 boroughs below. We only have this data from 3/18/2020 to 3/24/2020 (7 days). But a few notable observations:
– Total new cases in Manhattan was 300 on 3/18/2020 and as for 3/24/2020, total new cases is 367. About FLAT for the past week. Think about that.
– If cases are doubling every 3-4 days, we should have seen 1,200 daily new cases by 3/24/2020. In other words, instead of being an exponential rise in cases, daily cases in Manhattan are linear (flat arguably).
This is good news, in my view, as it suggests that measures like social distancing are leading to a much flatter curve. You might wonder if this is because there is less testing. The opposite is true.
We do not have the test numbers for New York City alone, but we do have it for New York State, where tests went from 8,000 daily on 3/18 to around 12,000-14,000. Yet, with a 50% increase in tests, the number of New York City cases is roughly flat. (See chart nearby.) This argues further that cases are not growing exponentially in New York City.
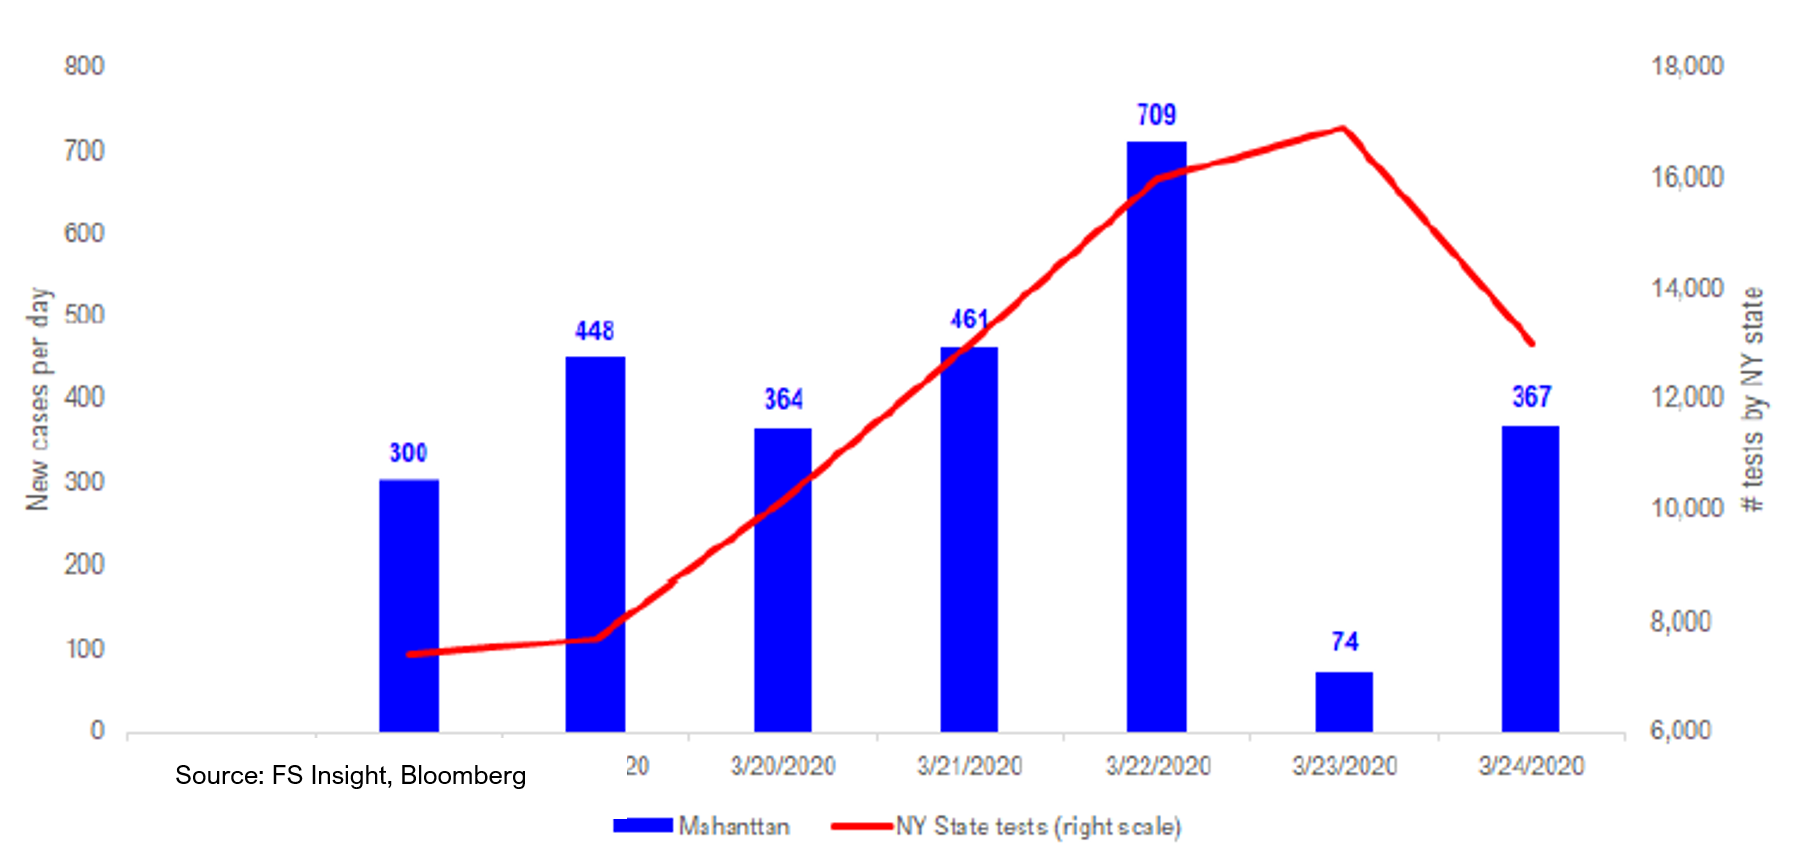
This could obviously change with a super spreader, given the incubation periods. But this is still not a bad data point. We will chalk this up as another “glimmer of hope.”
Furthermore, it looks like that market behavior is shifting in favor of buyers. Our favorite measure of internal market structure is Lowry’s which has continuously tracked buying and selling pressure in markets for >70 years.
Since the sell-off started, stocks have seen six 90% down days, without a single 90% up day. According to Lowry’s, a sustainable bottom cannot be established without evidence of “renewed demand.” Monday, March 23, the US markets posted its first “90% up day” signaling some evidence of renewed demand. Because short covering could be taking place, after such a bloody decline, this is not real demand. Tuesday was an 83% up day, another strong demand day. Lowry’s tends to view two “80%-plus” up days (or one 90% and one 83%) as evidence of renewed buying.
Lastly, a few weeks ago there was a widely circulated Imperial College study that said the U.S. could see deaths of 2-6 million. This is the reason the White House dramatically shifted strategies and basically shutdown the whole economy. It turns out the authors of the original study now revised down the estimate of deaths by 96%. (https://www.imperial.ac.uk/news/196496/coronavirus-pandemic-could-have-caused-40/). This changes things: Downside scenarios are getting reduced odds or eliminated.
What could go wrong? Data could change with change with a super spreader, given the incubation periods.
BOTTOM LINE: There are “glimmers of hope.”
Figure: Comparative matrix of risk/reward drivers in 2020
Per FS Insight
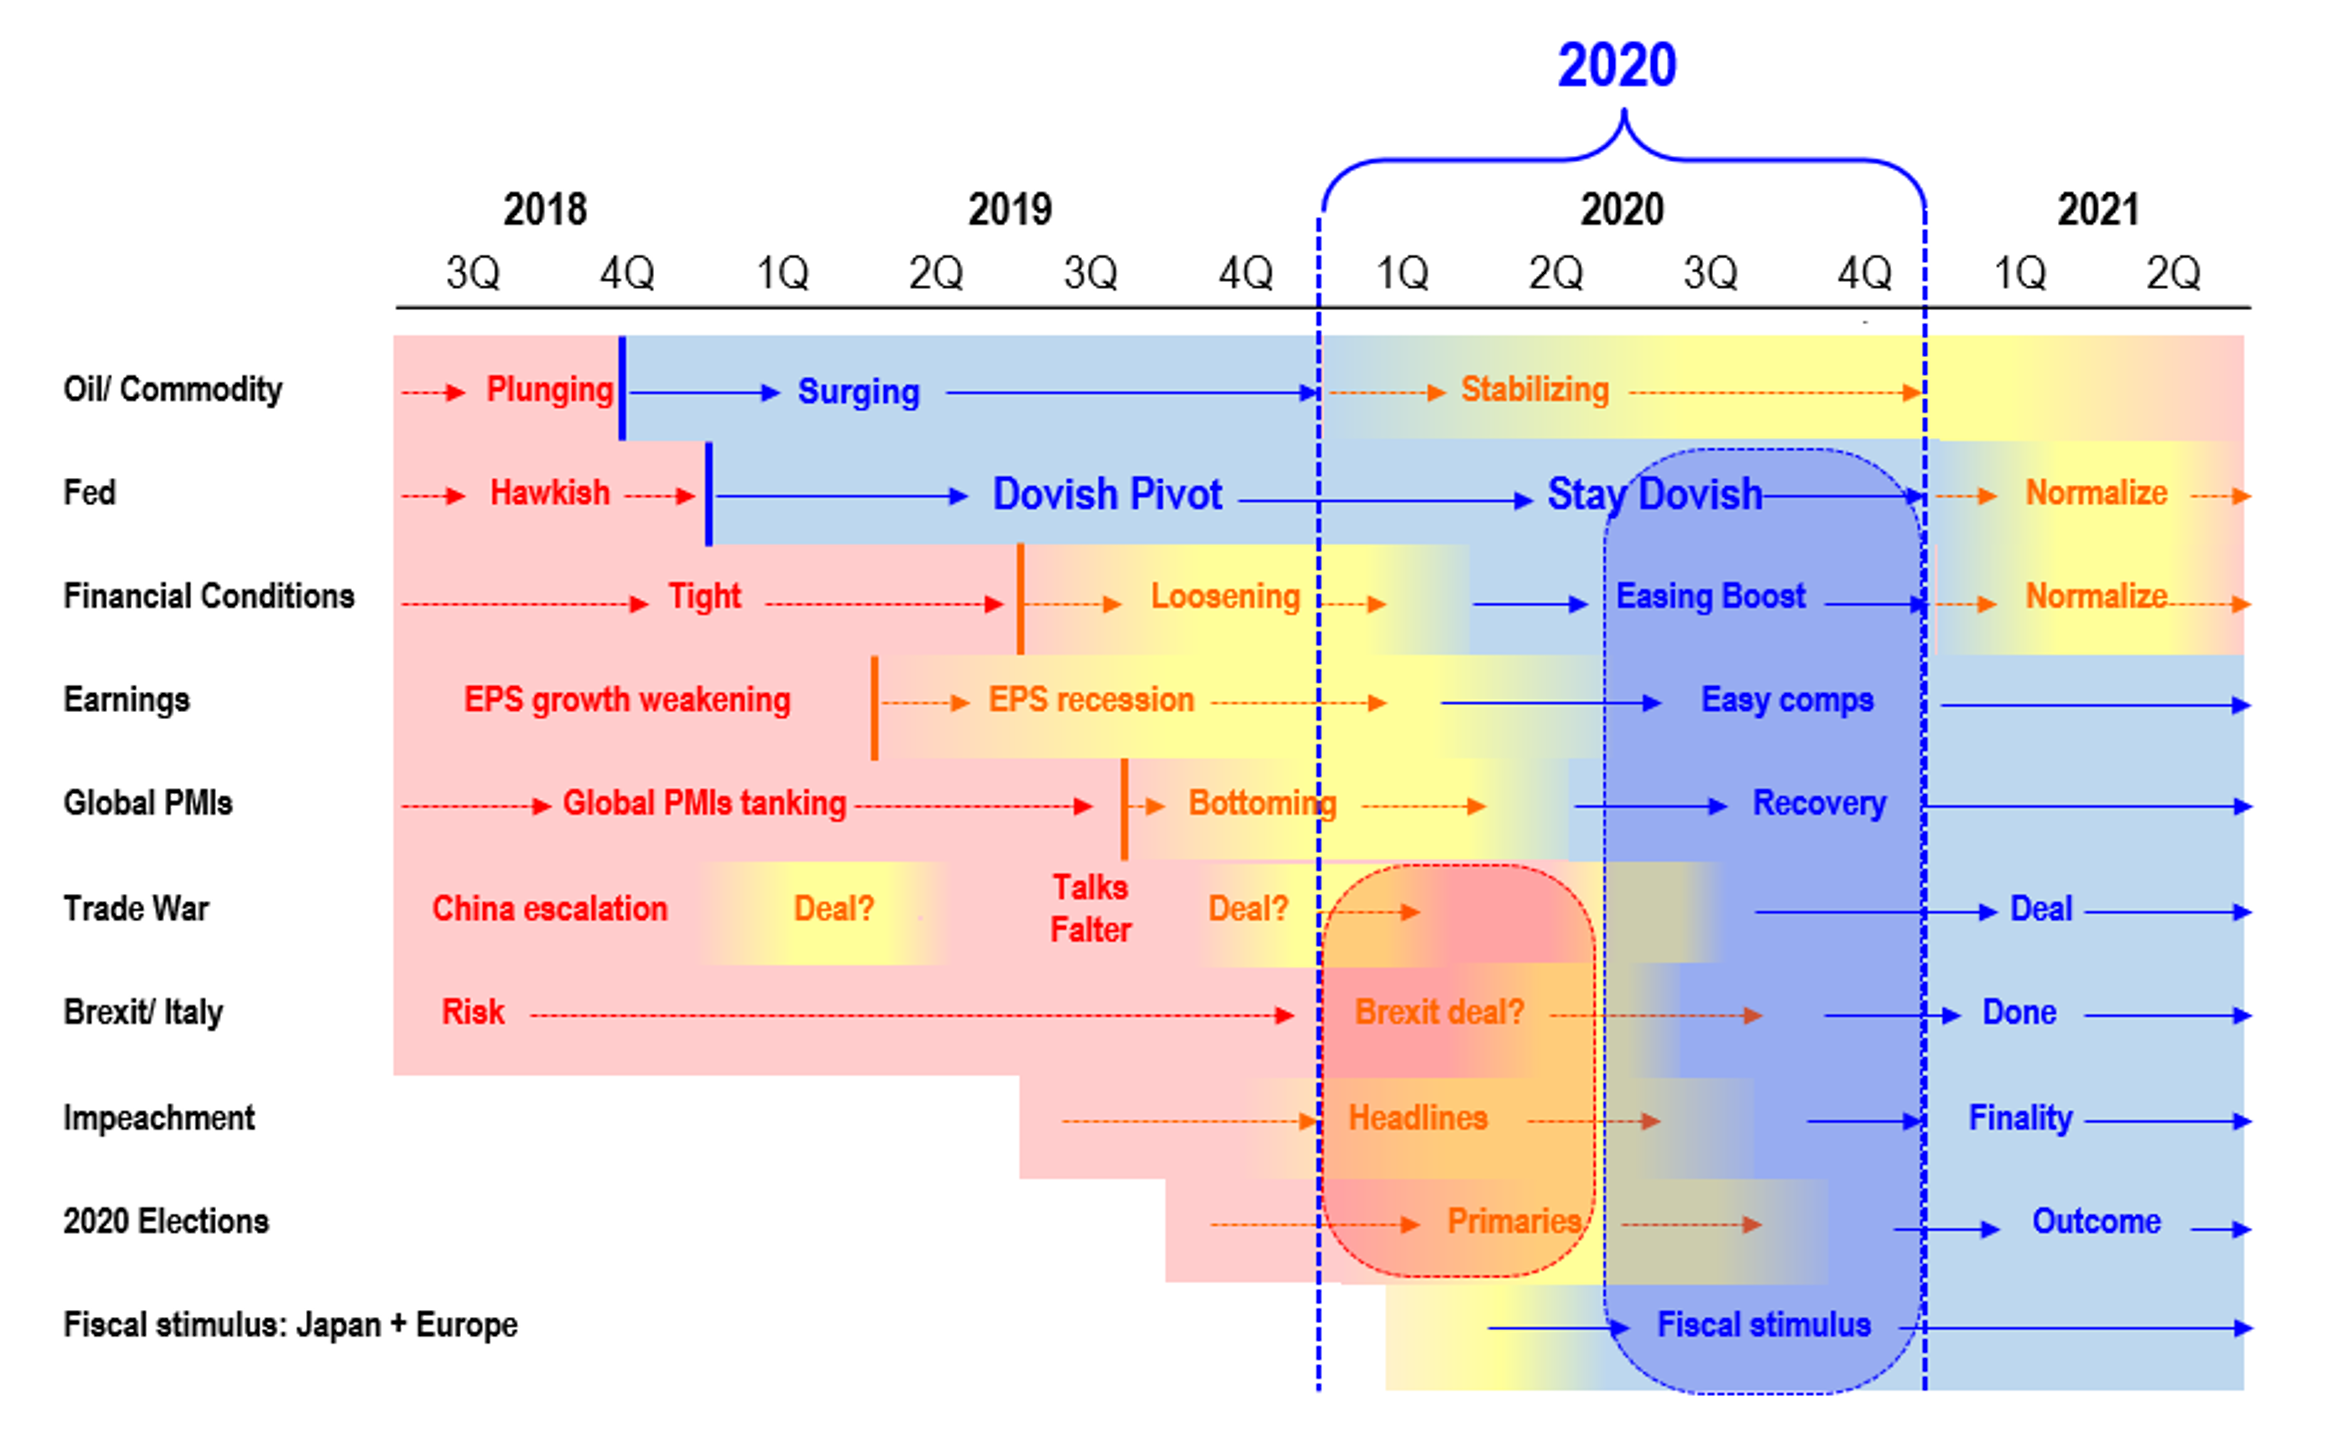
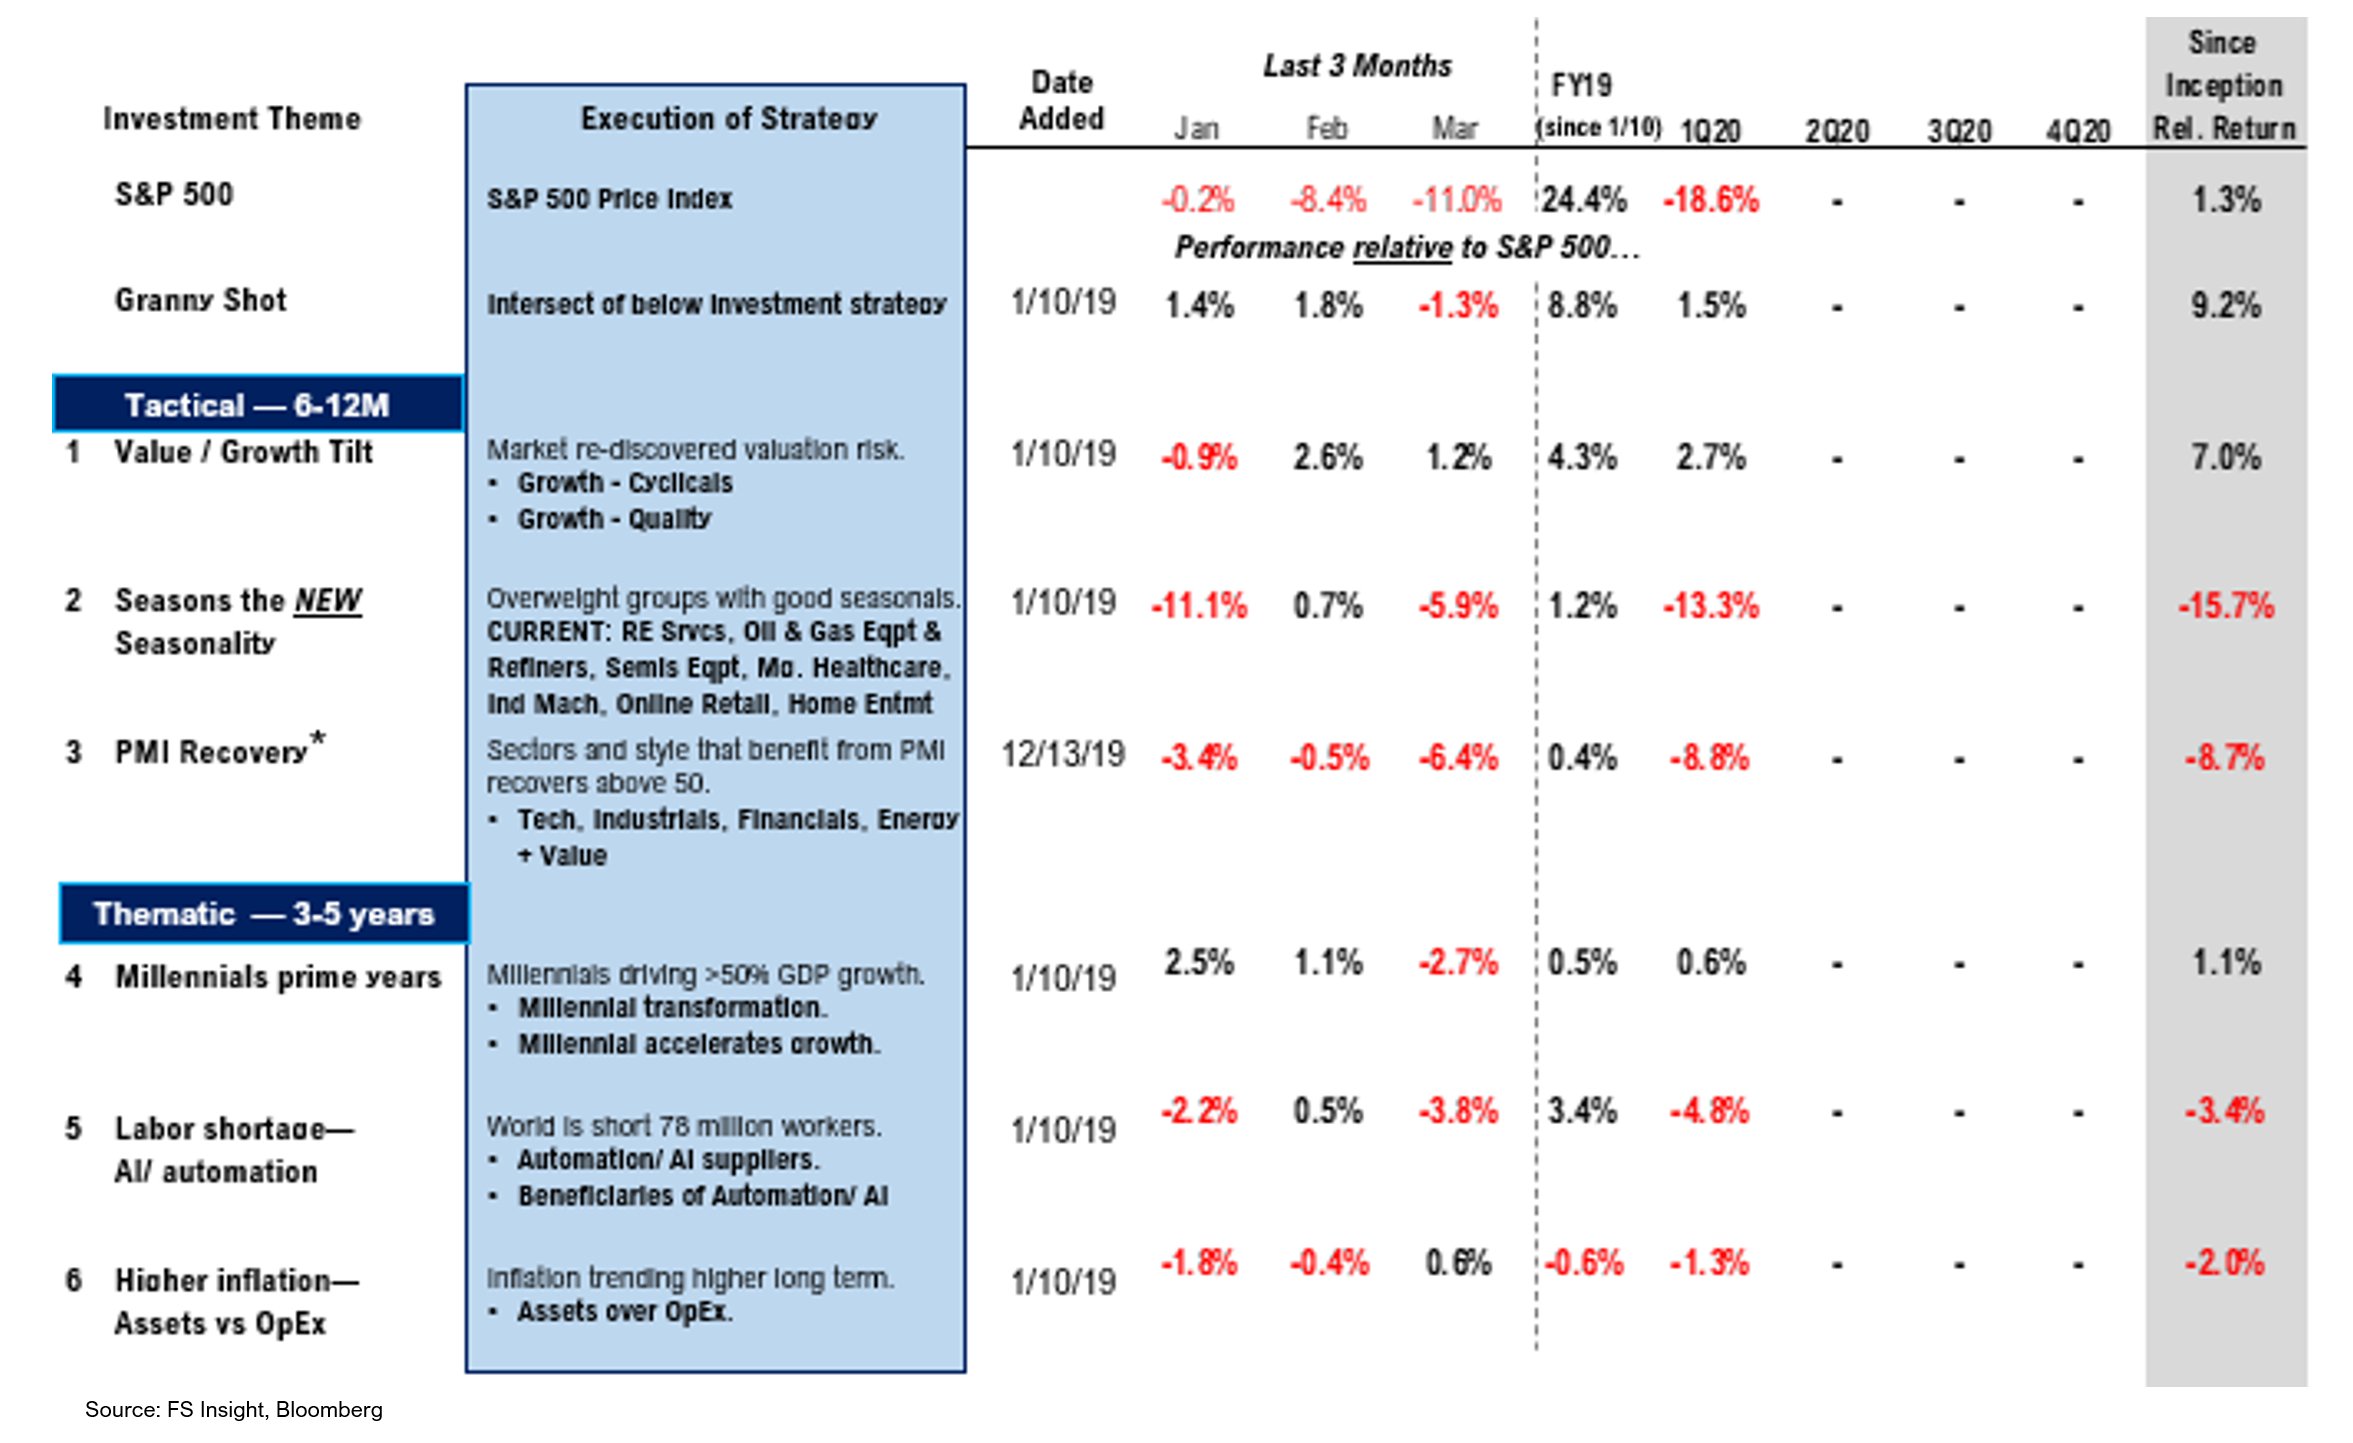
Figure: FS Insight Portfolio Strategy Summary – Relative to S&P 500
** Performance is calculated since strategy introduction, 1/10/2019
More from the author
Articles Read 1/2
🎁 Unlock 1 extra article by joining our Community!
Stay up to date with the latest articles. You’ll even get special recommendations weekly.
Already have an account? Sign In b7f16b-ff38bd-8cb8b8-10d2f4-ca5529
Already have an account? Sign In b7f16b-ff38bd-8cb8b8-10d2f4-ca5529

