


Mkt Stress-Testing Key Levels; Needs to Hold at 2346-2414

The Standard & Poor’s 500 index (SPX) is stress testing an important technical support level between 2346-2414, near the lower end of the cycle lows in 4Q18 at 2346. The upper end coincides with a 62% retracement of the 2016-20 bull market at the 2414 level. An inability to hold those levels would open a risk window for another downside move with next support close to 2100, or the upper end of the 2015-2015 range highs.
I encourage subscribers to listen to our conference call from this past Wednesday featuring Tom Lee (Strategy) Tom Block (Washington), Brian Rauscher (Portfolio Strategy) and myself (Technical). The replay link is on the website. During that call, which includes a slide deck, I discuss a number of noteworthy long- and short-term technical points investors and traders should be aware of.
From a trading standpoint a myriad number of short-term technical indicators are flashing deeply oversold. Daily momentum indicators, such as the relative strength index, among others, are either bottoming or turning positive at a key support band. In addition, internal stress indicators such, as the VIX, along with up-down volume metrics, have all hit levels normally associated with trading lows. In short, we expect a high-risk trading bounce to develop from near current levels coinciding with yet another option expiration week.
The current market and economic backdrop is unprecedented. As I discussed during this week’s conference call and in last week’s note, the SPX breaking below its 200-week moving average, a proxy for the secular trend, is a concerning negative. The obvious risk is that once the secular uptrend is broken a protracted bear market is underway similar to 2008, 2000 or 1974, let alone all our worst fears, 1929.
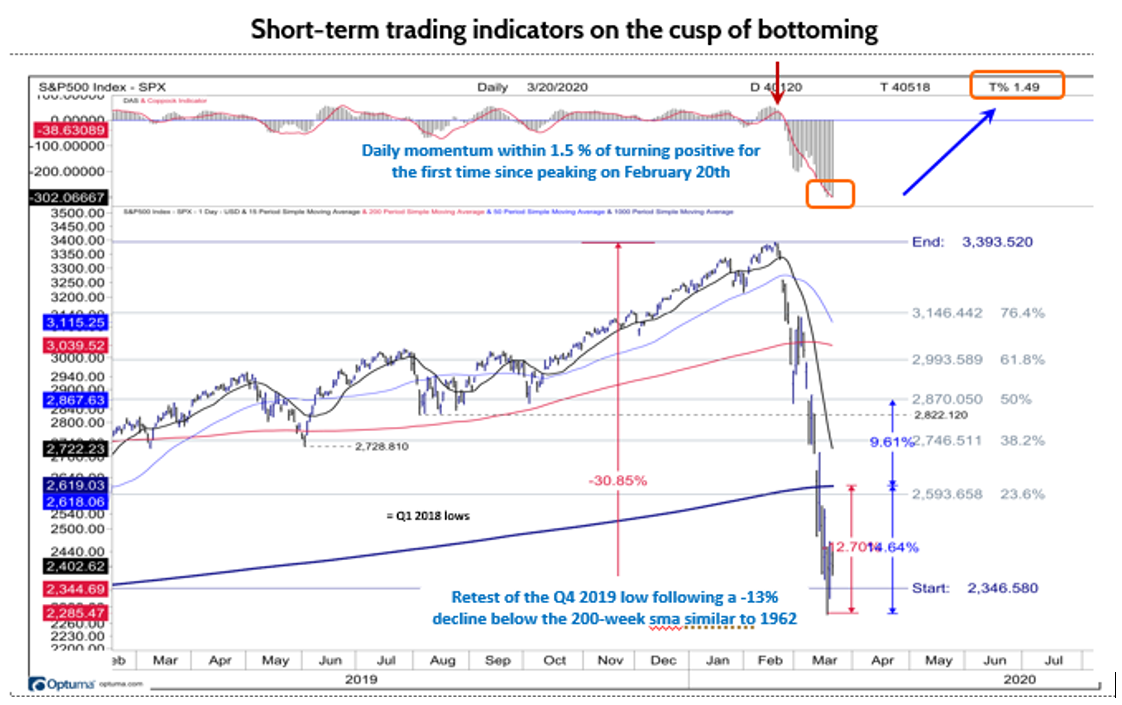
For that reason, I strongly encourage investors to protect capital and wait for technical evidence that a more durable bottom is confirmed. While V bottoms do develop, I believe a multi-month choppy bottoming pattern is more likely with a tactical low optimistically developing into mid-2Q. In fact, the cycle lows that developed in 1957, 1962, 1966 and 2011 all temporarily broke below their 200-week sma only to consolidate/retest 2-4 months later, before resuming new uptrends. The cycle low in 1962 is the strongest parallel to today’s market and the optimistic roadmap I am watching. I continue to expect equity markets to remain very choppy into the middle of Q2 before an intermediate-term bottom develops.
More from the author
Articles Read 1/2
🎁 Unlock 1 extra article by joining our Community!
Stay up to date with the latest articles. You’ll even get special recommendations weekly.
Already have an account? Sign In f2d880-14634b-a57aa8-a0f502-d11e75
Already have an account? Sign In f2d880-14634b-a57aa8-a0f502-d11e75

